My Account
My Slides
Search by Category
Leave Feedback
Login
Logout
Get Started
Browse all Slides
Browse Slides (Pro)
Create a FREE Account
Instant access to 1,000+ real slides from top companies like McKinsey, BCG, Goldman Sachs, Google and many more!
First Name
Last Name
Email
Password
I agree to all
Terms & Privacy Policy
Thank you! Your submission has been received!
Oops! Something went wrong while submitting the form.
Have an account?
Sign in
Saved Slides
The slide shows a horizontal bar chart with survey results on globalization and global citizenship feelings across different countries.
Market Analysis and Trends
Technology & Software
The slide highlights global survey results indicating people's positive attitudes towards globalization and global citizenship.
Globalization, global citizenship, survey, public opinion, international trends
Mixed Chart
IPSOS
Saved
Features two column charts comparing the underlying TOP margin over time and a circle representing ROIC comparison, along with text annotations detailing financial strategies.
Financial Performance
Consumer Goods
Provides an overview of financial performance in emerging markets, emphasizing improvements in margins and returns. Useful for financial analysis and understanding the impact of operational efficiencies on profitability.
financial performance, margins, ROIC, profitability, operational efficiency
Mixed Chart
Deutsche Bank
Saved
The slide presents a curved line chart showing the stages of digital marketing maturity from nascent to multi-moment, labeled with descriptions of each stage.
Market Analysis and Trends
Professional Services
Describes the assessment of brands' digital marketing maturity through stages, highlighting the progression from nascent to multi-moment maturity.
digital marketing, maturity, brands, assessment, progression, nascent, connected, multi-moment
Linear Flow
BCG
Saved
A combination of text boxes with key points and a capital impact schedule in a table format.
Regulatory and Compliance
Financial Services
Details the elimination of prior capital drag from pensions, including actuarial valuations, pension transaction unwind, and capital impact schedule.
pensions, capital drag, actuarial, transaction unwind, capital impact
Mixed Chart
Barclays
Saved
Features bar charts detailing the challenges automotive companies face in securing funding for digital transformation, accompanied by a list of reasons for funding refusals.
Financial Performance
Transportation & Logistics
Analyzes the difficulties automotive companies encounter when seeking board approval for digital projects, including common reasons for refusal and the extent of these challenges.
funding, automotive, digital transformation, board approval, investment challenges
Mixed Chart
Accenture
Saved
The slide has a bar chart showing the progression of current and future FinTech users, including lapsed users and anticipated future users.
Market Analysis and Trends
Financial Services
The slide forecasts that FinTech adoption will surpass 50%, showing a detailed breakdown of user categories and predicting significant future growth.
FinTech, adoption, forecast, user categories, future
Mixed Chart
EY
Saved
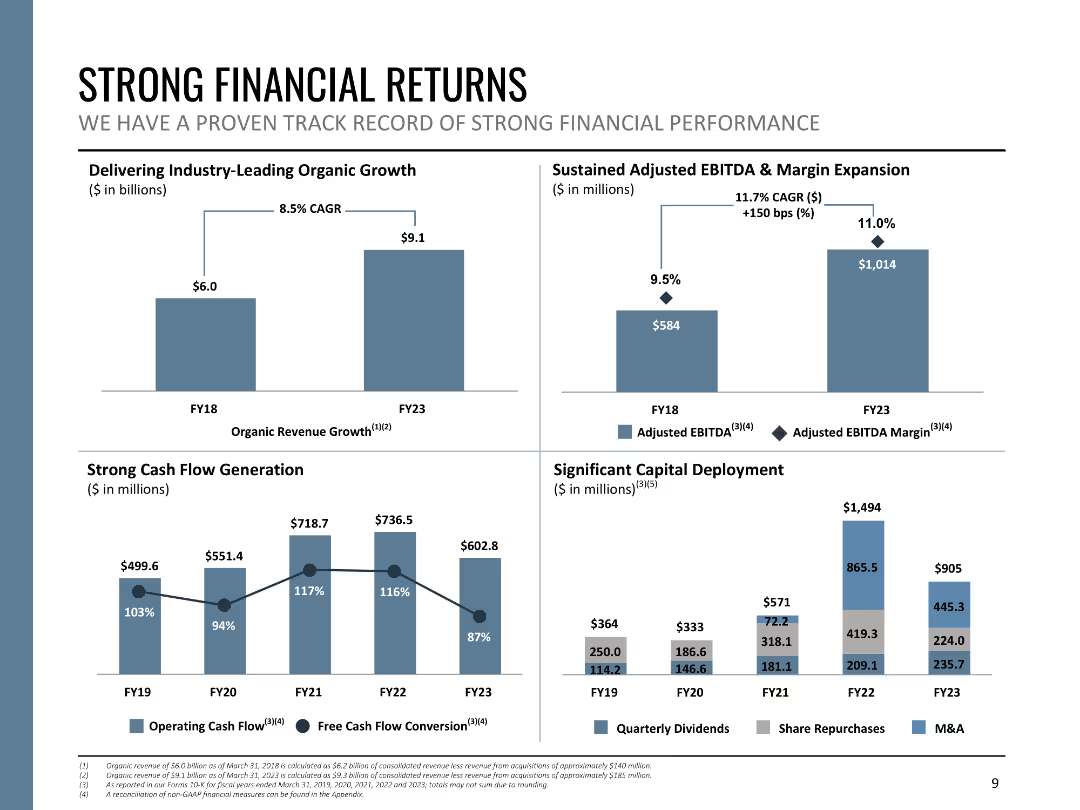
The slide includes four column charts displaying financial metrics such as organic revenue growth, adjusted EBITDA, cash flow generation, and capital deployment from FY18 to FY23. Each chart is clearly labeled with distinct colors and values.
Financial Performance
Financial Services
This slide presents Booz Allen's financial performance, showcasing strong organic growth, EBITDA margin expansion, cash flow generation, and significant capital deployment. It demonstrates the company's robust financial health and strategic investments.
financial returns, growth, EBITDA, cash flow, capital deployment
Multiple Chart
Booz Allen Hamilton
Saved
A bar chart showing potential reach of the TV screen by source for different age groups, with a focus on AVOD reach and its incremental gain.
Market Analysis and Trends
Media & Entertainment
The slide highlights that AVOD content has the greatest reach potential among younger viewers, showing significant incremental gains in audience reach.
AVOD, reach, potential, younger viewers, incremental gain
Multiple Chart
Nielsen
Saved
Column charts showing total revenues and operating expenses by currency for various sectors
Financial Performance
Financial Services
Illustrates revenue and expense currency mix across different business sectors
revenue, expenses, currency, mix, UBS
Multiple Chart
UBS
Saved
A world map marked with various investment locations, accompanied by logos representing different sectors such as private equity and real estate.
Investment Analysis
Financial Services
Elucidates on the diversity and scope of the company's alternative investment platform, indicating different sectors and regions involved in the investment strategy.
Alternative investments, private equity, real estate, global
Graphic
Goldman Sachs
Saved
The slide features a bar chart, a line chart, and a column chart. It includes text and multiple visual elements like charts and graphs, making it moderately complex.
Regulatory and Compliance
Financial Services
The slide explains how cost-of-living adjustments (COLA) protect retirees' purchasing power by showing differences in spending, inflation impact, and benefits growth.
COLA, retirees, inflation, spending, benefits, purchasing power
Multiple Chart
UBS
Saved
The slide features stacked column charts depicting the distribution of retail categories in e-commerce GMV. It utilizes contrasting colors to differentiate categories and includes descriptive text.
Market Analysis and Trends
Technology & Software
The slide compares the online shopping trends for groceries over time and the expected continuity of these habits. It provides insights into changing consumer behavior and market opportunities.
e-Commerce, groceries, online shopping, consumer behavior, market trends
Mixed Chart
Bain
Saved
Continuation from the previous slide, providing more industries with images and bullet points.
Technology and Digital Transformation
Telecommunications
Highlights the influence of digital trust technologies on industries like aerospace and defense, education, media, and telecommunications.
aerospace, defense, education, media, telecommunications, digital trust impact
Header Vertical
McKinsey
Saved
A slide featuring pie charts that correlate company size with preferred work environment options. It uses a simple color code to differentiate between the types of work environments.
Performance Metrics and KPIs
Professional Services
This slide is likely used in HR and management presentations to discuss how flexible work arrangements can maximize employee performance across different company sizes.
Flexible Work, Employee Performance, Company Size, Work Environment, HR Management
Multiple Chart
EY
Saved
Slide features two column charts showing Copernicus economic impact with gradients of blue, and a list of key Copernicus products highlighted with icons.
Market Analysis and Trends
Environmental Services & Sustainability
Highlights economic impacts and key products of Copernicus for urban monitoring, focusing on data usage for city models and satellite imagery applications.
Copernicus, economic, urban, satellite, data monitoring, city modeling, environmental impact
Mixed Chart
PwC/Strategy&
Saved
The slide features column charts and text blocks. The left side shows employee support for vaccination policies by region, and the right side presents global vaccination intent.
Risk Assessment and Management
Professional Services
Explores employee preferences for mandatory vaccinations for safe return to work, including regional differences and overall support levels.
vaccination, safe return, survey, regional differences, employee preferences
Multiple Chart
EY
Saved
The slide features three circular icons representing financial outlook, strategic priorities, and digitalization and innovation. Each icon is accompanied by a text box explaining the respective focus area.
Financial Performance
Healthcare & Pharmaceuticals
This slide provides an overview of financial outlook for hospitals, strategic priorities post-COVID-19, and ongoing focus on digitalization and innovation in the healthcare sector.
financial, outlook, strategy, digitalization, innovation
Pillar
LEK
Saved
This slide is filled with textual content and data-centric elements, including a column chart with red annotations and a table with numeric values. The use of blue color coding organizes the information into three sections, highlighting key business metrics from 2014 to 2019.
Financial Performance
Financial Services
It demonstrates the momentum across key business drivers, with comparisons of year-over-year and compound annual growth rates in consumer and business banking. The included data elements and textual descriptions suggest that the slide is used to convey the financial strength and growth within the banking sector, specifically focusing on JPMorgan Chase & Co.'s performance.
Consumer Banking, Business Banking, Growth, Deposits, Investments, CAGR, Financial Strength, JPMorgan Chase & Co.
Table
JP Morgan
Saved
The slide features a hexagonal diagram with different sections representing various capital financing options like private equity, venture capital, and public listing.
Investment Analysis
Financial Services
The slide explores alternative capital financing options that local firms are considering, beyond traditional bank financing, highlighting their appetite for private equity and other sources.
private equity, capital financing, venture capital, IPO, non-traditional financing
Diagram
EY
Saved
Features multiple pie charts with accompanying descriptive text. Uses green and gray color scheme.
Regulatory and Compliance
Environmental Services & Sustainability
Details the pressure from various stakeholder groups on companies to act on climate change.
Stakeholders, pressure, climate change, company actions
Multiple Chart
Deloitte
Saved
Features a creative and vibrant collage of images and text, serving as the cover of a report. The design is modern and engaging, with bold text for the title and authors.
Strategic Planning
Financial Services
Serves as the introductory slide for a financial outlook report, likely setting the stage for discussion on strategies for sustained returns in the current economic climate.
Financial Outlook, Strategy, Investment, Market Conditions, Economic Climate, Return on Investment, Financial Planning, Report Cover
Title
Citigroup
Saved
The slide features a pie chart showing survey results about organizations' tax strategies. It includes textual sections for introduction, key takeaways, and detailed findings.
Regulatory and Compliance
Financial Services
This slide presents survey findings on the absence of documented tax strategies in organizations. It emphasizes the need for clear tax strategies in the Nigerian Financial Services Industry and discusses potential impacts of their absence.
tax, strategy, compliance, survey, financial services, documentation, pie chart, organizational policy
Mixed Chart
PwC/Strategy&
Saved
Comprises a descriptive text and a series of bar charts illustrating adherence levels to public health guidelines, segmented by millennials and Gen Z.
Client Case Studies
Healthcare & Pharmaceuticals
Reviews the adherence of millennials and Gen Z to COVID-19 health guidelines, providing statistical insights and societal behaviors.
COVID-19, Millennials, Gen Z, Health Guidelines, Social Research
Mixed Chart
Deloitte
Saved
This slide displays a stacked column chart for global Cash Equities revenue and two line graphs for share of Cash Equities volumes in the U.S., EMEA, and APAC.
Financial Performance
Financial Services
Reviews the revenue and market volume trends in Cash Equities from 2014 to 2018, showcasing growth and focus areas.
cash equities, revenue, growth, market trends
Multiple Chart
JP Morgan
Saved
This slide features two column charts. The left chart shows office vacancy rates by city, and the right chart compares city center to CBD vacancy rates.
Market Analysis and Trends
Real Estate & Construction
It analyzes office vacancy rates in major European cities, highlighting differences between overall city and central business districts (CBD).
real estate, office, vacancy rates, city, CBD, Paris, Munich, Milan, London
Multiple Chart
JP Morgan
Saved
Previous
Next
If nothing, comes up, please save your slides first
Create a FREE account to continue browsing
Receive Instant Access to 7,500+ of the internet's best slides
First Name
Last Name
Email
Password
I agree to all
Terms & Privacy Policy
Thank you! Your submission has been received!
Oops! Something went wrong while submitting the form.
Have an account?
Sign in
Column Chart
Heatmap
Chevron
Org Chart
Infographic
Callouts
Timeline
List
Graphic
Picture
Process Flow
Diagram
Paragraph
Map
Table
Framework
Subtitle
Takeaway Box
Icon
Other Chart
Radar Chart
Waterfall Chart
Mekko Chart
Pie Chart
Scatter Plot
Line Chart
Bar chart
Bullet points