My Account
My Slides
Search by Category
Leave Feedback
Login
Logout
Get Started
Browse all Slides
Browse Slides (Pro)
Create a FREE Account
Instant access to 1,000+ real slides from top companies like McKinsey, BCG, Goldman Sachs, Google and many more!
First Name
Last Name
Email
Password
I agree to all
Terms & Privacy Policy
Thank you! Your submission has been received!
Oops! Something went wrong while submitting the form.
Have an account?
Sign in
Saved Slides
Slide features bar graphs comparing three survey years across various tech issues impacting underwriters' workload. Purple theme, vertical bars.
Market Analysis and Trends
Financial Services
Analyzes the impact of technological challenges on underwriters' workload over time, highlighting areas such as process integration and data issues.
technology, underwriting, workload, integration, survey, data, performance, training
Mixed Chart
Accenture
Saved
The slide features a text block discussing key considerations for pharma executives and a radar chart illustrating strategic imperatives.
Strategic Planning
Healthcare & Pharmaceuticals
This slide provides an overview of the main considerations for pharma executives, including strategic imperatives and business leadership elements.
pharma executives, strategic imperatives, business leadership, strategic planning, radar chart
Diagram
Roland Berger
Saved
The layout includes a bar graph labeled "FIGURE 5", textual analysis on the left, and quotes pertaining to the role of AI in skill development.
Market Analysis and Trends
Technology & Software
Focusing on China, the slide projects the future of work roles from 2017 to 2028, addressing the dominant employment sectors and the impact of automation on labor distribution.
China, Labor, Automation, Skills, Future
Mixed Chart
Accenture
Saved
Column charts showing underlying revenues, costs, PBT, and key metrics
Financial Performance
Financial Services
Highlights financial performance metrics for 1Q24, including revenues, costs, PBT, and key metrics
financial, performance, 1Q24, metrics
Multiple Chart
UBS
Saved
Contains a bar chart and a column chart, with blue-green color scheme. Text is used to provide context and explanations.
Regulatory and Compliance
Environmental Services & Sustainability
Highlights the importance of climate change in corporate strategy and investments, focusing on the top pressing issues and changes in sustainability investments.
Climate change, sustainability, corporate strategy, investments
Multiple Chart
Deloitte
Saved
A circular diagram categorizes companies into four sectors: pure-play fintechs, established financial services players, consumer tech platforms, and established consumer players, with examples for each. The slide layout is complex, featuring a network of interactions between different categories of players.
Competitive Landscape
Financial Services
This slide outlines the competitive landscape in the financial services industry in 2019, showing various market players from established banks to new tech entrants and their interrelations, emphasizing the diverse ecosystem within the digital financial services space.
competitive, landscape, financial services, fintechs, tech platforms, market players, 2019
Diagram
Bain
Saved
This slide presents three strategic focus areas—Scale & Efficiency, Comprehensive Client Solutions, and Investing for the Future—each with icons and bullet points. The design is sleek with plenty of whitespace, balancing text and visual elements such as icons.
Strategic Planning
Financial Services
JPMorgan Chase's slide outlines its strategy for business and client growth, detailing operational efficiency through technology, client solution delivery, and investment for future needs. It could be used to communicate to stakeholders about ongoing and future strategic initiatives, emphasizing areas like ETFs, digital assets, and data solutions for sustaining and enhancing market presence.
Growth, Strategy, Efficiency, ETFs, Alternatives, Digital Assets, Data Solutions, Technology, Investment, Clients
Pillar
JP Morgan
Saved
The slide has a black background with white text, a column chart indicating changes in interest for acquiring foreign targets, and reasons driving this interest shown in another chart.
Mergers and Acquisitions
Financial Services
Examines the factors driving increased or decreased interest in acquiring foreign targets, supported by data on how interest levels are expected to change over the next year.
foreign targets, acquisition interest, survey data, M&A strategies, drivers
Multiple Chart
Deloitte
Saved
The slide has two pie charts illustrating the distribution of CA Directors reporting directly to the CEO versus those not on ExCo. It includes textual explanations and quotes in a two-column format with highlighted statements in blue.
Organizational Structure and Change
Professional Services
This slide explains the reporting structure of Corporate Affairs Directors, highlighting the role of Chief Officers and emphasizing the strategic importance of these positions within the company.
CA Directors, CEO reporting, Corporate Affairs, Governance, ExCo
Multiple Chart
Deloitte
Saved
The slide features a diagram with three main funding categories: Fundraising, Funding Options, and Funding Agnostic. It includes bullet points and a circular diagram to explain different funding sources and strategies. Visual complexity is moderate.
Financial Performance
Financial Services
This slide explains the various funding options available for ventures, highlighting key considerations in the fundraising process and detailing different funding sources such as equity raise, venture debt, and bank financing.
Funding, ventures, options, equity, debt, bank, Deloitte
Linear Flow
Deloitte
Saved
Graphical representation of deskless workers in various industries, icons for each sector, and a high-impact indicator.
Technology and Digital Transformation
Technology & Software
Overview of industries with a high proportion of non-desk workers potentially affected by AR/VR technologies, emphasizing immersive reality's scalability in these sectors.
Deskless workers, industries, AR, VR, immersive reality, scalability
Graphic
McKinsey
Saved
The slide features a header image of a person using a contactless payment system, with two columns of text and small images below the text.
Technology and Digital Transformation
Retail & E-commerce
Discusses the rise of digital payments, highlighting mobile payments, crypto, smartwatches, and the impact on retailers.
Digital Payments, Mobile, Crypto, Smartwatches, Retail, AmazonGo, Convenience, Online Stores, Payment Methods, Checkout
Multiple Chart
Deloitte
Saved
Features a line graph and small text sections for insights.
Strategic Planning
Technology & Software
Discusses the increasing use of marketing analytics in decision-making processes, with data points over time and projected trends.
Marketing, Analytics, Decision Making, Trends, Projection, Line Graph, Use, Strategic Planning, Data Points
Mixed Chart
Deloitte
Saved
Features two column charts comparing access to electricity and reliability of grid power in Nigeria with other countries.
Market Analysis and Trends
Energy & Utilities
Highlights the challenges of grid reliability in Nigeria and its impact on the reliance on solar energy, using comparative data with other countries.
grid reliability, solar energy, Nigeria, electricity access, market impact
Multiple Chart
BCG
Saved
The slide features a large, smiling person in the foreground with a blurred background. Text to the right highlights "6 action items".
Strategic Planning
Technology & Software
This slide is likely used to present strategic action items that businesses need to address for future planning.
businesses, action items, strategic, planning, future, address, presentation
Title
Bain
Saved
Simple layout with bullet points detailing the investment thesis for Citizens, organized around key pillars of capital, initiatives, performance, and future outlook.
Investment Analysis
Financial Services
Outlines the investment thesis for Citizens, focusing on robust capital, strategic initiatives, performance since IPO, and medium-term outlook, aiming to attract potential investors.
investment, thesis, Citizens, capital, initiatives, performance, IPO, outlook, investors
Vertical Flow
Goldman Sachs
Saved
Bar chart showing the number of years until 25% of the US population adopted various technologies, from electricity to tablets. Text discusses the increasing speed of technology adoption over time.
Technology and Digital Transformation
Technology & Software
The slide presents the accelerating pace of technology adoption in the US, comparing different technologies' adoption rates from the late 19th century to the present. It emphasizes how the faster adoption of new technologies is crucial for driving economic growth and adapting to rapid changes in the tech landscape.
Technology Adoption, US, Speed, Economic Growth
Mixed Chart
Roland Berger
Saved
The slide presents three line charts showing Japan y/y real GDP (2005-25F), Japan unemployment rate (2005-25F), and Japan y/y CPI (2005-25F). The charts are clear with historical data and future projections, complemented by detailed text.
Market Analysis and Trends
Financial Services
This slide forecasts Japan's economic trends, predicting constraints due to soft consumer spending, cautious capex, and weak global growth. It discusses easing inflation and its potential impact on purchasing power and economic recovery.
Japan economy, GDP, unemployment, CPI, forecast
Multiple Chart
EY
Saved
This slide includes a Venn diagram of "2020 Strategy" and "Good Growth," emphasizing sustainability with icons for performance, people, products, planet, and purpose around it.
Strategic Planning
Consumer Goods
Presents the Clorox Company's strategy focused on profitability, sustainability, and responsibility through environmental, social, and governance commitments. Useful for presenting company values and strategic direction.
sustainability, strategy, ESG, profitability, Clorox
Framework
Barclays
Saved
Features a line chart showing investment projections over 20 years under low and high growth scenarios, with key projects listed. Visuals include icons and highlighted text boxes.
Investment Analysis
Energy & Utilities
Examines potential economic impacts of proposed oil and gas investments, detailing low and high growth scenarios and listing key projects in development.
Investment, Growth Scenarios, Economic Impact, Oil and Gas, Western Australia, Key Projects, Future Capacity
Mixed Chart
EY
Saved
Multiple icons representing different sales channels with accompanying percentage data across different countries.
Market Analysis and Trends
Retail & E-commerce
Compares the prevalence of various e-commerce platforms for luxury goods in different markets, highlighting the rise of social-linked sales, informative for strategic planning in e-commerce.
e-commerce, luxury retail, marketplace dominance, social media sales, international comparison, digital transformation, retail trends, sales channels
Table
BCG
Saved
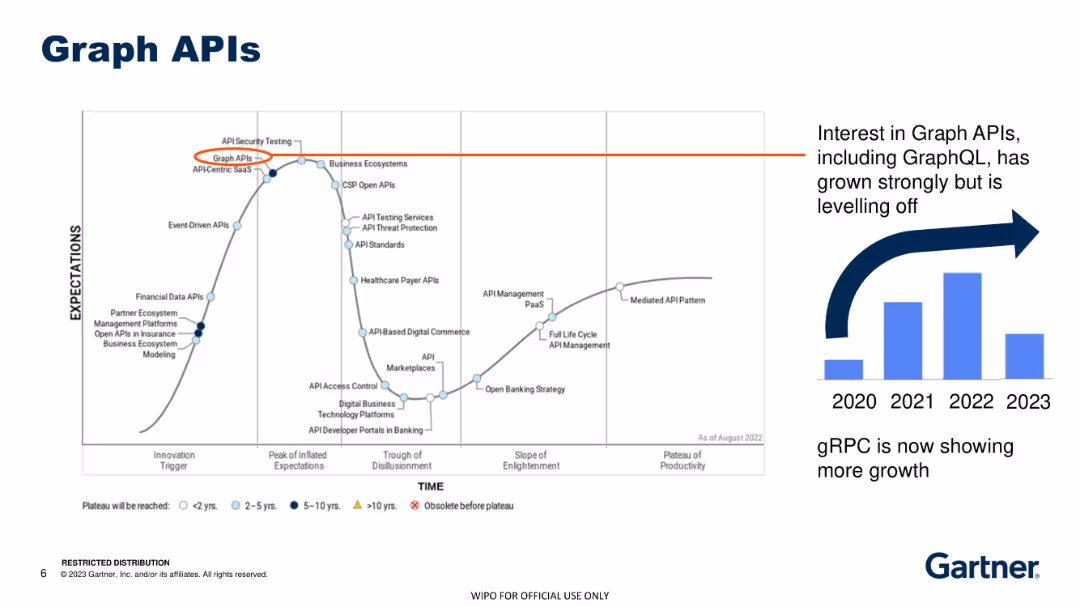
Line graph illustrating the adoption trends for Graph APIs, highlighting steady growth until 2023, with a secondary graph comparing the rise of gRPC.
Technology and Digital Transformation
Technology & Software
The slide examines the interest in Graph APIs and their adoption trends over recent years, noting the shift towards gRPC as the newer growth trend.
Graph APIs, gRPC, adoption trends, technology
Multiple Chart
Gartner
Saved
Column charts displaying US bailouts in billions, spanning from 1970 to 2020, highlighted with red and black bars, labeled for each major event or bailout.
Risk Assessment and Management
Financial Services
Discusses the trend of privatizing profits and nationalizing losses through U.S. corporate bailouts. It emphasizes the need for corporate resilience. Useful in discussions on corporate governance and financial risk management.
bailouts, corporate governance, risk management, resilience, privatization, financial crisis, US
Multiple Chart
Bain
Saved
The slide features a title, two column charts for GDP projections, and a combined line and column chart for inflation and interest rates.
Financial Performance
Financial Services
This slide presents forecasts for UK's GDP growth and inflation rates, alongside historical Bank of England interest rates, useful for financial analysis.
UK, GDP, inflation, forecast, Bank of England, interest rate, economic, analysis, projections
Multiple Chart
McKinsey
Saved
A multi-stacked column chart displays deal values across sectors from 2017 to H1 2021. It’s a complex visual with varied colors for each sector, requiring more focus to interpret the layered information.
Market Analysis and Trends
Financial Services
Provides a detailed breakdown of deal values within sectors such as e-commerce, transport & food, and digital financial services over multiple years, pinpointing the sustained focus and prominence of e-commerce and financial services deals.
Deal Values, Sectors, E-commerce, Financial Services
Single Chart
Bain
Saved
Previous
Next
If nothing, comes up, please save your slides first
Create a FREE account to continue browsing
Receive Instant Access to 7,500+ of the internet's best slides
First Name
Last Name
Email
Password
I agree to all
Terms & Privacy Policy
Thank you! Your submission has been received!
Oops! Something went wrong while submitting the form.
Have an account?
Sign in
Column Chart
Heatmap
Chevron
Org Chart
Infographic
Callouts
Timeline
List
Graphic
Picture
Process Flow
Diagram
Paragraph
Map
Table
Framework
Subtitle
Takeaway Box
Icon
Other Chart
Radar Chart
Waterfall Chart
Mekko Chart
Pie Chart
Scatter Plot
Line Chart
Bar chart
Bullet points