My Account
My Slides
Search by Category
Leave Feedback
Login
Logout
Get Started
Browse all Slides
Browse Slides (Pro)
Create a FREE Account
Instant access to 1,000+ real slides from top companies like McKinsey, BCG, Goldman Sachs, Google and many more!
First Name
Last Name
Email
Password
I agree to all
Terms & Privacy Policy
Thank you! Your submission has been received!
Oops! Something went wrong while submitting the form.
Have an account?
Sign in
Saved Slides
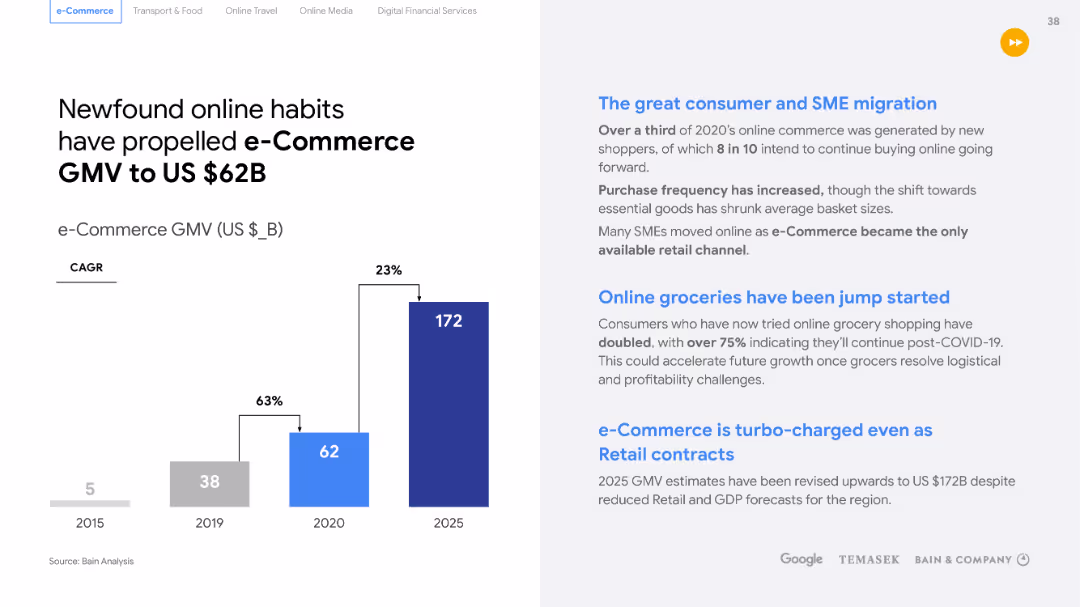
Contains a large title, two sections of text, and a column chart with projected growth figures. The layout is simple with clear separation between text and graphics.
Market Analysis and Trends
Retail & E-commerce
Highlights the surge in e-commerce GMV to $62B and explores factors like consumer and SME migration, online grocery shopping, and the diversification of e-commerce. Useful for analyzing e-commerce trends.
e-Commerce, GMV, consumer trends, SME migration, online grocery, diversification
Mixed Chart
Bain
Saved
Pie chart representing percentage of internet-using buyers, with side bar graphs detailing the triggers for offline and online buyers.
Market Analysis and Trends
Hospitality & Tourism
Comparison between offline and online buyers for hotels, emphasizing trust and payment reasons for offline purchases and multiple options online.
Hotels, Trust, Payment, Offline Buying, Online Options, Market Trends
Mixed Chart
BCG
Saved
Pie charts breakdown of Unilever's 2021 turnover by product category. Pie charts showing market distribution and user base. Vibrant blue and red colors.
Industry Overview
Consumer Goods
Summary of Unilever’s global reach and turnover in 2021, highlighting its market distribution between developed and emerging markets and its extensive user base.
Global Reach, Turnover, Market Distribution, Developed Markets, Emerging Markets
Multiple Chart
Deutsche Bank
Saved
This slide contains a mix of text and percentage graphics to discuss the importance of building trust in Generative AI. The layout is structured with clear sections and supportive color elements for visual appeal.
Technology and Digital Transformation
Technology & Software
It addresses the barriers to Generative AI adoption related to trust, emphasizing the need for transparency, explainability, and worker trust, along with key statistics on organizational trust levels and risk management.
trust, Generative AI, adoption, barriers, transparency
Multiple Chart
Deloitte
Saved
Includes multiple column charts comparing top challenges faced by underwriters in different lines of business, with focus on systems inefficiencies and training needs.
Risk Assessment and Management
Financial Services
Comparative analysis of top operational and risk management challenges across different insurance lines, emphasizing inefficiencies and the need for better training.
challenges, operational risks, insurance, comparison, systems inefficiency, training, personal lines, commercial lines, specialty lines
Mixed Chart
Accenture
Saved
Slide includes column charts showing GDP growth by quarter and future projections compared to the rest of the world. The visual elements are organized neatly, using green and purple to differentiate between past performance and future expectations, enhancing readability.
Strategic Planning
Government & Public Sector
Analyzes China's economic recovery post-COVID-19 and its projected impact on global GDP growth, focusing on sector-specific growth and future contributions to the world economy.
economic recovery, GDP growth, China, post-COVID-19, global impact
Multiple Chart
BCG
Saved
This slide includes a series of mini line charts depicting global executive opinions on various potential outcomes of the COVID-19 impact over the next year.
Risk Assessment and Management
Healthcare & Pharmaceuticals
Provides insights into executive expectations globally on public health response effectiveness and the potential scenarios regarding virus control or resurgence.
COVID-19, executive insights, health response, scenarios, impact
Multiple Chart
McKinsey
Saved
This slide presents column chart comparing current MREL/TLAC requirements with available capital resources, highlighted with clear, distinct colors for different types of capital. Key highlights discuss regulatory implications.
Regulatory and Compliance
Financial Services
Discusses the institution's capacity to meet and exceed regulatory capital requirements, providing a detailed view on the sufficiency of loss-absorbing capacity, and strategic planning implications for financial stability.
regulatory, capital, financial, stability, planning
Mixed Chart
Deutsche Bank
Saved
The slide has multiple icons and a comparative table showing the cost increase for various products if they adopt net-zero supply chains. It uses bright colors and bold text to emphasize key statistics and public opinion data.
Market Analysis and Trends
Professional Services
The slide highlights public demand for corporations to adopt environmental considerations and the average cost increase for products with net-zero supply chains. It also shows the percentage of companies committed to reaching net-zero by 2050.
net-zero, cost increase, public demand, corporations, supply chain
Header Vertical
BCG
Saved
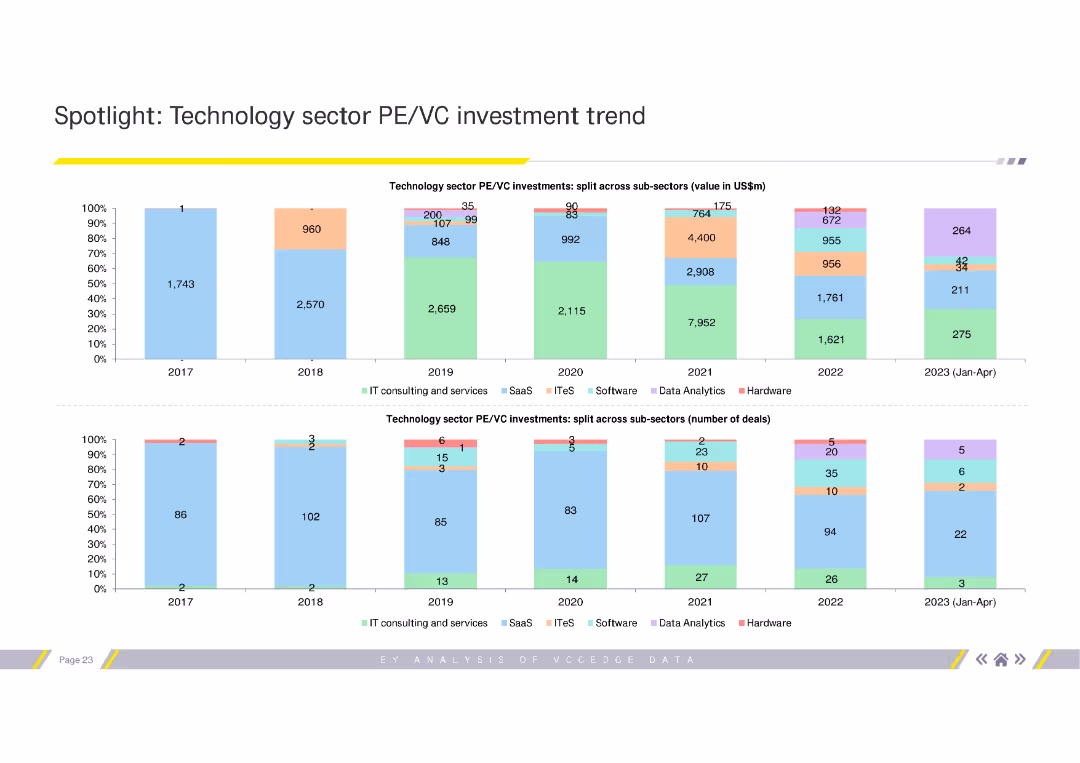
The slide features two column charts showing PE/VC investment trends in the technology sector. The first chart depicts investment values, the second shows the number of deals.
Investment Analysis
Financial Services
This slide analyzes the investment trends in the technology sector for PE/VC from 2017 to 2023. It breaks down the investments into sub-sectors like SaaS, IT consulting, etc.
PE/VC, technology, investment, trends, sub-sectors
Multiple Chart
EY
Saved
Features images of automotive interiors and circular icons describing different technologies like advanced driver assistance and cloud services. Engaging and informative layout.
Technology and Digital Transformation
Technology & Software
Showcases Clarion's advanced cockpit solutions, focusing on user interface, safety, and connectivity enhancements, positioning these solutions at the forefront of automotive innovation.
cockpit, infotainment, safety, connectivity, automotive, innovation
Linear Flow
Deutsche Bank
Saved
The slide features several bar charts comparing leaders and others in value generation across dimensions like cost, resilience, ESG, and growth.
Operational Efficiency
Financial Services
It highlights how leaders generate value through cost reduction, resilience, ESG, and growth. It is used for showing value dimensions and their impact.
Value generation, cost reduction, resilience, ESG, growth, procurement, financial impact
Mixed Chart
Kearney
Saved
The slide presents brand awareness and NPS (Net Promoter Score) data for continuous lighting brands, using a combination of bar charts and text.
Customer and Market Segmentation
Consumer Goods
It evaluates the awareness and perception of continuous lighting brands like Hive, Rotolight, Light & Motion, Nanlite, and Westcott, along with participant comments.
Brand awareness, NPS, continuous lighting, Westcott, Rotolight, Hive, perception, consumer goods, market segmentation, analysis
Mixed Chart
EY
Saved
Contains a dual-column chart labeled 'Multifamily New Construction', comparing apartments and condos. The chart is annotated with a note on data source and anticipated completion dates.
Market Analysis and Trends
Real Estate & Construction
Highlights the forecasted volume of multifamily units to be completed, valuable for market forecasting and investment decisions in real estate.
New Construction, Forecast, Apartments, Condos, Real Estate Market, Investment Decisions, Volume Analysis, Market Forecasting
Single Chart
Citigroup
Saved
Slide with a pie chart detailing the breakdown of tax revenue sources such as income, customs, and excise taxes. No property taxes are shown, indicating a specific fiscal focus.
Financial Performance
Government & Public Sector
Analyzes Namibia's tax revenue composition for 2018/19, showing major contributions from income taxes and customs. The slide aids in understanding the emphasis on indirect taxation and customs duties in the country's revenue structure.
Taxes, Income, Customs, Indirect, Revenue
Single Chart
PwC/Strategy&
Saved
The slide presents a timeline with goals for emission reductions across various scopes and a graphical representation of the company's influence on these scopes.
Strategic Planning
Environmental Services & Sustainability
Michelin's slide shows their 2030 environmental ambition to reach net-zero emissions by 2050, including specific targets for CO2 reduction and improvements in energy efficiency.
Environmental Ambition, Net-Zero Emissions, Michelin, CO2 Reduction, Energy Efficiency, Sustainability Goals, 2030 Targets, 2050 Vision, Corporate Responsibility
Table
Morgan Stanley
Saved
The slide shows a map of Japan with regions color-coded to indicate population change by 2050. Colors range from blue (0-10) to red (101+), providing a visual representation of demographic shifts over time.
Market Analysis and Trends
Government & Public Sector
The slide projects population changes in Japan towards 2050, showing areas of growth and decline. This is useful for urban planning and resource allocation in public sector projects.
Population change, 2050, Japan, demographic shifts, map
Graphic
Deloitte
Saved
The slide displays multiple product images under the brand "The Vegetarian Butcher," with accompanying text boxes and a pie chart detailing market segments.
Product and Service Analysis
Consumer Goods
Focuses on the growth and expansion of The Vegetarian Butcher, detailing product offerings and market integration strategies post-acquisition.
plant-based, growth, product expansion, market strategy, acquisition
Mixed Chart
Deutsche Bank
Saved
A comparative slide with six pie charts representing different geographical regions and industries. Each pie chart shows the distribution of Champions, Leaders, Strivers, and Traditionalists.
Market Analysis and Trends
Professional Services
This slide presents the distribution of service player categories across different geographical regions and industries, highlighting the diversity in service management maturity.
geography, industry, Champions, Leaders, Strivers, Traditionalists
Multiple Chart
Accenture
Saved
This slide shows column charts depicting the development of cost/income ratio (CIR) over fiscal years, with achievements listed on the right side.
Operational Efficiency
Financial Services
Analyzes the significant reduction in cost/income ratio over time, detailing operational efficiencies and management strategies that contributed to the reduction.
cost/income ratio, CIR, operational efficiency, cost reduction, management strategies
Mixed Chart
Deutsche Bank
Saved
A flow diagram illustrating inefficiencies in linear value chains and potential interventions. Contains icons and labeled stages from product design to end-of-life disposal.
Strategic Planning
Environmental Services & Sustainability
This slide explains the concept of the circular economy by identifying key inefficiencies in traditional linear business models and suggesting strategic interventions to mitigate these inefficiencies, thereby creating business value through sustainability practices.
circular economy, sustainability, business strategy, value chain, inefficiencies
Linear Flow
Accenture
Saved
It has a four-part grid layout each with its icon and text, combination of column and line charts discussing opportunities and leveraging strategies within various aspects of the industry.
Strategic Planning
Financial Services
Identifies organic growth opportunities in investment banking across regions, products, clients, and sectors, outlining areas for potential expansion and the current #1 rankings to maintain and strengthen.
Growth, Strategy, Investment Banking, Clients
Multiple Chart
JP Morgan
Saved
The slide combines column charts and text to depict the types of family law final orders and the time taken to finalize them in two courts. Colors are used to differentiate the data, and annotations highlight specific insights.
Operational Efficiency
Government & Public Sector
It presents data on the resolution of family law cases, including settlement frequencies and duration before finalization, aiding in understanding court efficiencies and decision-making times.
family law, finalisation, settlements, courts, resolution time
Multiple Chart
PwC/Strategy&
Saved
This advanced slide contains two vertical stacked column charts representing changes in loan mix and noninterest income from 2012 to the present. It uses shades of blue, green, and other colors to differentiate between segments. Textual content is provided on the right to give context to the graphs, and bullet points below the graphs highlight key takeaways.
Strategic Planning
Financial Services
The slide outlines the strategic diversification of the company’s balance sheet and fee revenue to perform well in different economic environments. It presents changes in loan mix and noninterest income, emphasizing the reduction of cyclical impacts and improving fee diversification. Intended for strategic financial planning.
Balance Sheet, Diversification, Loan Mix, Revenue, Strategic Planning, Noninterest Income, Fee Diversification, Economic Performance
Multiple Chart
Morgan Stanley
Saved
This slide features a comparative chart with ratings from Moody's, S&P, and Fitch for various financial institutions. Symbols indicate rating levels and outlooks.
Competitive Landscape
Financial Services
It compares credit ratings for UBS and its peers, providing a visual representation of ratings across different agencies as of September 2023.
credit ratings, peer comparison, Moody's, S&P, Fitch, UBS, financial, operating company, September 2023
Table
UBS
Saved
Previous
Next
If nothing, comes up, please save your slides first
Create a FREE account to continue browsing
Receive Instant Access to 7,500+ of the internet's best slides
First Name
Last Name
Email
Password
I agree to all
Terms & Privacy Policy
Thank you! Your submission has been received!
Oops! Something went wrong while submitting the form.
Have an account?
Sign in
Column Chart
Heatmap
Chevron
Org Chart
Infographic
Callouts
Timeline
List
Graphic
Picture
Process Flow
Diagram
Paragraph
Map
Table
Framework
Subtitle
Takeaway Box
Icon
Other Chart
Radar Chart
Waterfall Chart
Mekko Chart
Pie Chart
Scatter Plot
Line Chart
Bar chart
Bullet points