My Account
My Slides
Search by Category
Leave Feedback
Login
Logout
Get Started
Browse all Slides
Browse Slides (Pro)
Create a FREE Account
Instant access to 1,000+ real slides from top companies like McKinsey, BCG, Goldman Sachs, Google and many more!
First Name
Last Name
Email
Password
I agree to all
Terms & Privacy Policy
Thank you! Your submission has been received!
Oops! Something went wrong while submitting the form.
Have an account?
Sign in
Saved Slides
This slide features a column chart showing global fintech revenue growth from 2017 to 2024, segmented by region (Americas, EMEA, APAC), with green, yellow, and blue colors.
Market Analysis and Trends
Financial Services
Discusses the global fintech market size and growth projections, highlighting the dominance of the APAC and Americas regions and the impact of COVID-19 on fintech growth opportunities.
Fintech, market share, APAC, Americas, EMEA, growth, COVID-19, projections, digital payments, innovation
Mixed Chart
Deloitte
Saved
The slide uses a combination of text and icons in a multi-column layout. It features four main areas with icons representing prevent, detect, respond, and recover, with supporting text in each section. There is also a sidebar discussing the importance of cybersecurity.
Risk Assessment and Management
Technology & Software
The slide emphasizes the importance of integrating cybersecurity into business strategy by focusing on prevention, detection, response, and recovery. It highlights the steps companies should take to bolster their cybersecurity programs, mentioning specific actions and benefits.
cybersecurity, prevention, detection, response, recover
Linear Flow
BCG
Saved
The slide features a pie chart showing the assessment of digital maturity levels among companies. It also includes a bar chart comparing the preferred partners for innovation in 2020 and 2022. Text explanations are provided at the bottom.
Technology and Digital Transformation
Technology & Software
This slide evaluates digital maturity levels within companies and compares preferred innovation partners over two years. It highlights the strategic importance of digital maturity and the shift towards partnerships with start-ups and incubators.
digital maturity, innovation partners, assessment, comparison, technology strategy
Multiple Chart
Deloitte
Saved
Utilizes icons and brief points to propose strategies like ecosystem development and scaling for market leadership.
Strategic Planning
Retail & E-commerce
Suggests actionable strategies for businesses to dominate in competitive markets, focusing on digital and network growth.
market strategies, digital growth, ecosystem, scaling
Pillar
BCG
Saved
The slide features a column chart comparing group underlying revenues/RWA for UBS FY22, CS FY22, 2H23 annualized post-merger, and projected 2026 exit rate. Text on the left lists actions: >6bn capital release by 2026, reduction of low-return exposures, alignment of return hurdle frameworks, and optimization of models and hedging activities.
Financial Performance
Financial Services
The slide outlines strategies to optimize financial resources for sustainable growth and higher returns. It includes actions for capital release, reduction of low-return exposures, and optimization of financial models. This slide is suitable for discussing financial strategy and performance improvement with stakeholders.
optimization, financial resources, sustainable growth, returns, capital
Mixed Chart
UBS
Saved
The slide features a pie chart with three sections: 51% no impact, 37% more likely, and 13% less likely.
Market Analysis and Trends
Real Estate & Construction
This slide illustrates the impact of the COVID-19 pandemic on the likelihood of listing investment properties, showing how investors' plans have changed.
COVID-19, property listing, investment, pandemic impact, pie chart, investor behavior
Single Chart
IPSOS
Saved
This slide includes comparative data in blue bar charts and two columns with demographics and geographical segmentation. It provides a contrast in online spending between HVUs and non-HVUs in Vietnam. Source includes Bain analysis.
Market Analysis and Trends
Technology & Software
The slide compares online spending habits of high-value users (HVUs) to non-HVUs in Vietnam, useful for understanding consumer segmentation and targeting strategies in the digital economy.
Vietnam, High-Value Users, Consumer Spending, Digital Economy, Online Spend, Demographic Analysis, Geographic Segmentation, Market Research, Spending Habits
Multiple Chart
Bain
Saved
The slide features a column chart comparing world biofuel demand by fuel type (solid biofuels, liquid biofuels, CHP from waste, biogases) for 2017. It highlights the dominance of traditional biofuels and the distribution of advanced biofuels.
Market Analysis and Trends
Energy & Utilities
This slide provides an overview of world biofuel demand by different fuel types, emphasizing the overwhelming dominance of traditional biofuels and the distribution of advanced biofuels across various categories.
world biofuel demand, fuel type, traditional biofuels, advanced biofuels, 2017, solid biofuels, liquid biofuels, CHP from waste, biogases
Single Chart
Kearney
Saved
The slide has two column charts showing risk-weighted asset progression and leverage exposure progression, with accompanying text detailing expected reductions by 2025.
Strategic Planning
Financial Services
This slide details the strategy and expected outcomes of winding down the non-core unit, highlighting reductions in risk-weighted assets and leverage exposure over a timeline.
risk reduction, strategic planning, asset progression, financial management, cost reduction
Multiple Chart
Credit Suisse
Saved
The slide includes a column chart showing cost ranges for different stages of CO2 capture and storage.
Financial Performance
Energy & Utilities
This slide presents the cost breakdown for capture, compression, dehydration, transport, storage, and monitoring of CO2.
CO2 capture, costs, compression, storage, monitoring
Mixed Chart
Kearney
Saved
Slide includes a set of stacked horizontal bars showing the percentage of leaders and overall respondents' views on digital trends like voice commerce and cryptocurrencies.
Market Analysis and Trends
Retail & E-commerce
This slide assesses leaders' optimism regarding future digital market trends, particularly in voice commerce and digital goods versus cryptocurrencies.
digital goods, voice commerce, cryptocurrency, leaders, trends, market analysis, digital market, optimism
Single Chart
Deloitte
Saved
Pie charts depicting market size and Morgan Stanley's share in various financial service categories. Utilizes blue shades and annotations.
Competitive Landscape
Financial Services
Examines Morgan Stanley's market share in different financial service sectors, identifying opportunities to deepen market penetration.
Market share, financial services, Morgan Stanley, client reach, industry sectors, market penetration, opportunity
Multiple Chart
Goldman Sachs
Saved
This slide includes multiple column charts comparing valuation multiples pre- and post-spin, and P/E multiple differentials of S&P 500 reporting segments. It uses color coding and arrows for emphasis.
Strategic Planning
Financial Services
The slide discusses the benefits of creating pure play entities for shareholders, showing how these strategies impact valuation multiples and market transparency.
pure play, valuation multiples, strategy
Multiple Chart
JP Morgan
Saved
This slide contains text and multiple icons with a central photo of a surveyor. It highlights infrastructure projects in the Philippines under the "Build, Build, Build" program.
Market Analysis and Trends
Real Estate & Construction
Discusses the Philippines' infrastructure development, including major projects like the Metro Manila Subway and improvements across various regions.
infrastructure, Philippines, development, projects, construction
Graphic
Deloitte
Saved
The slide features a scatter plot showing the correlation of various equity markets and yields over the last 12 months. Different symbols and colors represent different sectors, such as higher yielding sectors and stronger correlation to equities.
Market Analysis and Trends
Financial Services
This slide analyzes the correlations between equity markets and their yields over the past year, showing the relationship between yield levels and market performance across various sectors and geographical regions.
Equity Markets, Correlations, Yields, Sectors, Performance
Single Chart
JP Morgan
Saved
Table format presenting various sub-models of circular business strategies, including descriptions and potential benefits.
Product and Service Analysis
Environmental Services & Sustainability
Offers a detailed view of sub-models within the circular business model framework, describing how each can be implemented to enhance sustainability and efficiency. The slide serves as a guide for businesses looking to adopt more sustainable practices by choosing appropriate sub-models based on their operational needs.
circular economy, business strategies, sustainability, sub-models, analysis
Table
Accenture
Saved
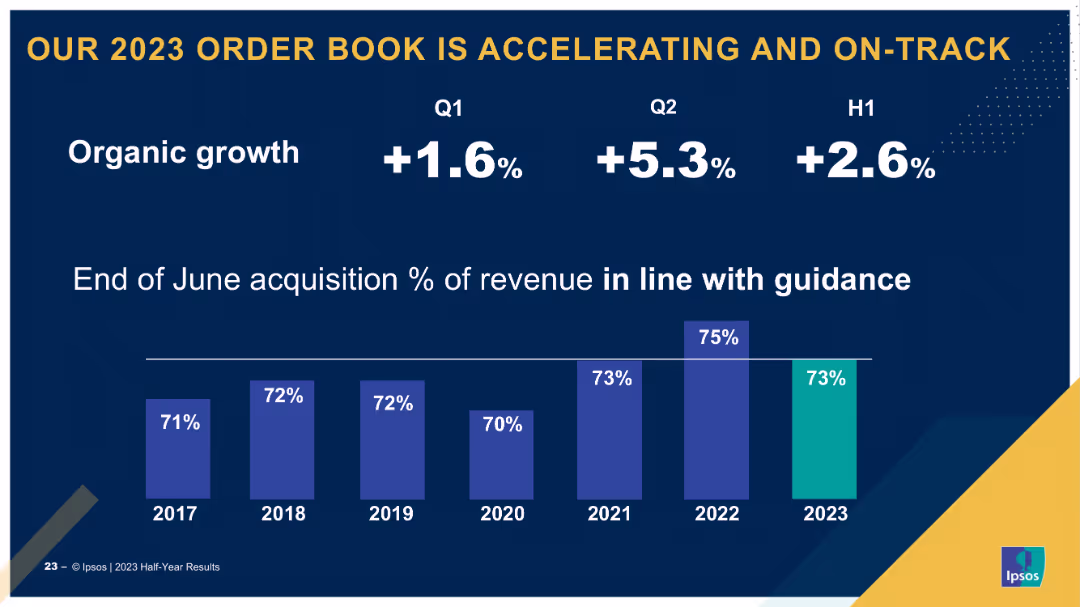
Single-column layout with a bar chart showing quarterly and half-year organic growth rates. Uses callouts for specific growth percentages and year comparisons.
Market Analysis and Trends
Financial Services
Highlights the acceleration of the order book in 2023, showing organic growth percentages for Q1, Q2, and H1, and acquisition revenue percentages compared to previous years.
order book, growth, 2023, Q1, Q2, H1
Single Chart
IPSOS
Saved
Slide features a column chart showing the growth in wholesale payments revenue from 2016 to 2018, and lists the key services included in this sector.
Financial Performance
Financial Services
Highlights the significant revenue growth in JP Morgan's Wholesale Payments sector, emphasizing its scale and service diversity.
wholesale payments, revenue growth, financial services
Mixed Chart
JP Morgan
Saved
Timeline showing the phases of Germany's hydrogen strategy from 2020-2050 with key targets for electrolysis capacity and infrastructure development.
Strategic Planning
Energy & Utilities
This slide covers the timeline and phases of Germany’s evolving hydrogen strategy, focusing on increasing production and infrastructure expansion.
Germany, hydrogen, strategy, timeline, 2020-2050, production, infrastructure
Mixed Chart
McKinsey
Saved
The slide presents a bar graph with contrasting colors on a black background, displaying CEO opinions on AI and job displacement.
Risk Assessment and Management
Technology & Software
Discusses CEO views on whether AI will displace more jobs than it creates, offering a global perspective on the workforce impact.
AI, job displacement, CEO survey, workforce impact, global perspective, technology trends, employment, future risks, market analysis
Mixed Chart
PwC/Strategy&
Saved
Dense layout with column chart and icons detailing corporate sustainability efforts and partnerships across the SEA region.
Strategic Planning
Government & Public Sector
Outlines the roles of businesses in SEA in advancing sustainability, including commitments, partnerships, and innovations.
SEA, sustainability, business leadership, corporate initiatives
Mixed Chart
Bain
Saved
Includes a pie chart displaying ownership structure post-transaction and a series of bullet points explaining transaction details.
Mergers and Acquisitions
Financial Services
Explains the merger between CDEV and Colgate, outlining the ownership distribution and transaction terms, focusing on shareholder approval and financial considerations.
mergers, acquisitions, ownership structure, shareholder approval, transaction details, equity
Mixed Chart
Barclays
Saved
The slide includes various charts and graphs depicting changes in workplace dynamics, such as remote work percentages and engagement metrics.
Organizational Structure and Change
Professional Services
It discusses changes in the strategic procurement team's working environment, engagement, retention, diversity, and gender balance.
Workplace dynamics, remote work, engagement, retention, diversity, gender balance, procurement
Multiple Chart
Kearney
Saved
The slide is composed of a central text section flanked by two horizontal sections with icons and brief text. The upper section has three groups of three icons, each depicting macro-environment, market forces, and competitive landscape factors. The lower section has three columns listing strategic actions underlined by colored segments saying 'GLOBAL', 'COMPLETE', 'DIVERSIFIED'.
Strategic Planning
Financial Services
This slide outlines a strategic approach focusing on maintaining discipline, optimizing the current model, and transforming for the future, with the aim of maintaining leadership in a competitive landscape through efficient financial management and technology investment. The slide is likely used for executive presentations or investor briefings.
resilience, optimization, leadership, strategy, financial management
Linear Flow
JP Morgan
Saved
The slide features a diagram and detailed table presenting the total potential of agricultural residues for energy production by 2060, including theoretical, technical, and sustainable potentials, and various factors affecting its scalability and sustainability constraints.
Technology and Digital Transformation
Energy & Utilities
This slide provides a deep-dive into the potential of agricultural residues as a feedstock for energy production, analyzing its total potential by 2060 and highlighting the scalability issues and sustainability constraints associated with its use.
agricultural residues, feedstock, total potential, energy production, 2060, scalability, sustainability constraints
Mixed Chart
Kearney
Saved
Previous
Next
If nothing, comes up, please save your slides first
Create a FREE account to continue browsing
Receive Instant Access to 7,500+ of the internet's best slides
First Name
Last Name
Email
Password
I agree to all
Terms & Privacy Policy
Thank you! Your submission has been received!
Oops! Something went wrong while submitting the form.
Have an account?
Sign in
Column Chart
Heatmap
Chevron
Org Chart
Infographic
Callouts
Timeline
List
Graphic
Picture
Process Flow
Diagram
Paragraph
Map
Table
Framework
Subtitle
Takeaway Box
Icon
Other Chart
Radar Chart
Waterfall Chart
Mekko Chart
Pie Chart
Scatter Plot
Line Chart
Bar chart
Bullet points