My Account
My Slides
Search by Category
Templates
Leave Feedback
Login
Logout
Get Started
Browse all Slides
Browse Slides (Pro)
Create a FREE Account
Instant access to 1,000+ real slides from top companies like McKinsey, BCG, Goldman Sachs, Google and many more!
First Name
Last Name
Email
Password
I agree to all
Terms & Privacy Policy
Thank you! Your submission has been received!
Oops! Something went wrong while submitting the form.
Have an account?
Sign in
Saved Slides
The slide contains a line chart showing grid slot utilization and key metrics such as -50% reduction in printing volume and -27% in storage costs, highlighting regional variability.
Operational Efficiency
Financial Services
This slide outlines strategies to optimize maintenance spending by increasing cost variability and leveraging managed services, showing significant cost reductions.
cost optimization, maintenance, grid computing, managed services, cost reduction, variability, new technology, strategic partnerships
Mixed Chart
Credit Suisse
Saved
The slide displays a large pie chart in the center with colored segments indicating the cost breakdown of raw materials like natural rubber, synthetic rubber, chemicals, and more. To the right, there are three images that presumably relate to the materials: tapped rubber tree, a pile of rubber, and workers in protective gear.
Financial Performance
Industrial & Manufacturing
This slide presents a breakdown of raw material costs for H1 2023, totaling €3.2BN. The chart shows the percentage share of each material, such as natural rubber, synthetic rubber, steel cord, and others. It is likely used for a financial overview or cost analysis within the automotive or manufacturing industry.
raw materials, cost breakdown, pie chart, H1 2023, automotive industry
Single Chart
Morgan Stanley
Saved
Contains a brief history timeline of nbn, a large text block describing the nbn's purpose, and a note on the report's scope.
Regulatory and Compliance
Telecommunications
Provides an overview of the nbn network, detailing its purpose, historical milestones, and the role it plays in enhancing broadband access.
nbn, Australia, broadband, history, technology, regulation, telecommunications, government
Header Vertical
Accenture
Saved
This slide contains bar charts showing percentage increases in productivity, confidence, meaningful impact, and stress management among sales professionals using AI tools. Each bar is labeled with the exact percentage increase, providing a clear quantitative measure.
Strategic Planning
Technology & Software
Examines the positive changes in productivity, confidence, and stress management reported by sales professionals using AI tools.
AI, Sales, Productivity, Confidence, Impact, Stress Management, Tools, Professional Services, Technology
Mixed Chart
Accenture
Saved
This slide is divided into four areas, each listing key data points and small pie charts related to Seadrill's joint ventures and investment holdings. The charts are simple and color-coded, matching the text for clarity. Key financial figures are highlighted, and additional notes at the bottom provide context for the data presented. The design is clean and professional, with effective use of space and clear visual separation of different sections.
Investment Analysis
Energy & Utilities
This slide details Seadrill's various joint ventures and investment holdings, showcasing key financial data like market cap, debt, and cash positions. It emphasizes the company's strategic partnerships and financial health. This could be used in presentations to potential investors or company stakeholders, helping them understand Seadrill's financial stakes and operational breadth in different ventures, enhancing transparency and providing a basis for financial decision-making.
joint ventures, investments, financials, Seadrill, market cap, debt, partnerships, pie charts, cash positions, transparency
Table
Barclays
Saved
The slide features a prominent table showing the relationship between different economic sectors and a header explaining the table's purpose.
Financial Performance
Industrial & Manufacturing
Illustrates how an Input-Output table can be used to understand sector requirements for producing output in an economy.
Input-Output table, economic sectors, agriculture, manufacturing, financial services, output, data analysis
Table
PwC/Strategy&
Saved
This slide contains column charts of tax-equivalent yields for various bonds and a second chart for the 5-year correlation with municipal bonds, highlighting investment attractiveness.
Investment Analysis
Financial Services
The slide provides a tax-equivalent yield analysis for various bonds and their correlation, offering insights for tax planning and investment attractiveness in municipal bonds.
tax-equivalent yield, bonds, investment analysis, tax planning, 5-year correlation, municipal bonds, finance
Multiple Chart
Morgan Stanley
Saved
Multiple column charts show the change in assets under management (AuM) for Wealth Management, Swiss Bank, and Asset Management from 3Q22 to 4Q22.
Market Analysis and Trends
Financial Services
Details the impact of market events on asset management, with significant net asset outflows and adverse FX impacts, contributing to an 8% decrease in AuM.
assets under management, market events, net outflows, FX impact, financial services
Multiple Chart
Credit Suisse
Saved
Consists of a series of green bars assessing different solutions' abatement potential, technology readiness, and other factors across various sectors like transport and energy, all aligned in a clear, organized manner.
Market Analysis and Trends
Environmental Services & Sustainability
Highlights available, ready-to-deploy decarbonization solutions in different sectors, emphasizing their readiness and potential impact on reducing carbon emissions. Focuses on supply chain optimization in transport and cooling efficiency in the built environment as examples.
decarbonization, solutions, sector-specific, carbon emissions
Header Horizontal
Bain
Saved
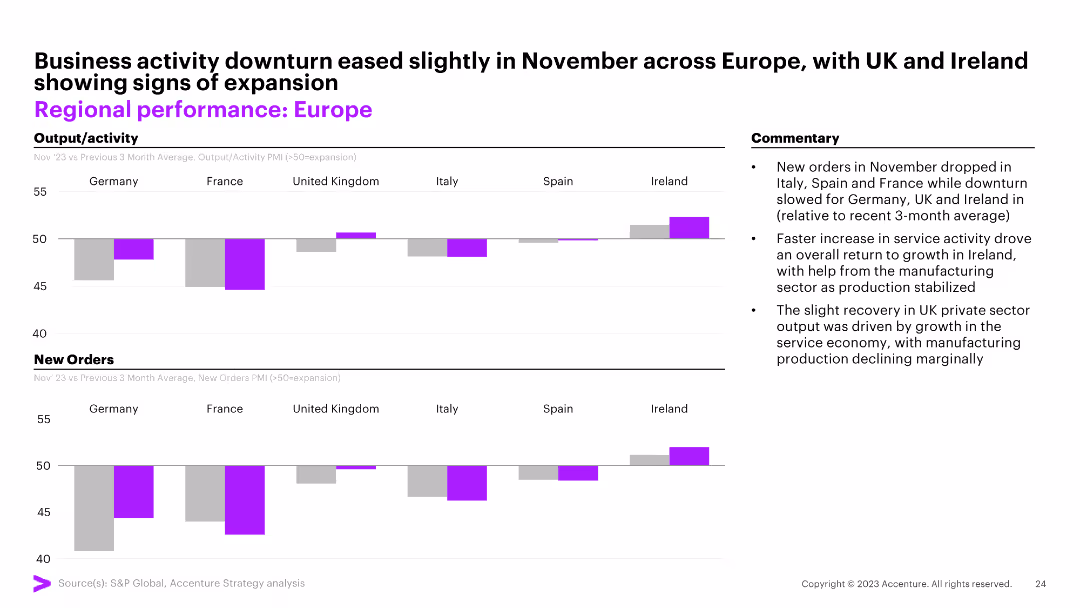
Two column charts comparing output/activity and new orders across European countries. The slide also includes commentary on business activity in November.
Market Analysis and Trends
Financial Services
This slide analyzes the performance of different European countries, comparing their output/activity and new orders, with a focus on changes observed in November.
Europe, performance, activity, orders, November
Multiple Chart
Accenture
Saved
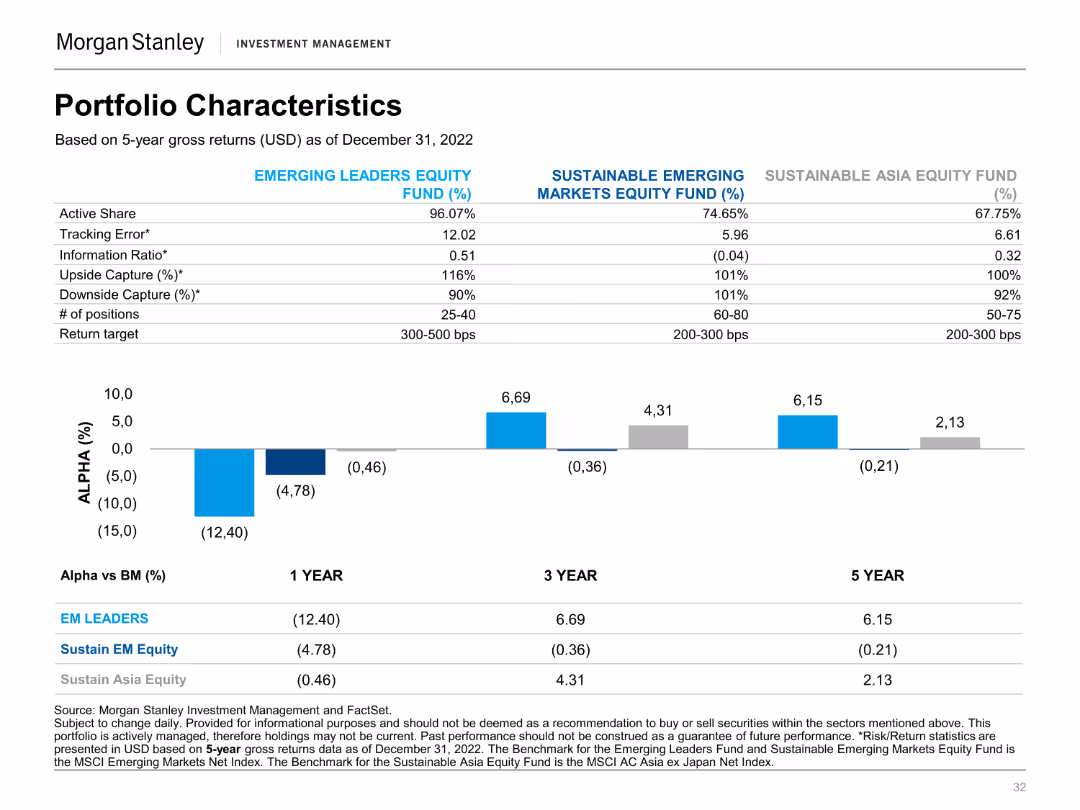
A column chart showing alpha percentages for various funds over 1, 3, and 5-year periods. It includes a table with fund characteristics and target returns.
Financial Performance
Financial Services
This slide provides a comparison of the portfolio characteristics and performance metrics of different equity funds, showing alpha values.
Alpha, Equity Funds, Performance Metrics, Portfolio, Returns, Financial, Comparison, Characteristics, Investment, Analysis
Mixed Chart
Morgan Stanley
Saved
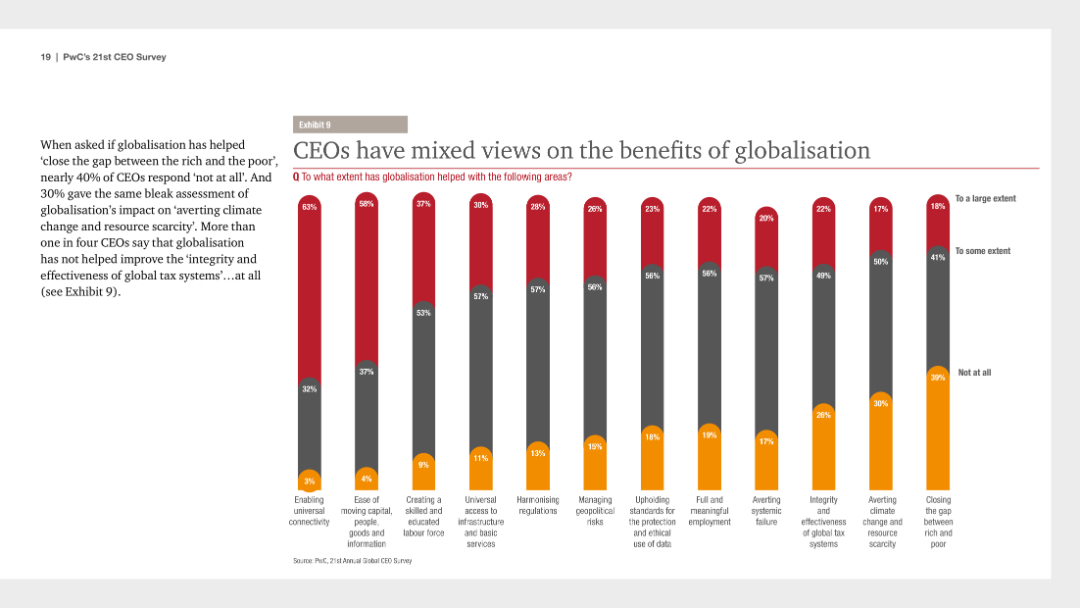
The slide features a series of column charts displaying CEOs' views on the benefits of globalization in various areas, with columns color-coded to show different extents of agreement.
Market Analysis and Trends
Financial Services
It presents mixed CEO opinions on globalization's benefits, such as enabling connectivity and managing geopolitical risks, useful for understanding diverse viewpoints on globalization impacts.
globalization, CEO views, benefits, market analysis, 2018, column charts, financial survey, PwC, CEO Survey, mixed opinions
Mixed Chart
PwC/Strategy&
Saved
List format with icons, descriptive text, and benefits. Blue and white color scheme.
Product and Service Analysis
Healthcare & Pharmaceuticals
Details recent technological advances in bioengineering and their practical applications.
Bioengineering, Technology, Advancements, Healthcare
Header Vertical
McKinsey
Saved
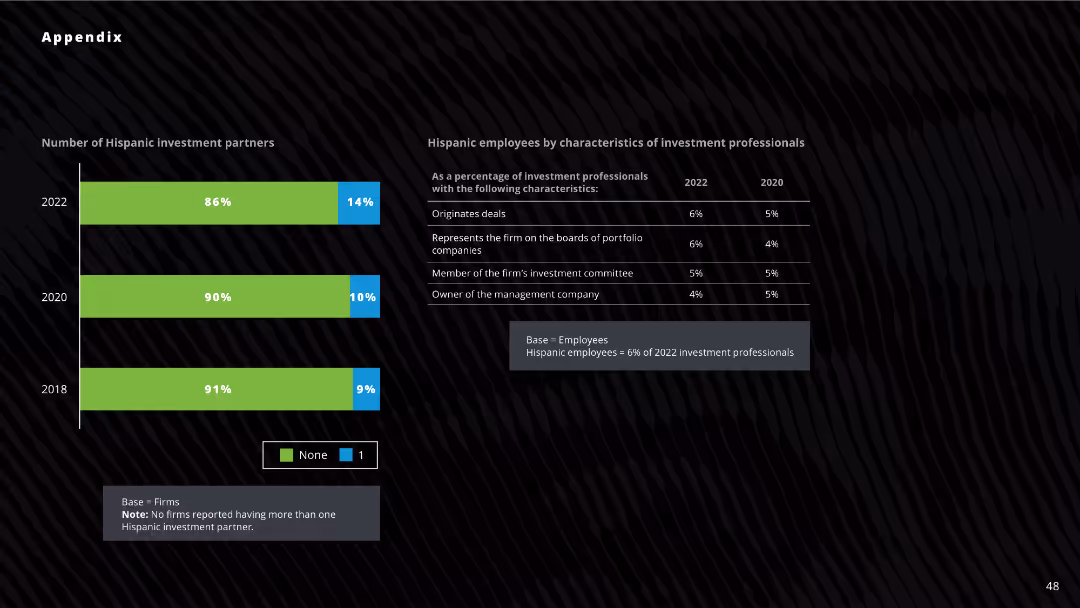
Column chart displaying the number of Hispanic investment partners across three years (2018, 2020, 2022). Data table to the right shows characteristics of Hispanic employees in investment firms.
Investment Analysis
Financial Services
The slide shows the percentage of firms with Hispanic investment partners and the roles of Hispanic employees in investment firms for 2022, 2020, and 2018. Useful for analyzing diversity in investment partnerships and roles.
Hispanic, investment, partners, diversity, analysis
Mixed Chart
Deloitte
Saved
Uses a pie chart to display the composition of a loan book across different banking divisions and sectors.
Investment Analysis
Financial Services
Presenting a comprehensive view of the loan book composition, this slide is instrumental for investors and financial analysts. It breaks down the portfolio by sectors such as residential mortgages and corporate banking, providing insights into risk diversification, loan exposure, and strategic investment opportunities within the banking industry.
Loan Portfolio, Banking, Investment Analysis, Risk Diversification, Sector Breakdown
Mixed Chart
Deutsche Bank
Saved
This matrix slide compares market outlooks across several regions and sectors, using color-coded arrows to indicate market conditions. Regions are listed vertically, while markets—housing, real estate, and infrastructure—are organized horizontally. Each cell contains an arrow representing the market condition: green for improving, orange for stable, and pink for weakening. The visual simplicity makes the data immediately accessible, while the cityscape in the background relates it to real estate and construction. The footer includes event identification.
Market Analysis and Trends
Real Estate & Construction
Provides an at-a-glance view of the Q2 market outlook across various regions, crucial for strategic decision-making in the context of housing, real estate, and infrastructure markets.
market outlook, regional analysis, housing market, real estate, infrastructure, market conditions, Q2 forecast, stability, visibility, strategic decision-making
Table
Goldman Sachs
Saved
This slide features a bar chart under "FIGURE 3" and bulleted points discussing the potential of worker time being augmented/automated by intelligent technologies.
Market Analysis and Trends
Technology & Software
The slide details which roles are most susceptible to automation and augmentation by intelligent technologies, with a focus on how worker activities evolve with these advancements.
Augmentation, Automation, Employment, Trends, AI
Mixed Chart
Accenture
Saved
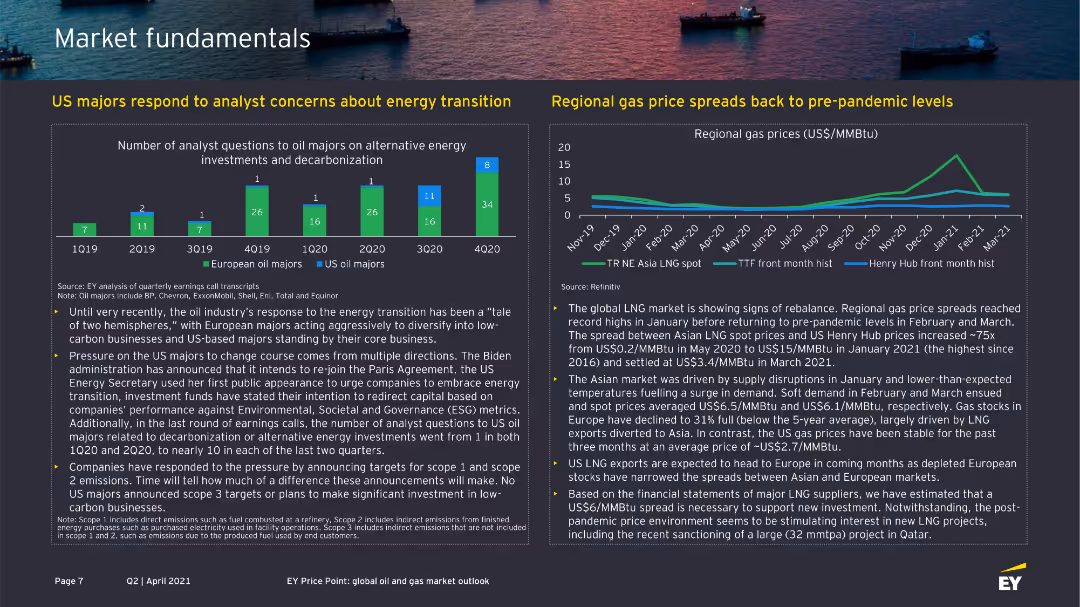
The slide contains two charts: one bar chart showing analyst questions to oil majors about energy transition, and one line chart showing regional gas price spreads.
Market Analysis and Trends
Energy & Utilities
This slide addresses concerns about energy transition and gas price trends, useful for understanding industry responses and market conditions.
energy transition, gas prices, oil majors, analyst questions, market fundamentals
Multiple Chart
EY
Saved
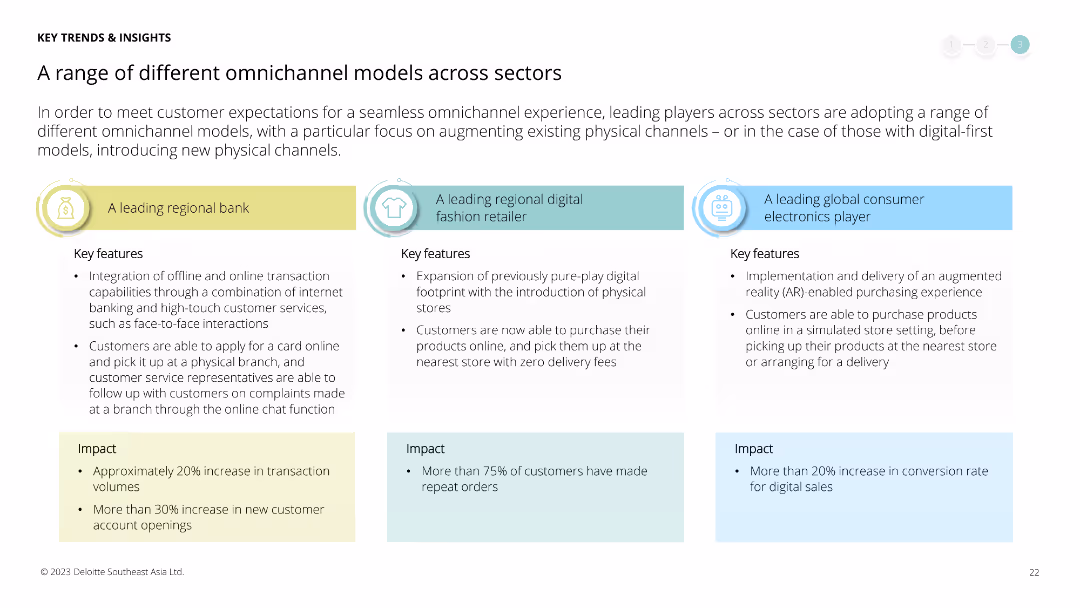
Comparative analysis of three omnichannel models used by a regional bank, a digital fashion retailer, and a global consumer electronics player. Text boxes explain key features and impacts for each.
Operational Efficiency
Retail & E-commerce
Provides case studies of omnichannel strategies across different sectors, comparing their implementation and impact on transaction volumes and customer engagement.
omnichannel, case study, retail, banking, fashion, consumer electronics, digital commerce, customer engagement, impact
Pillar
Deloitte
Saved
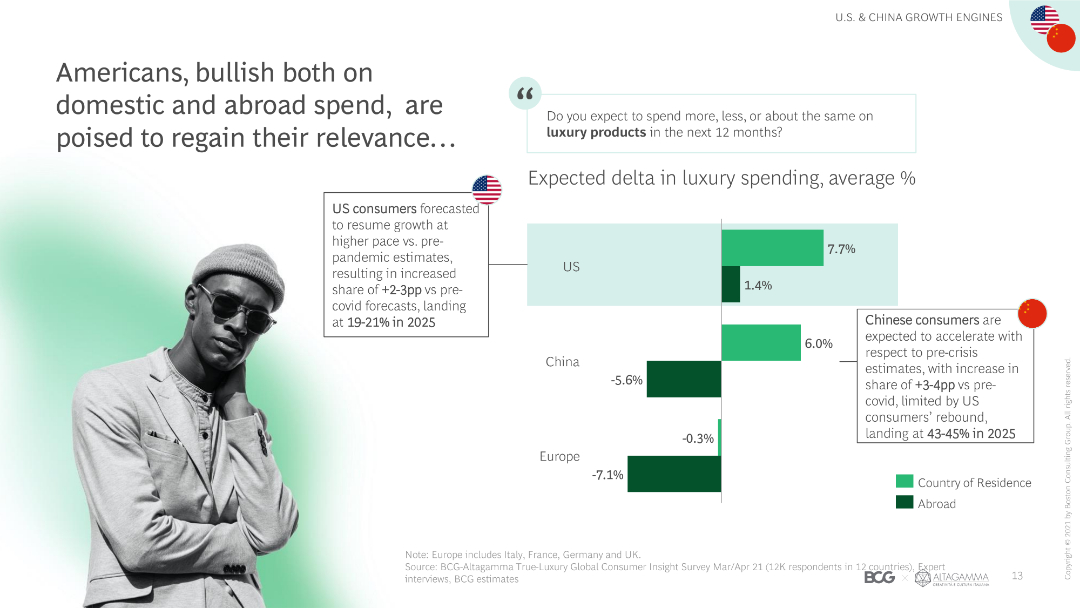
The slide features column charts showing expected changes in luxury spending by Americans domestically and abroad, with text boxes explaining the data.
Market Analysis and Trends
Retail & E-commerce
The slide discusses the optimism among American consumers regarding luxury spending both domestically and abroad, with projected growth rates and market shares.
Luxury spending, American consumers, domestic spend, abroad spend, market growth, projections, consumer optimism, spending trends, market shares
Mixed Chart
BCG
Saved
The slide contains two sections: the left section with a bar chart showing top sectors by investment value, and the right section with a column chart displaying the number of deals by sector.
Investment Analysis
Financial Services
This slide breaks down PE/VC investments by sector, highlighting the top sectors in terms of investment value and the number of deals completed.
PE/VC investments, sectors, investment value, deal count, financial analysis
Multiple Chart
EY
Saved
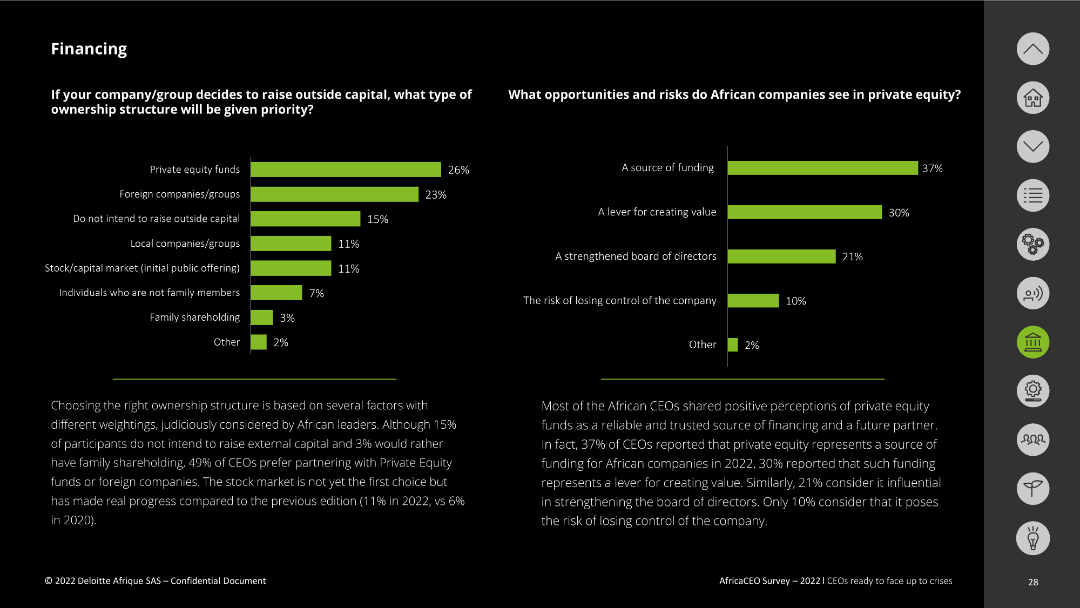
The slide contains two bar charts. The first chart displays preferred ownership structures for raising outside capital. The second chart shows the opportunities and risks associated with private equity. Text explanations are provided at the bottom.
Investment Analysis
Financial Services
This slide examines preferred ownership structures when raising outside capital and the opportunities and risks of private equity. It highlights that private equity funds and foreign companies/groups are top choices, while risks include loss of company control.
capital raising, ownership structure, private equity, opportunities, risks
Multiple Chart
Deloitte
Saved
Map of China with location clusters marked, annotations regarding consumer travel for purchases, and a textual quote.
Market Analysis and Trends
Retail & E-commerce
Discusses a geographic marketing strategy for luxury goods, emphasizing consumer movement between city tiers, valuable for targeted marketing and sales planning.
brand marketing, location strategy, consumer mobility, luxury goods, city tiers, geographic targeting, consumer quotes, market reach
Graphic
BCG
Saved
This slide includes a line chart illustrating ECB forecasts for core inflation versus actual outturns. The red line represents the forecast, while the multi-colored bars indicate different years' actual outturns. The slide includes a textual source reference.
Market Analysis and Trends
Financial Services
This slide shows the European Central Bank's core inflation forecasts in comparison to the actual figures, emphasizing the difference between projected and real outcomes. It is suitable for discussions on economic forecasting accuracy, policy decision-making, and the challenges of predicting inflation trends.
ECB, Inflation Forecasts, Economic Predictions, Core Inflation, EU, Bar Chart, Forecast Accuracy
Single Chart
JP Morgan
Saved
A bar chart showing the global market average response to the number of warmest years since 2015, with a significant majority being unsure. Accompanying text provides the actual data.
Market Analysis and Trends
Environmental Services & Sustainability
The slide reveals the widespread lack of awareness regarding the number of warmest years since 2015, contrasting survey responses with the actual data, highlighting a significant underestimation by the public.
global warming, temperature records, public awareness, World Meteorological Organization, survey response, actual data
Multiple Chart
IPSOS
Saved
Previous
Next
If nothing, comes up, please save your slides first
Create a FREE account to continue browsing
Receive Instant Access to 7,500+ of the internet's best slides
First Name
Last Name
Email
Password
I agree to all
Terms & Privacy Policy
Thank you! Your submission has been received!
Oops! Something went wrong while submitting the form.
Have an account?
Sign in
Column Chart
Heatmap
Chevron
Org Chart
Infographic
Callouts
Timeline
List
Graphic
Picture
Process Flow
Diagram
Paragraph
Map
Table
Framework
Subtitle
Takeaway Box
Icon
Other Chart
Radar Chart
Waterfall Chart
Mekko Chart
Pie Chart
Scatter Plot
Line Chart
Bar chart
Bullet points