My Account
My Slides
Search by Category
Templates
Leave Feedback
Login
Logout
Get Started
Browse all Slides
Browse Slides (Pro)
Create a FREE Account
Instant access to 1,000+ real slides from top companies like McKinsey, BCG, Goldman Sachs, Google and many more!
First Name
Last Name
Email
Password
I agree to all
Terms & Privacy Policy
Thank you! Your submission has been received!
Oops! Something went wrong while submitting the form.
Have an account?
Sign in
Saved Slides
The slide is text-heavy with a series of bullet points on the left, complemented by labeled graphs on the right. The design is minimalist with a white background and uses contrasting black and blue text for emphasis.
Risk Assessment and Management
Financial Services
Outlines potential economic scenarios resulting from COVID-19's spread, public health responses, and policy decisions. It's a tool for assessing risks and planning for various outcomes in the financial sector.
Economic Scenarios, COVID-19, Health Response
Table
McKinsey
Saved
Depicts various types of sensors and input devices required for immersive-reality technologies, accompanied by descriptive text.
Technology and Digital Transformation
Technology & Software
Details the types of technologies and inputs that will enhance immersive-reality experiences, including on-body sensors and haptics.
sensors, haptics, immersive reality, technology peripherals, input devices
Header Vertical
McKinsey
Saved
Contains bar charts and graphics explaining the future of business travel and its operational changes.
Strategic Planning
Transportation & Logistics
Discusses the evolving nature of business travel, advocating for flexibility and hybrid work models as key factors in future planning.
business travel, hybrid work, operational change, flexibility, travel management, future planning
Vertical Flow
BCG
Saved
This slide has two line charts and one column chart. The line charts display commercial mortgage spreads over Treasury for different asset classes, and the column chart shows commercial mortgage yields by sector for 1Q24.
Market Analysis and Trends
Financial Services
The slide analyzes commercial mortgage loans, focusing on spreads over Treasury and yields by sector, offering insights into the commercial real estate lending market.
mortgage loans, spreads, yields, commercial real estate, market analysis
Multiple Chart
JP Morgan
Saved
Column chart displaying Brazilian TAM for BVS's Product Offerings in three categories: Credit Bureau, Debt Renegotiation, E-Commerce Anti-fraud. Red bars, hierarchical values: $700M, $760M, $190M.
Market Analysis and Trends
Financial Services
Slide presents an estimated $2 billion addressable market for BVS's products segmented by type. Details enhancements to BVS products by EFX aiming at increased revenue and market competitiveness.
TAM, Credit Bureau, Debt Renegotiation, E-Commerce, Market Growth, Revenue Enhancement
Mixed Chart
Barclays
Saved
Similar to the previous, this Cartesian coordinate system chart displays shifts in various factors over 12 years. It uses red dots connected by dashed lines to denote changes, showing general improvements and deterioration.
Market Analysis and Trends
Professional Services
This slide provides a longitudinal study of France's business environment over 12 years, highlighting improvements in key assets and persistent challenges, particularly in social legislation.
longitudinal analysis, business environment, France, improvement, social legislation
Single Chart
Bain
Saved
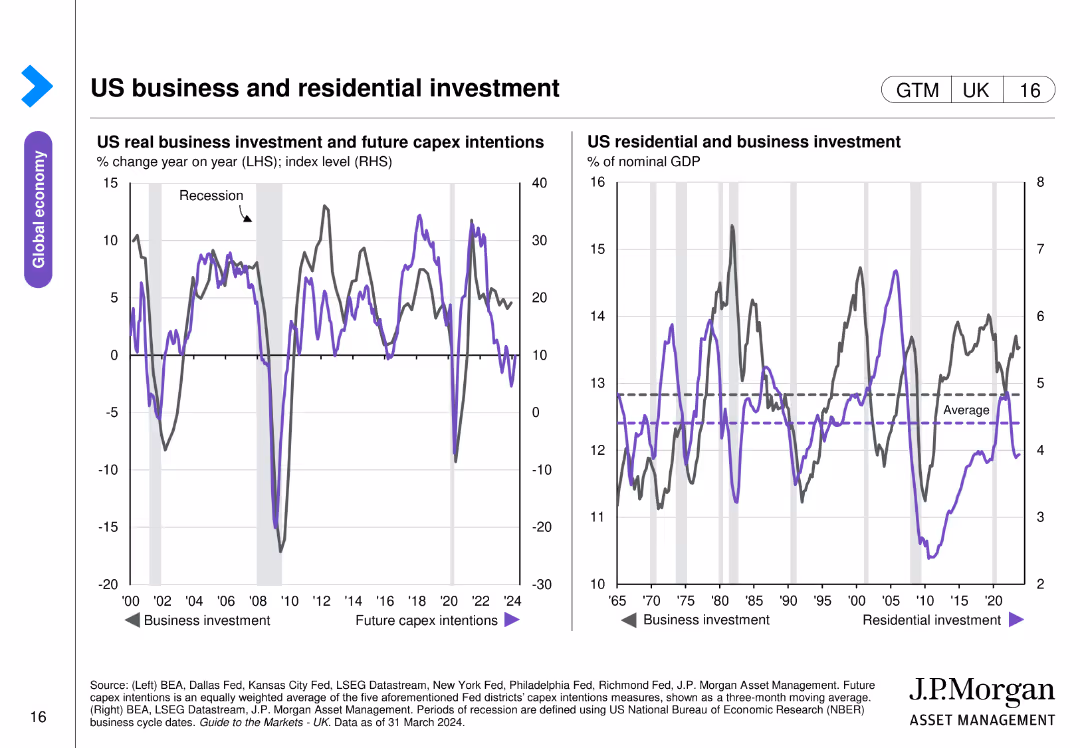
Two line charts side by side, showing trends in business investment and residential investment in the US. Uses color coding for different data series.
Market Analysis and Trends
Financial Services
Analyzes trends in US real business investment, future capex intentions, and residential investment over time, indicating periods of recession.
business, investment, residential, US, GDP
Multiple Chart
JP Morgan
Saved
The slide is divided into two sections with a large green title at the top. The left side contains a block of text outlining the key findings related to AI risks and concerns, governance issues, and active management steps. On the right, a pie chart illustrates strategies organizations are implementing to manage AI risks, with percentages. The slide background is white with a green design element on the left and the number '18' at the bottom right corner.
Risk Assessment and Management
Technology & Software
This slide details the governance and risk management practices for generative AI implementation, identifying concerns like inaccurate results, copyright infringement, and systemic bias. It summarizes a survey's findings from Q4 2023 and presents management strategies adopted by organizations, such as monitoring compliance and conducting internal audits. This content is crucial for informing businesses about common risks associated with AI and the importance of establishing robust governance frameworks to manage these risks effectively.
generative AI, risk management, governance, compliance, audits, bias, data privacy, regulation, survey findings, Q4 2023
Mixed Chart
Deloitte
Saved
The slide includes text blocks with points about GCC countries' potential for CCUS, including geological storage capacity and government plans.
Strategic Planning
Energy & Utilities
Discusses the potential for CCUS in GCC countries, citing geological capacity, emission statistics, and governmental commitment to reducing CO2 emissions.
GCC, CCUS, potential, geological storage, government plans, CO2 emissions, strategic planning
Multiple Chart
Kearney
Saved
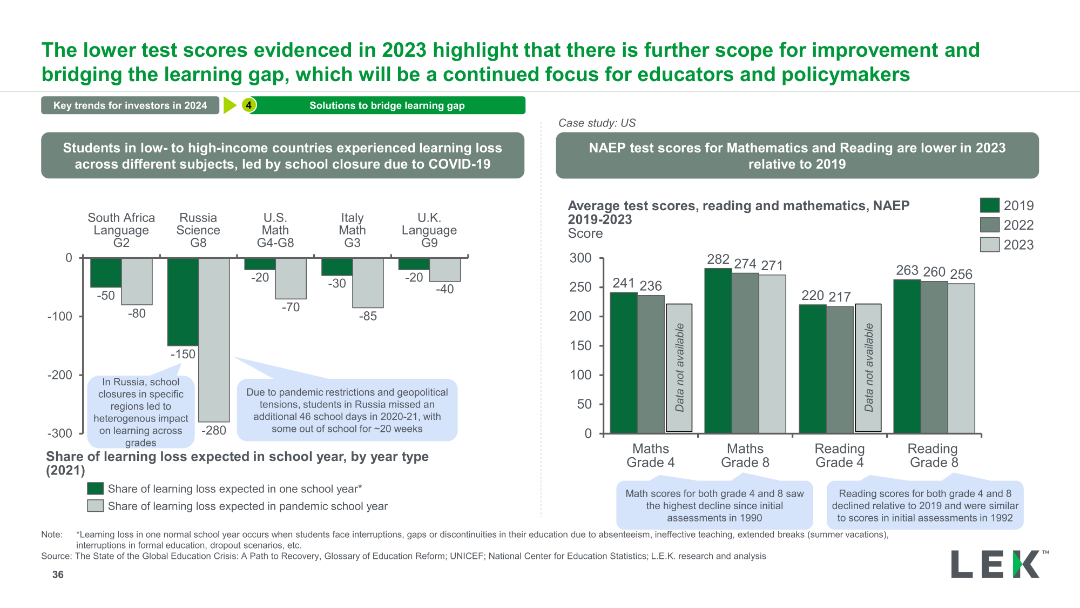
The slide contains a column chart showing learning loss in different countries, and a column chart comparing NAEP test scores for Mathematics and Reading from 2019 to 2023.
Strategic Planning
Education & Training
This slide analyzes the learning gaps caused by COVID-19, presenting data on learning loss across countries and trends in US NAEP test scores for Math and Reading.
Learning, Gap, COVID-19, Test Scores, Education, Analysis, Trends, Data, Recovery, Impact
Multiple Chart
LEK
Saved
The slide features three key areas: 'Net Profit Contribution' shown as a column chart, 'Income by region' displayed as a donut chart, and 'Regulatory capital' in a stacked column chart. It has a clear title at the top.
Financial Performance
Financial Services
This slide presents Macquarie Capital's financial overview, with a focus on net profit, income distribution by region, and regulatory capital allocation. It's intended for financial review and investment strategy discussions.
Net Profit, Income, Regulatory, Capital, Financial Overview, Investment Strategy
Multiple Chart
Morgan Stanley
Saved
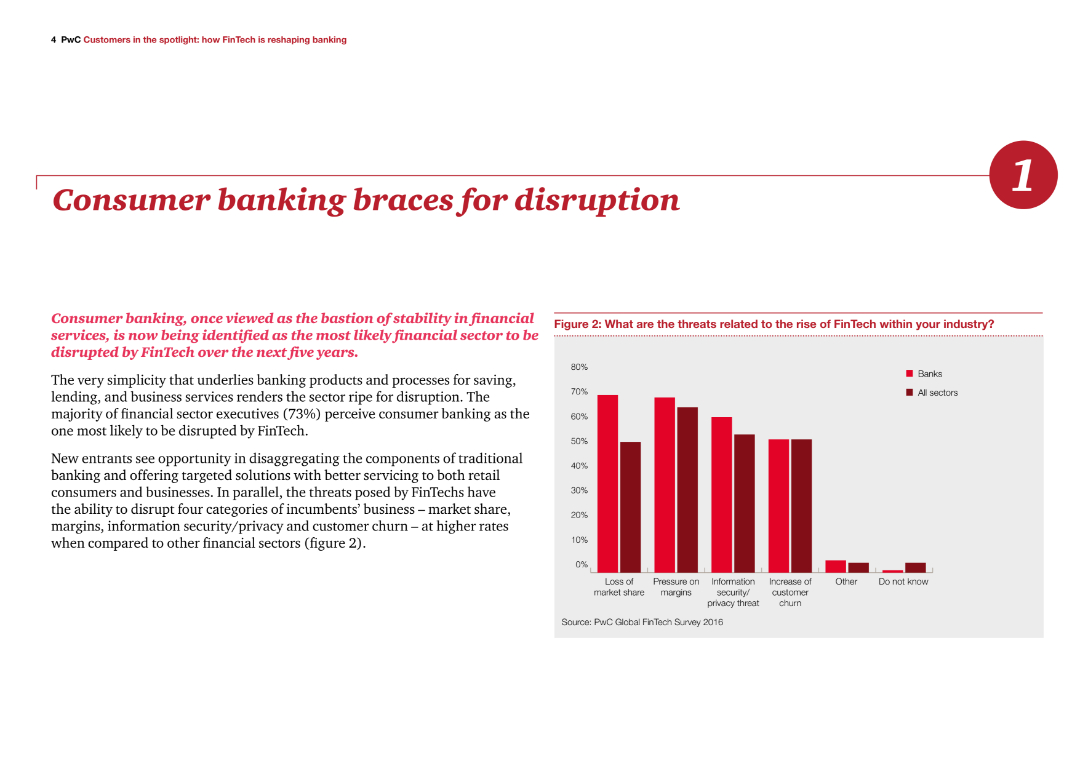
The slide features a column chart on the right illustrating threats posed by FinTech within the banking industry. The text discusses the disruption in consumer banking caused by FinTech advancements.
Market Analysis and Trends
Financial Services
The slide analyzes the threats and opportunities presented by FinTech in the consumer banking sector, emphasizing the potential for disruption and the need for banks to adapt to these changes.
FinTech, disruption, consumer banking, threats, opportunities
Mixed Chart
PwC/Strategy&
Saved
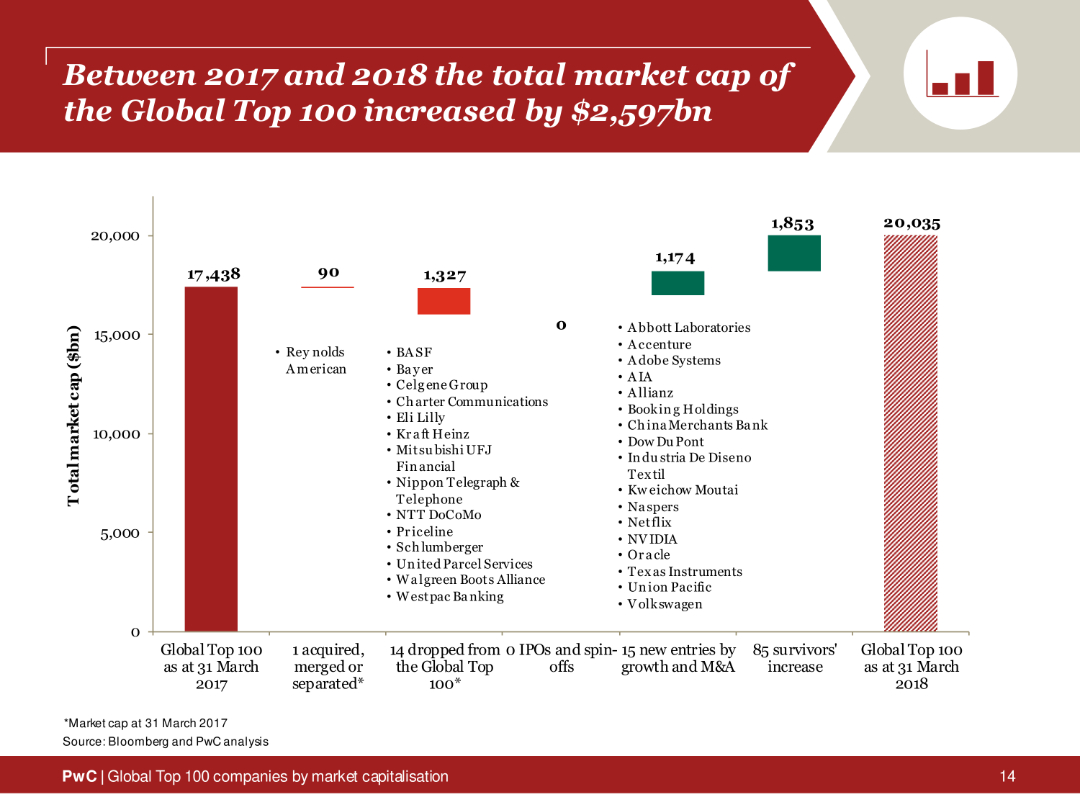
Column chart depicting changes in the total market cap of the Global Top 100 companies from 2017 to 2018, with sections showing new entries and survivors.
Financial Performance
Financial Services
Analysis of the market cap increase of the Global Top 100 companies, showing growth driven by new entries and existing companies.
market cap, global top 100, 2017, 2018, increase
Single Chart
PwC/Strategy&
Saved
A column chart compares the EBITDA multiple of global education companies in 2013. A dashed line represents the typical valuation size of standalone education assets.
Financial Performance
Education & Training
The slide is used to compare the EBITDA multiples of various education companies, showcasing the superior returns offered by education platforms compared to the typical valuation of standalone assets. It's useful for demonstrating the financial advantages of investing in the education sector.
EBITDA, Returns, Investors, Education, Valuation, Companies, Comparison
Single Chart
EY
Saved
The slide features circular charts and a bar chart. The top section shows survey results on new work approaches, and the bottom lists productivity strategies.
Operational Efficiency
Professional Services
Details new approaches for maintaining productivity and work-life balance in a hybrid work environment, based on survey responses.
productivity, work-life balance, hybrid work, survey, new approaches
Multiple Chart
EY
Saved
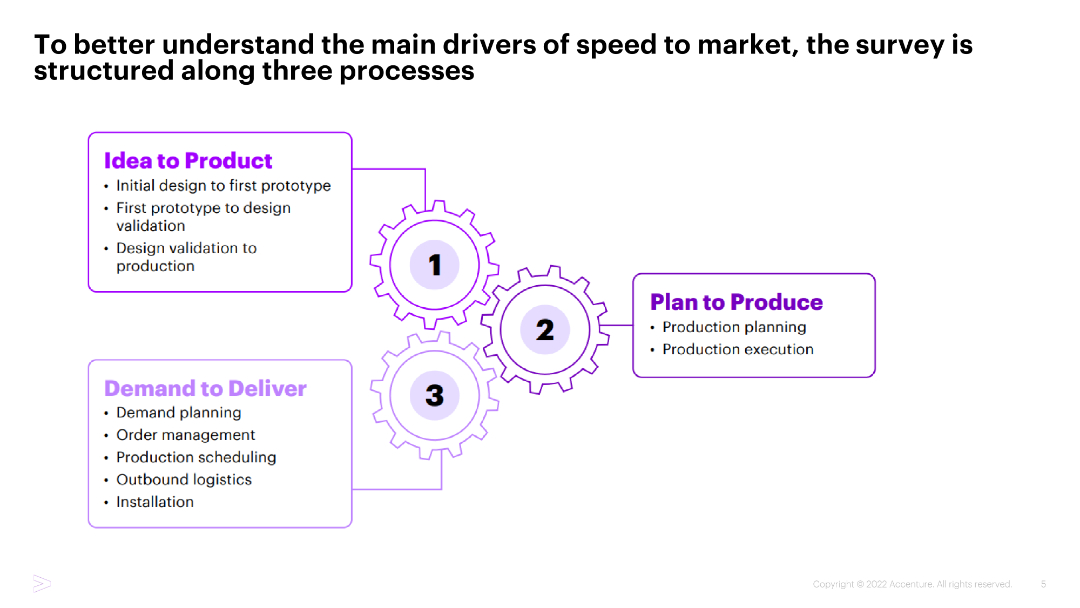
Diagram with three interconnected gears labeled "Idea to Product," "Plan to Produce," and "Demand to Deliver," detailing the stages from design to production and delivery.
Operational Efficiency
Industrial & Manufacturing
This slide explains the structure of the survey focused on speed to market, breaking it down into three main processes: Idea to Product, Plan to Produce, and Demand to Deliver.
Speed to market, Processes, Industrial manufacturing, Survey structure, Operational efficiency
Framework
Accenture
Saved
The slide features a pie chart and column charts about ESG assessment maturity by industry.
Risk Assessment and Management
Environmental Services & Sustainability
This slide covers the current maturity levels of ESG assessment across different industries based on a survey.
ESG, assessment, maturity, industry, survey
Multiple Chart
Deloitte
Saved
Combines column headers and callouts with specific quotes from industry leaders, using green tones to emphasize 'green' capital.
Investment Analysis
Energy & Utilities
Analyzes trends in green capital deployment in Southeast Asia, discussing the landscape of sustainable investments and challenges in funding.
green capital, investment trends, SEA, sustainable investments, funding challenges
Header Horizontal
Bain
Saved
The slide includes multiple bar charts with percentage values representing future-ready organizations excelling in various business areas. These bars are colored differently to represent categories such as operational efficiency, customer experience, and innovation.
Operational Efficiency
Technology & Software
This slide presents statistical data showing improvements in operational efficiency, customer experience, speed of product and service innovation, employee engagement, and business value generated from data over three years. The focus is on illustrating the progress and efficiency of future-ready organizations compared to others.
future-ready, operational efficiency, customer experience, innovation, data-driven, business improvement, comparison, survey data, Accenture Research
Multiple Chart
Accenture
Saved
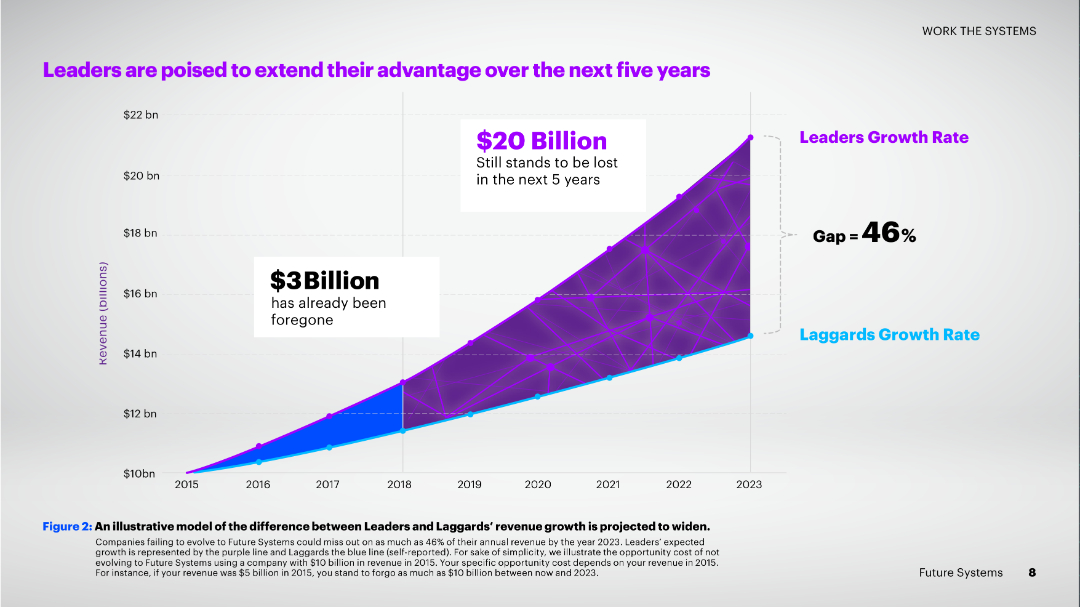
A slide with a line chart comparing the revenue growth rates of leaders and laggards over time, with projections extending to 2023.
Strategic Planning
Technology & Software
This slide illustrates the projected widening revenue growth gap between leaders and laggards, emphasizing the potential future losses for laggards if they fail to evolve their systems and adopt new technologies.
revenue growth, leaders, laggards, projections, future, advantage, technology, evolution, systems, gap
Single Chart
Accenture
Saved
Text and image layout with multiple sections detailing strategies for Global Wealth Management, Personal & Corporate Banking, Asset Management, and Investment Bank.
Strategic Planning
Financial Services
Outlines UBS's strategic plans to enhance client franchises and capabilities across different business areas, aiming for growth and scale.
Strategy, Client Franchises, UBS, Growth, Capabilities
Multiple Chart
UBS
Saved
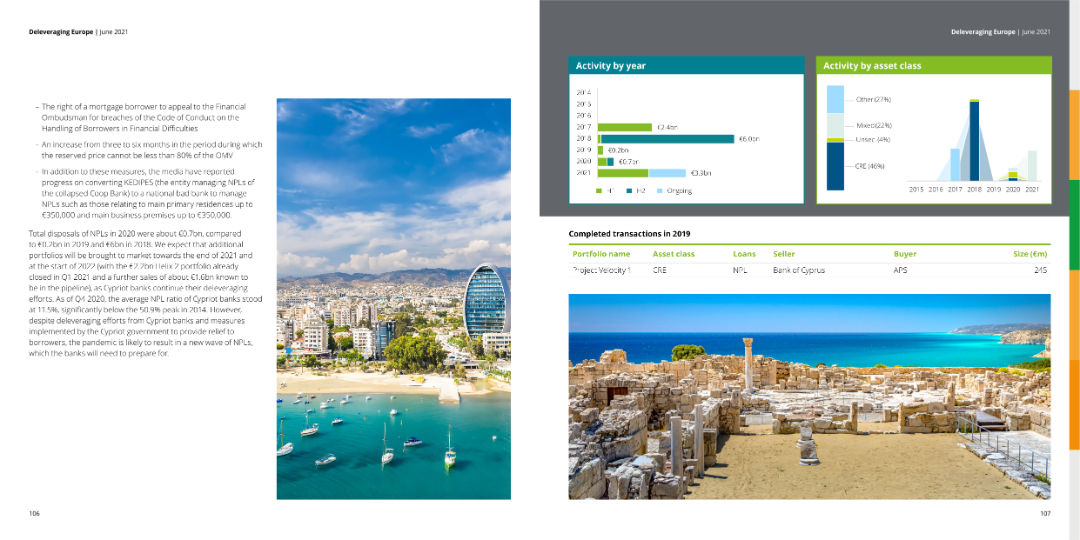
The slide presents tables of completed transactions for 2019, along with bar charts showing activity by year and asset class. The left side contains a dense text block discussing NPL volumes and bank actions.
Market Analysis and Trends
Financial Services
The slide offers a detailed overview of financial activities by year and asset class, including completed transactions in 2019, with insights into trends and strategic bank actions.
activity, transactions, asset class, trends, NPL
Multiple Chart
Deloitte
Saved
The slide presents a large circular progress chart indicating a 67% reduction, accompanied by icons and text detailing the benefits of connected reporting systems.
Operational Efficiency
Professional Services
Highlights the success of a connected reporting system in reducing reporting times and improving data integrity and visibility over financial performance, with an emphasis on standardization and remote capabilities.
Connected reporting, data integrity, financial visibility, reduction in time, standardization, remote reporting, process improvement
Mixed Chart
Deloitte
Saved
The slide is divided into sections with icons and text describing strategic focuses like refresh, expand, innovate, optimize, and digitize.
Strategic Planning
Technology & Software
Lays out a multi-faceted strategic plan for leveraging technologies and partnerships to maintain market leadership.
strategic focus, technology, partnerships, market leadership, innovation
Pillar
Citigroup
Saved
This world map slide highlights specific countries like the USA, China, India, and Japan with red pins, indicating a focus on these regions for the survey. It provides a clear global comparison context.
Industry Overview
Professional Services
Offers a global overview of the countries prioritized in the survey, marking them as critical for understanding varying cultural attitudes across different regions.
global survey, cultural study, USA, China, India, Japan
Graphic
PwC/Strategy&
Saved
Previous
Next
If nothing, comes up, please save your slides first
Create a FREE account to continue browsing
Receive Instant Access to 7,500+ of the internet's best slides
First Name
Last Name
Email
Password
I agree to all
Terms & Privacy Policy
Thank you! Your submission has been received!
Oops! Something went wrong while submitting the form.
Have an account?
Sign in
Column Chart
Heatmap
Chevron
Org Chart
Infographic
Callouts
Timeline
List
Graphic
Picture
Process Flow
Diagram
Paragraph
Map
Table
Framework
Subtitle
Takeaway Box
Icon
Other Chart
Radar Chart
Waterfall Chart
Mekko Chart
Pie Chart
Scatter Plot
Line Chart
Bar chart
Bullet points