My Account
My Slides
Search by Category
Templates
Leave Feedback
Login
Logout
Get Started
Browse all Slides
Browse all Slides
Create a FREE Account
Instant access to 1,000+ real slides from top companies like McKinsey, BCG, Goldman Sachs, Google and many more!
First Name
Last Name
Email
Password
I agree to all
Terms & Privacy Policy
Thank you! Your submission has been received!
Oops! Something went wrong while submitting the form.
Have an account?
Sign in
Saved Slides
Features column chart displaying sustainable finance volumes and a list of policies and achievements, clearly depicting growth and initiatives with a focus on environmental sustainability.
Regulatory and Compliance
Financial Services
Highlights Deutsche Bank's sustainability efforts in Q2 2023, including increased sustainable finance volumes and various ESG achievements, such as green bond issuances and policy updates.
Sustainability, ESG achievements, sustainable finance, green bonds, policy updates, Deutsche Bank, Q2 2023
Mixed Chart
Deutsche Bank
Saved
Presents bar and column charts with financial results and revenues related to asset management, along with detailed textual information on performance metrics and asset under management (AuM) growth.
Financial Performance
Financial Services
This slide focuses on the Q2 2023 financial results for Deutsche Bank's Asset Management division, detailing revenue distribution and highlighting growth in assets under management.
Asset management, financial results, revenue distribution, AuM growth, Deutsche Bank, Q2 2023
Multiple Chart
Deutsche Bank
Saved
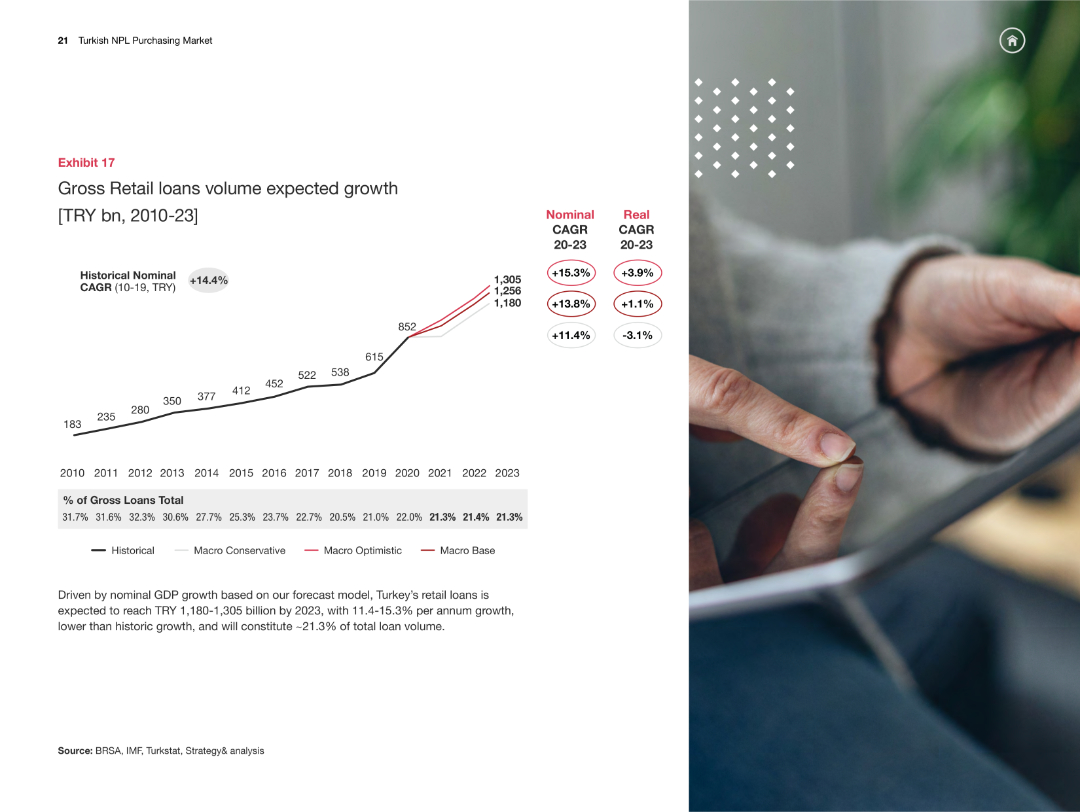
Line chart predicting gross retail loans volume growth from 2010-2023, with various growth scenarios.
Market Analysis and Trends
Financial Services
The slide projects the growth of retail loan volumes in Turkey from 2010-2023, analyzing different growth rates and economic conditions.
retail loans, growth forecast, macroeconomic analysis, financial trends, Turkey
Mixed Chart
PwC/Strategy&
Saved
Table layout describing key measures and commitments of Germany's Hydrogen Strategy with icons illustrating different sectors like generation and infrastructure.
Regulatory and Compliance
Energy & Utilities
Describes Germany's hydrogen strategy with an emphasis on infrastructure, partnerships, and regulations to enhance the use of hydrogen as a sustainable energy source.
Germany, hydrogen, strategy, infrastructure, partnerships, 2020-2030
Multiple Chart
McKinsey
Saved
Displays a shift in the newspaper classified revenue from predominantly newspapers in 2003 to a majority online in 2019, illustrated with a before-and-after pie chart comparison. The slide provides detailed annotations about key players in the online classified market.
Competitive Landscape
Media & Entertainment
Examines the transition of classified ad revenues from traditional newspapers to online platforms, identifying key players that dominate the new market landscape. This slide is valuable for strategic planning in media and advertising, providing insights into market dynamics and potential areas for investment or innovation.
market shift, classified ads, online platforms, media strategy, competitive analysis
Multiple Chart
Accenture
Saved
Presents a multi-line graph showing trends in domestic flight bookings with a forecast outlook.
Market Analysis and Trends
Transportation & Logistics
Assesses the recovery in air travel with domestic flight booking trends, indicating a slow return to pre-pandemic levels.
air travel, booking trends, recovery forecast, pandemic impact
Multiple Chart
BCG
Saved
Column chart showing changes in waste treatment methods in the EU from 2004-2020.
Regulatory and Compliance
Environmental Services & Sustainability
Highlights the impact of regulations on recycling and waste management.
waste treatment, EU regulations, recycling rates, incineration, sustainability
Mixed Chart
Roland Berger
Saved
The slide is data-focused, containing several statistics and data points highlighted by blue markers. Icons are used to visually represent the different metrics, and there's a balance of text and imagery to keep the viewer engaged.
Strategic Planning
Technology & Software
This slide presents compelling data points to showcase the importance of next-generation software development capabilities. It seems aimed at decision-makers, underscoring the strategic benefits such as faster development and deployment, as well as AI's role in testing and maintenance.
Development, Leadership, Strategy, Software, AI, Capabilities, Testing, Deployment
Header Horizontal
McKinsey
Saved
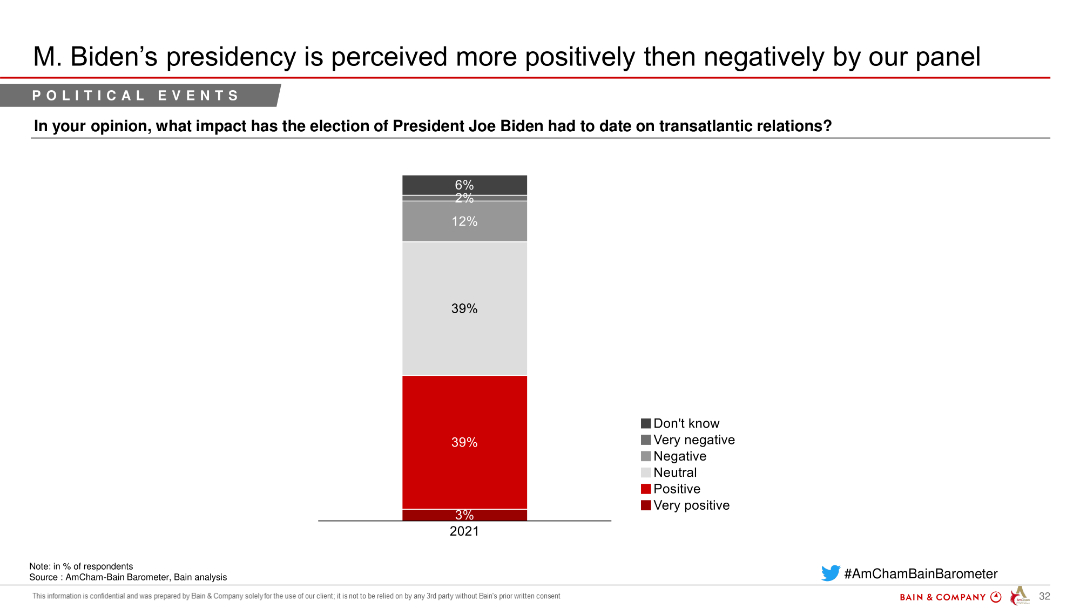
Column chart depicting perceptions of President Joe Biden's impact on transatlantic relations, with segmented responses indicating varying degrees of positivity and negativity.
Market Analysis and Trends
Government & Public Sector
Shows the impact of President Joe Biden's election on transatlantic relations, with a majority seeing it positively, as indicated by a survey of respondents.
Biden, transatlantic, relations, perceptions, survey
Single Chart
Bain
Saved
The slide contains text on the left side and two doughnut charts on the right. The text discusses effective targeting strategies, and the charts compare 'All Entrants' and 'All Winners' with respect to having a primary target.
Strategic Planning
Media & Entertainment
This slide explains the effectiveness of mass and targeted strategies in driving brand growth, comparing the presence of a primary target between all entrants and winners.
targeting strategies, mass, targeted, primary target, brand growth
Multiple Chart
IPSOS
Saved
Two primary visual elements are present. The left section shows a blue column chart detailing 'NET INTEREST-BEARING DEBT' in euros over five quarters, with a noticeable downward trend. The right section shows a grey-scale column chart of the 'MATURITY STRUCTURE OF INTEREST-BEARING DEBT' for the upcoming years, demonstrating an extended maturity profile. The upper right corner provides a real-life connection with an image of two people in a hallway, symbolizing the corporate world.
Financial Performance
Financial Services
Outlines the significant year-over-year reduction in net interest-bearing debt and the extension of its maturity profile, critical for financial planning and investment discussions.
debt reduction, financial planning, interest-bearing debt, maturity structure, y-o-y comparison, financial management, investment strategy
Multiple Chart
Goldman Sachs
Saved
Features tables and line charts showing historical performance metrics such as CET1 ratio and liquidity coverage.
Financial Performance
Financial Services
Discusses the franchise strength in maintaining consistent capital and liquidity over time, with specific metrics.
capital, liquidity, performance, metrics, franchise
Multiple Chart
Barclays
Saved
The slide is divided into two sections; on the left, there is textual content, and on the right, there are three vertical bar graphs in blue and turquoise shades. The graphs display predictions for the use of various digital financial services. The layout is clean and easy to navigate, with a distinct separation between text and graphical data.
Market Analysis and Trends
Financial Services
The slide forecasts the likely adoption of digital financial services focusing on digital supply chain financing and consumer financing options over the next 1 to 2 years. It provides statistical data that can be used by financial analysts and strategists to evaluate potential areas of growth and prepare for market shifts in digital financial service offerings.
Digital Finance, Supply Chain, Consumer Financing, Future, Trends, Merchants, Adoption, Predictions, Statistics, Analysis
Single Chart
Bain
Saved
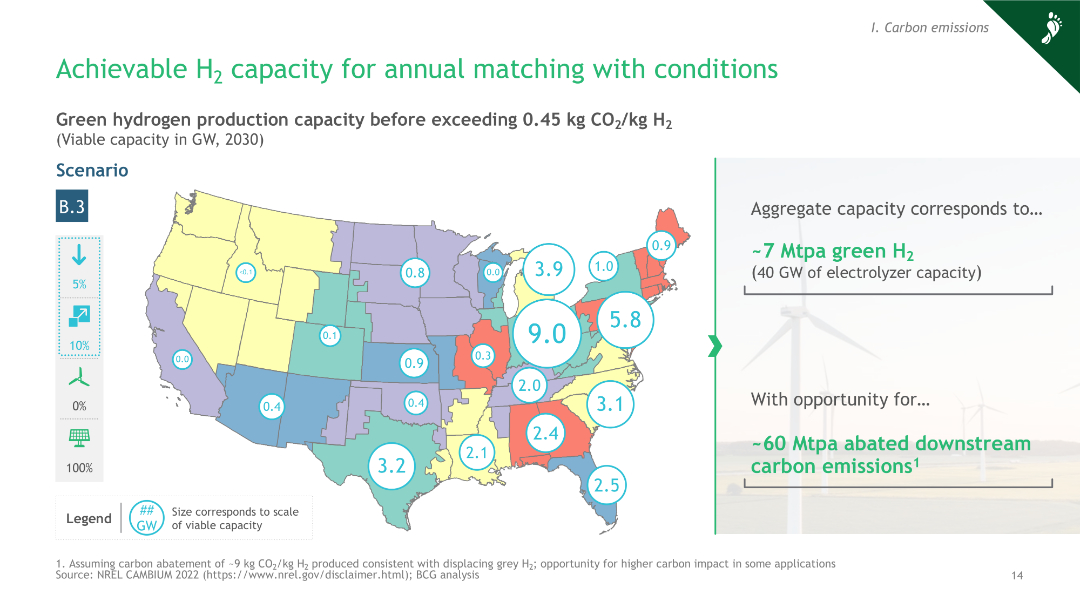
A map of the United States with color-coded states and numerical data points indicating green hydrogen production capacity, along with a column chart.
Market Analysis and Trends
Energy & Utilities
The slide presents a scenario analysis of green hydrogen production capacity across the U.S., projecting viable capacity before exceeding CO2 limits.
hydrogen, capacity, carbon emissions, scenario, 2030
Graphic
BCG
Saved
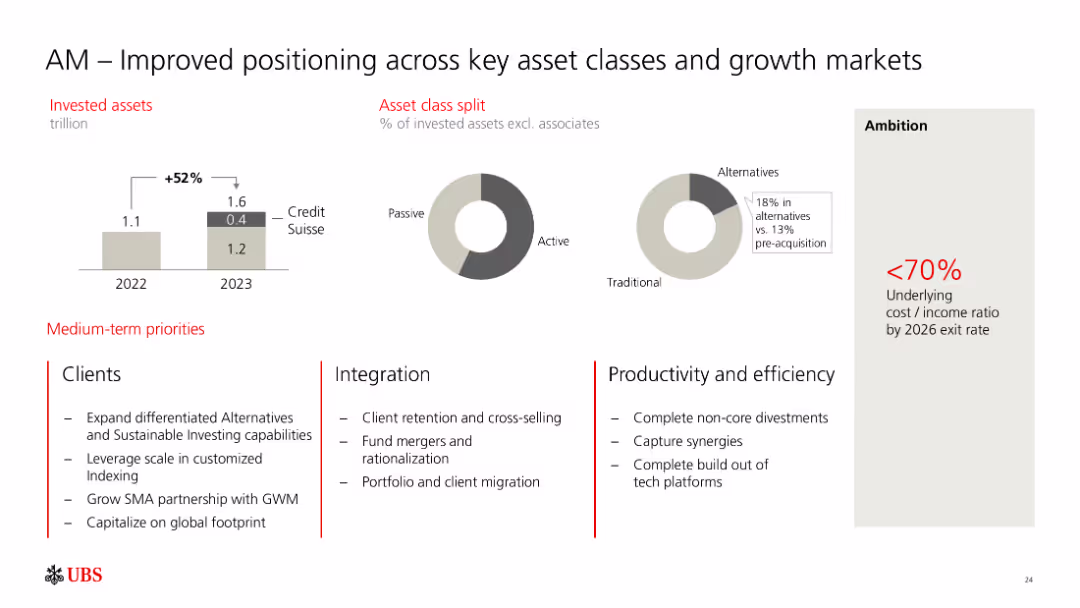
The slide shows bar graphs indicating invested assets growth from 1.1 trillion in 2022 to 1.6 trillion in 2023, including Credit Suisse assets. Pie charts display the asset class split between passive, active, and alternatives. Text outlines medium-term priorities for clients, integration, and productivity.
Market Analysis and Trends
Financial Services
The slide highlights improved positioning of asset management across key asset classes and growth markets. It details asset growth, asset class distribution, and strategic priorities in client services, integration, and productivity. This slide is suitable for discussing asset management strategies and market positioning.
asset management, growth markets, asset classes, strategic priorities, Credit Suisse
Multiple Chart
UBS
Saved
The slide features a column chart on the right side showing the proportion of total industry GVA growth by 2030 associated with physical asset optimization.
Market Analysis and Trends
Agriculture & Food Production
The slide discusses the impact of physical asset performance on GVA growth across various industries, highlighting agriculture, forestry, and fishing as having the highest uplift.
GVA, physical asset, growth, agriculture, forestry, fishing, construction, manufacturing, utilities, industry
Mixed Chart
Accenture
Saved
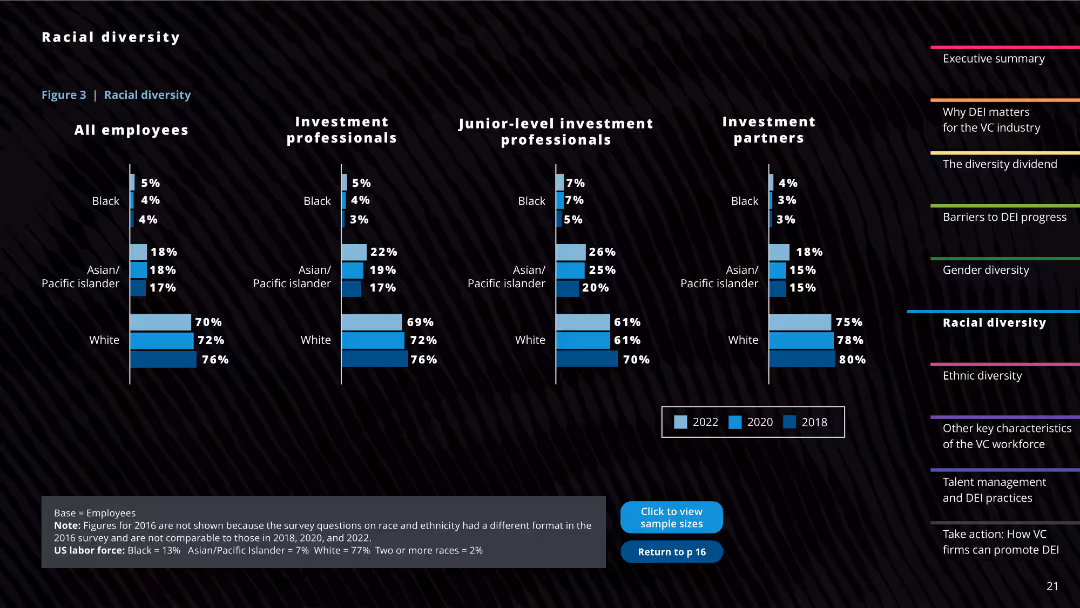
The slide includes multiple column charts illustrating racial diversity statistics for all employees, investment professionals, junior-level professionals, and partners. It also has textual notes and a comparison footnote.
Human Resources and Talent Management
Professional Services
This slide showcases the racial diversity within the venture capital industry, providing comparisons across different years and professional levels, highlighting underrepresentation of certain racial groups.
Racial diversity, VC industry, Professional levels, Diversity comparison, Ethnic representation
Multiple Chart
Deloitte
Saved
Slide includes column charts and segmented bar charts with revenue data across years.
Market Analysis and Trends
Media & Entertainment
Presents the forecasted growth of music, radio, and podcasts revenue in India, mentioning shifts in media consumption patterns.
music, radio, podcasts, India, revenue
Multiple Chart
PwC/Strategy&
Saved
The slide has three distinct sections with a pie chart, a stacked bar chart, and a bar chart. It details the distribution of survey participants by title, number of employees, and industry, using a color-coded scheme for easy distinction.
Industry Overview
Technology & Software
Aimed at providing demographic insights about the respondents of a survey, this slide breaks down the participant composition by job title, company size, and industry sectors, offering a clear visual representation for easier audience understanding.
survey demographics, participant distribution, job titles, company size, industry sectors, pie chart, bar chart, stacked bar chart
Multiple Chart
JP Morgan
Saved
Similar in layout to slide 11, uses icons and lists to illustrate the strategic initiatives and their benefits in terms of market and client metrics.
Strategic Planning
Financial Services
Reiterates the details of JPMorgan’s focused strategic investments, particularly in client coverage, showcasing the targeted benefits like market share and client satisfaction.
Strategy, Client Coverage, Banking, Market Share, Client Satisfaction, Investments
Linear Flow
JP Morgan
Saved
Contains stats on talent acquisition and diversity spotlight, presented in a two-column layout. It's clear with a corporate blue and gray color palette.
Human Resources and Talent Management
Financial Services
This slide emphasizes Goldman Sachs' commitment to talent development and diversity, sharing figures on partner promotions and diversity increases, potentially used in HR presentations or recruitment campaigns to exhibit the company's values and performance culture.
Talent management, diversity, human resources, Goldman Sachs, culture
Boxed
Goldman Sachs
Saved
Includes a scatter plot chart correlating the number of high-growth companies with GVA by local authorities, supplemented with descriptive text and a key.
Regulatory and Compliance
Government & Public Sector
Explores the relationship between the density of high-growth companies and local economic performance measured by GVA, offering insights into regional economic policies.
local economies, high-growth companies, GVA, economic impact, local authorities, regional development, policy implications, economic analysis, public sector
Mixed Chart
Barclays
Saved
The slide uses a comparative layout to describe the attitudes, age and city tier distribution, and purchase behaviors of the three largest luxury consumer segments.
Customer and Market Segmentation
Consumer Goods
This slide highlights the three largest luxury consumer segments in China, detailing their characteristics, age distribution, city tier, and purchase behaviors.
luxury segments, consumer behavior, China market, age distribution, purchase behavior
Table
BCG
Saved
Contains a bar chart illustrating the increased adoption of online shopping in various Southeast Asian countries between 2019 and 2020, with a key to interpret the data.
Market Analysis and Trends
Retail & E-commerce
Indicates a leap in consumer preference for online shopping channels across Southeast Asia, highlighting the trend towards digital marketplaces.
Consumer behavior, online channels, market trend, Southeast Asia, bar chart
Single Chart
Bain
Saved
The slide includes a world map with transaction volumes marked and several directional flow arrows.
Market Analysis and Trends
Financial Services
This slide highlights global cross-border M&A activity, focusing on regional trends and the impact of USD strength.
Cross-border, transactions, global, M&A, USD strength
Graphic
JP Morgan
Saved
Previous
Next
If nothing, comes up, please save your slides first
Create a FREE account to continue browsing
Receive Instant Access to 1,000+ slides from companies like McKinsey, Google, and Goldman Sachs
First Name
Last Name
Email
Password
I agree to all
Terms & Privacy Policy
Thank you! Your submission has been received!
Oops! Something went wrong while submitting the form.
Have an account?
Sign in
Column Chart
Heatmap
Chevron
Org Chart
Infographic
Callouts
Timeline
List
Graphic
Picture
Process Flow
Diagram
Paragraph
Map
Table
Framework
Subtitle
Takeaway Box
Icon
Other Chart
Radar Chart
Waterfall Chart
Mekko Chart
Pie Chart
Scatter Plot
Line Chart
Bar chart
Bullet points