My Account
My Slides
Search by Category
Templates
Leave Feedback
Login
Logout
Get Started
Browse all Slides
Browse all Slides
Create a FREE Account
Instant access to 1,000+ real slides from top companies like McKinsey, BCG, Goldman Sachs, Google and many more!
First Name
Last Name
Email
Password
I agree to all
Terms & Privacy Policy
Thank you! Your submission has been received!
Oops! Something went wrong while submitting the form.
Have an account?
Sign in
Saved Slides
The slide shows a comparative analysis using two doughnut charts illustrating global investment values by region for 2012 and 2016.
Market Analysis and Trends
Financial Services
Highlights the growth of Asia in global investment values, showing significant increases from 2012 to 2016, emphasizing Asia’s growing market share.
Asia, Investment, Global Market, Trends
Multiple Chart
Kearney
Saved
A comparative layout displaying traditional vs. talent-to-value approaches in engaging organizational change agents, with two pie charts reflecting engagement strategies and their impacts.
Human Resources and Talent Management
Professional Services
This slide contrasts traditional and modern approaches to engaging employees and stakeholders in sustainability strategies, advocating for a broader inclusion of organizational talents and key customers to maximize the strategic impact and operational success in aligning with SDGs.
Employee Engagement, Sustainability, SDGs, Stakeholder Inclusion, Strategic Impact
Mixed Chart
McKinsey
Saved
This slide shows a line chart depicting the maturity curve of CO₂ utilization technologies. It includes various stages and labeled points for different utilization methods.
Technology and Digital Transformation
Energy & Utilities
It details the maturity stages of CO₂ utilization technologies, from lab work to mature technology, highlighting methods like synthetic methane, methanol, saline formation, and enhanced coal bed methane.
CO₂ utilization, maturity curve, synthetic methane, methanol, saline formation, coal bed methane, energy, utilities
Single Chart
Kearney
Saved
Features bar charts displaying preferred locations for socialization, along with a notable quote from a survey respondent.
Market Analysis and Trends
Retail & E-commerce
Reveals consumer preferences for socializing in the upcoming months, with a strong inclination towards home settings and virtual connections.
Socializing trends, Consumer preferences, Virtual connection, Home setting, Market research, Bar charts, Survey insights, Telecommunications
Single Chart
Accenture
Saved
Column chart showing the Net Promoter Score (NPS) for recommending France as a country to settle from 2014 to 2019, with quotes from respondents.
Market Analysis and Trends
Professional Services
The slide presents the decline in NPS for recommending France as a place to settle, despite the positive feedback on quality of life.
NPS, settle, France, quality of life, decline, recommendation
Mixed Chart
Bain
Saved
Contains columns outlining various resiliency capabilities in dynamic product development, autonomous production, and agile organization, using circular icons and connecting arrows.
Operational Efficiency
Industrial & Manufacturing
Analyzes different resiliency capabilities needed in engineering, supply, production, and operations, emphasizing investment priorities in dynamic and sustainable product development, among others.
resiliency, dynamic development, autonomous production, agile organization, investment priorities, engineering, supply chain, Accenture Research
Header Vertical
Accenture
Saved
The slide has two line charts comparing suppliers' delivery times and manufacturing backlogs of work in the UK, US, Euro area, and Japan, with annotations.
Operational Efficiency
Transportation & Logistics
The slide analyzes the trends in supplier delivery times and manufacturing backlogs, noting improvements in supply availability and reduced bottlenecks.
suppliers, delivery, backlogs, UK, US, Euro area, Japan
Multiple Chart
Accenture
Saved
Column chart showing performance returns of the MS INVF Sustainable Asia Equity Fund over various periods.
Financial Performance
Financial Services
Displays fund performance for different time horizons, compared to a blended index, emphasizing past performance metrics.
Performance, returns, fund, equity, index
Mixed Chart
Morgan Stanley
Saved
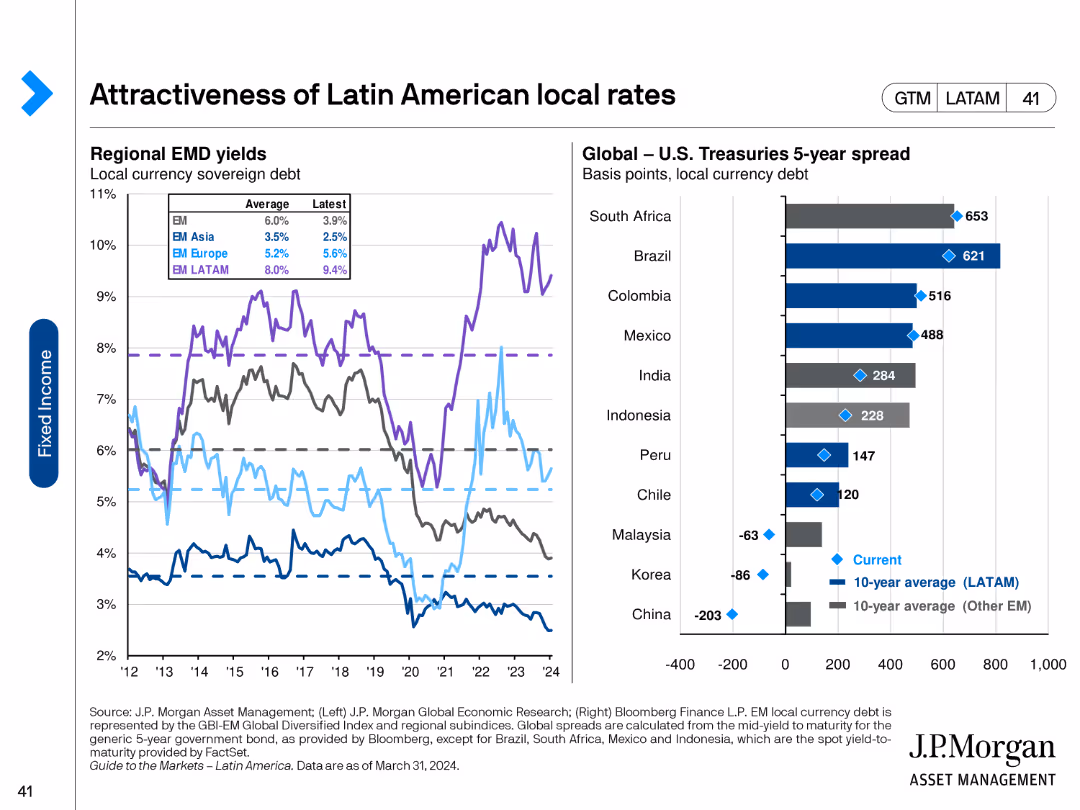
This slide features line charts showing regional EMD yields and a column chart comparing global U.S. Treasuries 5-year spread across various countries.
Market Analysis and Trends
Financial Services
The slide evaluates the attractiveness of Latin American local rates by comparing EMD yields and U.S. Treasury spreads across different countries, highlighting investment opportunities and risks.
Latin America, local rates, EMD yields, U.S. Treasuries, investment opportunities, investment risks, economic analysis
Multiple Chart
JP Morgan
Saved
Includes column charts showing the adoption rates of different air conditioning technologies, alongside a column chart projecting future energy demands for cooling in Southeast Asia.
Market Analysis and Trends
Energy & Utilities
Discusses the potential for significant carbon abatement in Southeast Asia through the adoption of more efficient cooling technologies in residential AC systems, detailing the current low penetration rates and the high potential for improvement.
cooling, energy efficiency, SEA, carbon abatement
Multiple Chart
Bain
Saved
List format with icons, descriptive text, and benefits. Blue and white color scheme.
Product and Service Analysis
Healthcare & Pharmaceuticals
Details recent technological advances in bioengineering and their practical applications.
Bioengineering, Technology, Advancements, Healthcare
Header Vertical
McKinsey
Saved
A minimalistic design with the title text prominently displayed against a light blue geometric background.
Investment Analysis
Financial Services
This slide presents the fiscal year and quarter, highlighting its purpose as an investor presentation. It is used to set the context for the financial information that will follow.
Fiscal, Quarter, Investor, Presentation, Financial
Title
Booz Allen Hamilton
Saved
The slide features two column charts comparing the impact of the Great Resignation on front and back office compensation packages. An image on the left shows professionals in a casual meeting. The charts use different shades of orange and red to display data.
Human Resources and Talent Management
Financial Services
The slide outlines how managers have increased base compensation and discretionary bonuses to address labor challenges for both front and back offices, focusing on improving compensation to retain staff.
Compensation, labor trends, Great Resignation, front office, back office
Multiple Chart
EY
Saved
Highly detailed slide with tables and color-coded metrics covering epidemic progression, economic impact, and business impact.
Risk Assessment and Management
Government & Public Sector
Offers a comprehensive snapshot of various metrics relevant to COVID-19's impact, useful for data-driven decision-making.
Epidemic Progression, Economic Impact, Consumer Activity, Business Impact, Mobility, Trade, Emissions
Table
BCG
Saved
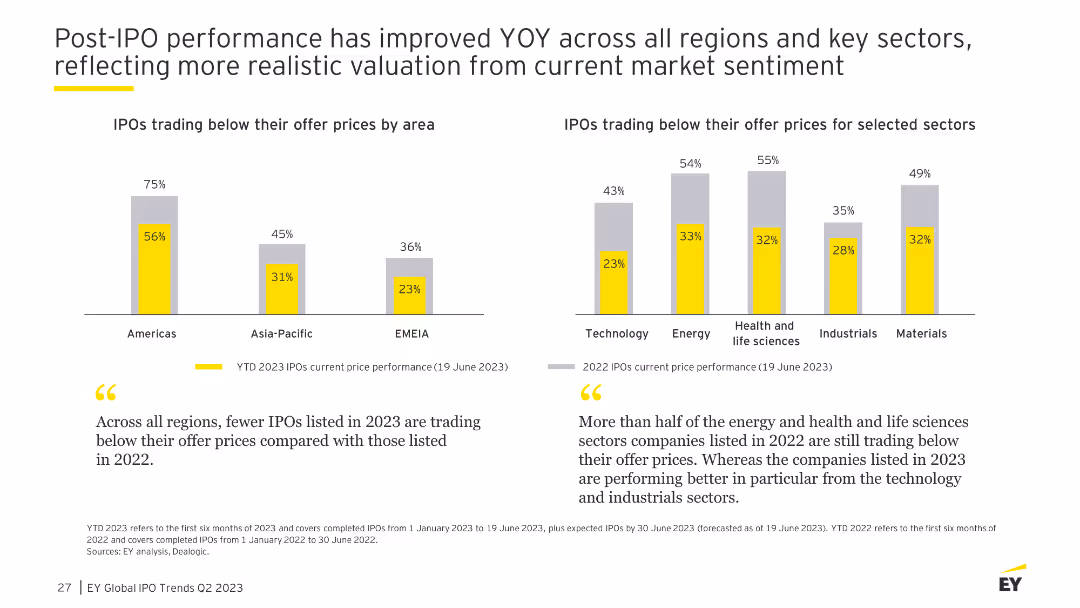
The slide includes bar charts showing the percentage of IPOs trading below their offer prices by region and sector, highlighting improvements in post-IPO performance.
Market Analysis and Trends
Financial Services
This slide discusses the year-over-year improvement in post-IPO performance across various regions and sectors, with detailed statistics on trading performance relative to offer prices.
IPO, performance, YOY, financial, regions
Multiple Chart
EY
Saved
A column chart comparing the online hotels and airlines market size between 2015 and 2025 with percentages and a sidebar for description.
Market Analysis and Trends
Hospitality & Tourism
The slide focuses on the projected growth of the online hotels and airlines sector in SEA, detailing the expected market size and the market's percentage of the total travel market by 2025.
hotels, airlines, SEA, market size, growth
Mixed Chart
Bain
Saved
A combination of text and column charts showing global M&A volume, control premium, and deal statistics for 2023.
Financial Performance
Financial Services
Summarizes key statistics of global M&A activity in 2023, highlighting volumes, premiums, and major deals.
M&A, global highlights, key stats, 2023, volume, control premium, deals, statistics, summary
Multiple Chart
JP Morgan
Saved
A slide with text and image showcasing a woman using a tablet, with data presented on income sources in households.
Technology and Digital Transformation
Professional Services
Addresses the financial dynamics in households, focusing on women’s roles as earners and the impact on career priorities.
primary earners, household income, gender roles, financial security, career priorities, women's earnings
Multiple Chart
Deloitte
Saved
The slide features a series of column charts displaying the perceived helpfulness of different internet services before, during, and after lockdown, categorized under e-Commerce, Transport & Food, and Online Media.
Market Analysis and Trends
Technology & Software
The slide analyzes the perceived value of digital services during different phases of lockdown, suggesting a lasting positive shift in user sentiment towards these services.
e-Commerce, digital services, lockdown, perception shift, column chart, user sentiment, helpfulness
Single Chart
Bain
Saved
Features an image of a creatively colored cow, alongside mobile interfaces and a strategic model diagram.
Market Analysis and Trends
Financial Services
The slide humorously uses a cow image to represent "growing our audience," linked to a new credit access program, highlighting strategic partnerships and market segment targeting, which are crucial for expanding consumer access and data acquisition.
audience growth, strategic partnerships, marketing, credit access, innovation
Mixed Chart
Barclays
Saved
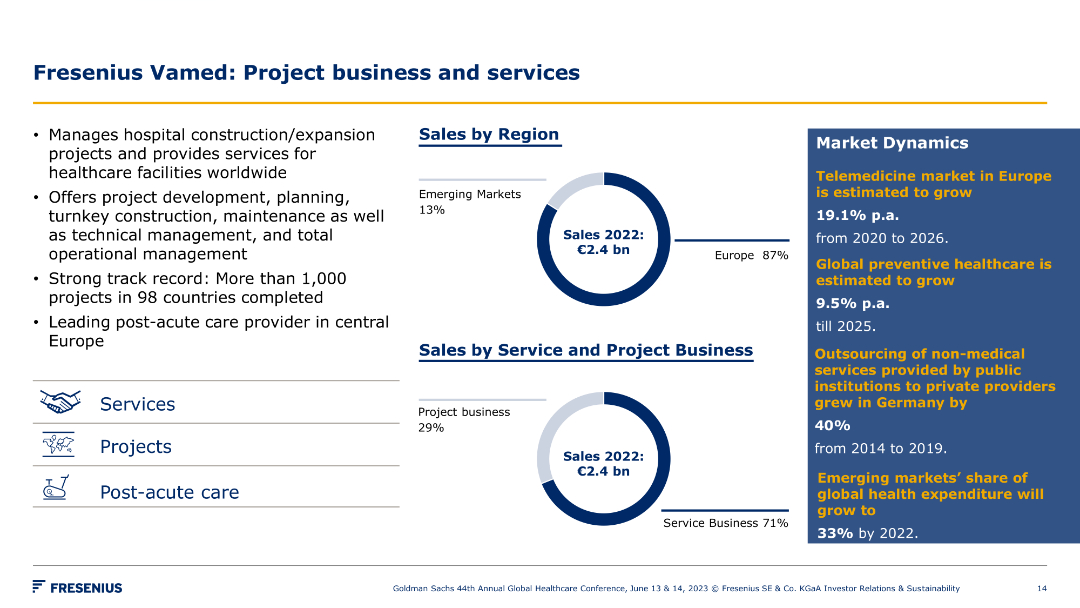
Pie charts of sales by region and by service/project business, with key points on project management and market dynamics. Icons for services and projects included.
Product and Service Analysis
Healthcare & Pharmaceuticals
The slide showcases Fresenius Vamed's project business and services, detailing sales distribution, project management expertise, and market dynamics in healthcare.
project business, healthcare, sales, services, market dynamics, Fresenius Vamed, strategy, growth, management, region
Multiple Chart
Goldman Sachs
Saved
Contains diagrams and text explaining self-sovereign and passwordless identity verification methods.
Technology and Digital Transformation
Technology & Software
Discusses innovative identity verification technologies and their roles in enhancing digital security and user autonomy.
self-sovereign identity, passwordless identity, biometrics, digital security, innovation
Header Horizontal
McKinsey
Saved
Balanced design with a 3D layered block diagram on the left and concise text on the right, using a muted color palette to focus attention on the data representation.
Technology and Digital Transformation
Energy & Utilities
This slide presents an overview of the "Global Energy Perspective 2022," highlighting its scope across segments, energy products, and countries. The accompanying diagram illustrates the report's multidimensional approach, covering a range of sectors from transport to hydrogen supply, emphasizing the depth and breadth of analysis contained within. The text succinctly conveys the report's comprehensiveness and the state-of-the-art tools and models used to project energy demand and trends across the globe.
Energy Systems, Global Analysis, Demand Outlook, Segmentation
Graphic
McKinsey
Saved
The slide features a line chart depicting the levelized cost of CO2 capture for various large-scale post-combustion projects at coal-fired power plants from 2004 to 2028.
Market Analysis and Trends
Energy & Utilities
The slide highlights how CCUS technology can expect cost reductions from learning and technology deployment, showing historical and projected costs for various facilities. The chart illustrates a downward trend in capture costs over time, with expected further reductions as technology improves.
CO2 capture, cost, post-combustion, trends
Single Chart
Kearney
Saved
Circular flow diagram detailing risk management strategy components, supplemented by a list of key elements in risk management.
Risk Assessment and Management
Financial Services
Highlights the company's approach to risk management, illustrating the cycle of continuous improvement in culture, oversight, and processes. Ideal for presentations on corporate governance and risk mitigation strategies.
Risk Management, Corporate Governance, Oversight, Continuous Improvement, Culture, Structural, Cyber Risk, Reputational Risk, Process, Controls
Linear Flow
Goldman Sachs
Saved
Previous
Next
If nothing, comes up, please save your slides first
Create a FREE account to continue browsing
Receive Instant Access to 1,000+ slides from companies like McKinsey, Google, and Goldman Sachs
First Name
Last Name
Email
Password
I agree to all
Terms & Privacy Policy
Thank you! Your submission has been received!
Oops! Something went wrong while submitting the form.
Have an account?
Sign in
Column Chart
Heatmap
Chevron
Org Chart
Infographic
Callouts
Timeline
List
Graphic
Picture
Process Flow
Diagram
Paragraph
Map
Table
Framework
Subtitle
Takeaway Box
Icon
Other Chart
Radar Chart
Waterfall Chart
Mekko Chart
Pie Chart
Scatter Plot
Line Chart
Bar chart
Bullet points