My Account
My Slides
Search by Category
Templates
Leave Feedback
Login
Logout
Get Started
Browse all Slides
Browse all Slides
Create a FREE Account
Instant access to 1,000+ real slides from top companies like McKinsey, BCG, Goldman Sachs, Google and many more!
First Name
Last Name
Email
Password
I agree to all
Terms & Privacy Policy
Thank you! Your submission has been received!
Oops! Something went wrong while submitting the form.
Have an account?
Sign in
Saved Slides
The slide features a column chart with bars representing different years from 2023 to 2028. Each bar is labeled with the corresponding year and percentage.
Strategic Planning
Financial Services
This slide presents a forecast of profitability through restructuring, showing an increase in return on capital over the years from 3% in 2023 to 18% in 2028.
profitability, restructuring, growth, capital, forecast
Single Chart
UBS
Saved
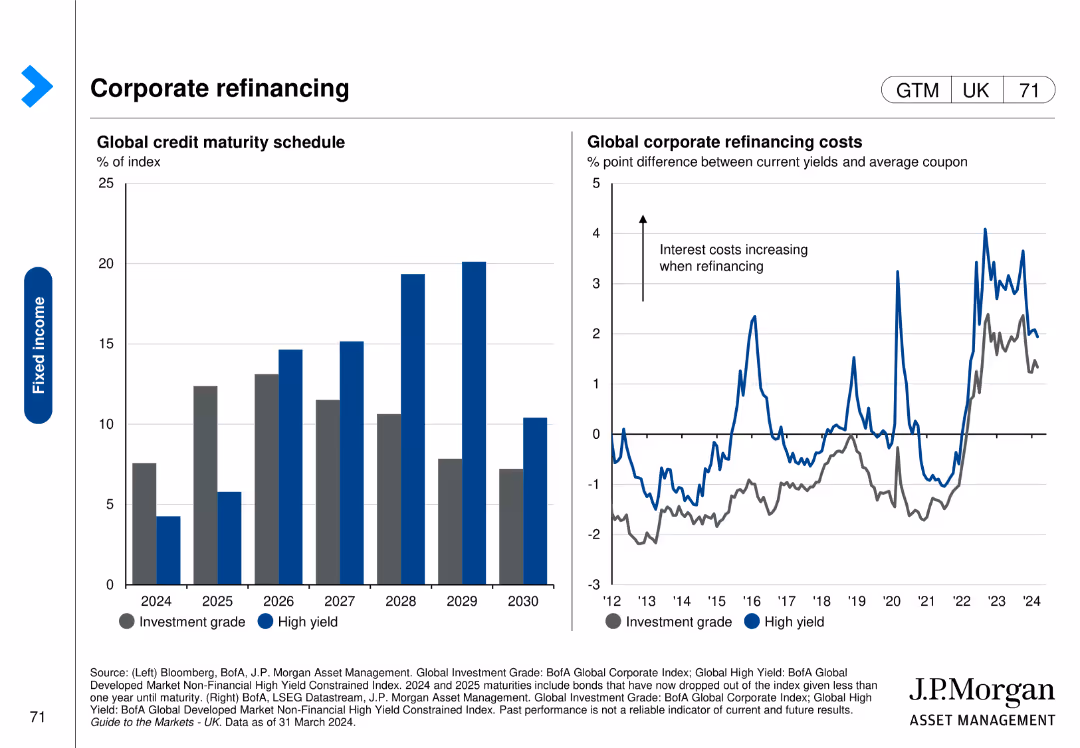
This slide includes a column chart on the left showing the global credit maturity schedule and a line chart on the right detailing global corporate refinancing costs over time.
Risk Assessment and Management
Financial Services
The slide examines the global corporate refinancing landscape, focusing on the maturity schedule of credit and the impact on refinancing costs.
refinancing, corporate, credit, maturity schedule, costs
Multiple Chart
JP Morgan
Saved
Features two column charts showing the distribution of liabilities and capital before and after restructuring, using different colors for each category and labeled axes.
Financial Performance
Financial Services
This slide shows financial restructuring impacts, displaying reduced liabilities and new capital distribution, essential for understanding the company's financial health and stability post-restructuring.
financial restructuring, liabilities, capital, stability
Mixed Chart
Barclays
Saved
Bar charts displaying U.S. employment and revenue by sector during COVID-19, segmented by contact intensity and susceptibility to lockdown measures.
Market Analysis and Trends
Professional Services
Examines the impact of COVID-19 on various U.S. economic sectors, offering insights into employment and revenue changes under different restrictions.
COVID-19, economic sectors, employment, revenue, U.S., impact analysis, lockdown, sector analysis
Multiple Chart
BCG
Saved
Features a large column chart depicting the monthly development of STO funding volume across two years. Uses a red color palette for bars, with annotations for notable peaks and descriptions of specific STO events.
Regulatory and Compliance
Financial Services
Discusses the trends in STO funding over time, emphasizing key periods of growth and decline. It offers insights into the regulatory developments affecting the market and predicts the future relevance of STOs in the investment landscape, noting the importance of a stable regulatory infrastructure.
STOs, blockchain, funding trends, regulatory, 2018, 2019, growth, investment
Single Chart
PwC/Strategy&
Saved
The slide uses a combination of column charts and text blocks to show CET1 ratio movements for Q423 and FY23. It features a mixture of blue and gray.
Financial Performance
Financial Services
Highlights the CET1 ratio movements for Q423 and FY23, showing progress toward the target range. Includes figures for profits, buybacks, and other factors.
CET1 ratio, Q423, FY23, target range, financial performance, dividend, RWA, FX, buyback, attributable profit
Multiple Chart
Barclays
Saved
The slide features a combination of column charts and a table. It showcases data on the number of IPOs and proceeds in the Americas for 2023, compared to 2022. Additional tables provide details on stock exchanges, sectors, and notable IPOs.
Market Analysis and Trends
Financial Services
The slide analyzes the revival of the IPO market in the Americas, highlighting an increase in both the number of IPOs and proceeds. It provides a detailed breakdown by stock exchanges, sectors, and largest IPOs, with data supporting bullish equities sentiment.
IPOs, stock exchanges, financial trends, market revival, sector analysis
Multiple Chart
EY
Saved
This slide has a central Goldman Sachs logo with surrounding text describing different roles such as "Investor," "Business," "Operator," "Issuer," and "Employer." The layout is organized with clear, readable segments.
Strategic Planning
Government & Public Sector
It explains the role of Goldman Sachs' Sustainable Finance Group in mobilizing expertise to address clients' ESG needs. The slide is pertinent for discussing strategic planning and commercial opportunities within sustainable finance, detailing how the firm engages with various stakeholders.
ESG, sustainable finance, Goldman Sachs, strategic planning, expertise
Framework
Goldman Sachs
Saved
The slide features a large image at the top left with text on the right, including a trend assessment with bar charts.
Technology and Digital Transformation
Retail & E-commerce
Discusses voice commerce, highlighting the use of smart speakers and voice commands to enhance online shopping experiences.
Voice Commerce, Smart Speakers, Voice Commands, Retail, Shopping, AI, Personalization, Customer Interaction
Mixed Chart
Deloitte
Saved
A line chart displaying the integration cost as a percentage of cost synergies, with marked percentiles and a clear delineation of the median.
Financial Performance
Professional Services
Analyzes integration costs relative to annual synergies, providing a financial perspective on the cost-effectiveness of integration strategies.
integration, costs, synergies, financial analysis, cost-effectiveness
Single Chart
Deloitte
Saved
Slide presents a series of blue column charts tracking EBIT Margin Benefit from Cost Savings over several years.
Financial Performance
Consumer Goods
This slide demonstrates the company’s financial efficiency over time, highlighting consistent cost savings as reflected in EBIT margin improvements.
cost savings, EBIT margin, financial, yearly, analysis
Single Chart
Barclays
Saved
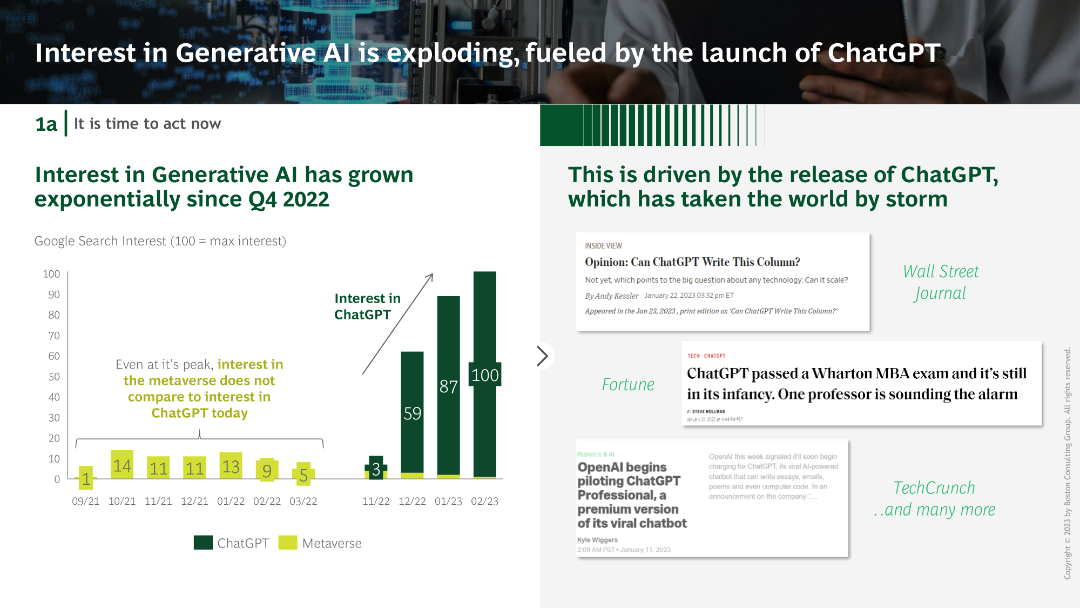
Column chart showing exponential growth in interest for ChatGPT since Q4 2022. Accompanied by quotes from various publications highlighting its impact.
Market Analysis and Trends
Technology & Software
The slide presents the rapid growth in interest for ChatGPT, driven by its launch, and includes media excerpts to emphasize its widespread influence.
ChatGPT, Generative AI, Interest growth, Market trends, Media impact
Mixed Chart
BCG
Saved
This slide features a column chart and a pie chart to illustrate China's growth in the luxury market. It uses green and gray colors and includes detailed data points and projections.
Market Analysis and Trends
Consumer Goods
The slide provides an analysis of China's luxury market growth, its contribution to the global market, and future projections, highlighting significant market trends and growth rates.
Luxury Market, China, Growth, Global Market, Projections, Data, Analysis, Trends, Retail
Multiple Chart
BCG
Saved
The slide includes a pie chart showing the split of organizational expenses and a column chart listing top business priorities for leagues and event organizers. It also contains text discussing profitability and growth priorities.
Market Analysis and Trends
Media & Entertainment
This slide focuses on the cost structure and business priorities of European esports leagues and event organizers. It highlights the emphasis on growing business, achieving revenue growth, and attracting new sponsors.
esports, expenses, business priorities, growth, sponsors
Multiple Chart
Deloitte
Saved
Slide includes a column chart with green color highlights. It's structured into sections with clear headers and bullet points for easy reading.
Operational Efficiency
Education & Training
Details the role of community hubs in vocational pathways and employment, highlighting their support in gaining skills and providing training opportunities. It assesses the economic and social benefits provided by these hubs, emphasizing their importance in community development.
vocational training, community development, employment support, skills acquisition
Mixed Chart
Deloitte
Saved
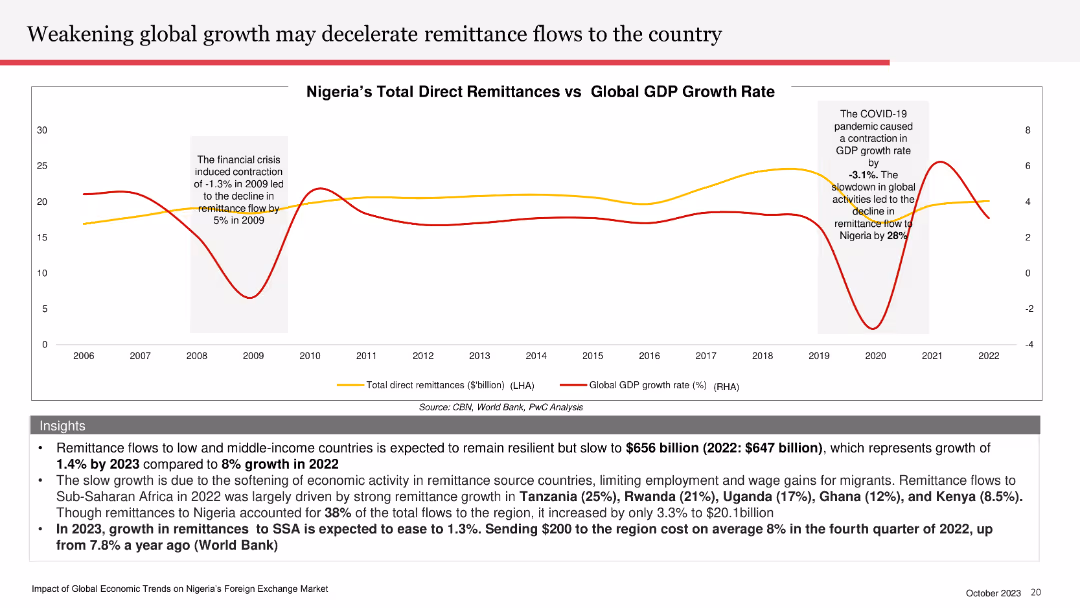
The slide features a line chart comparing Nigeria’s total direct remittances with global GDP growth rate, with separate lines for each.
Market Analysis and Trends
Financial Services
The slide explores how weakening global economic growth may slow remittance flows to Nigeria, with specific data and forecasts.
global growth, remittance flows, Nigeria, GDP growth, economic trends
Mixed Chart
PwC/Strategy&
Saved
Features line graphs comparing the sex ratio at birth (SRB) across various countries from 1970 to 2017, highlighting trends and disparities.
Market Analysis and Trends
Government & Public Sector
Discusses the implications of gender ratio imbalances in selected countries, exploring the causes and long-term impacts of skewed sex ratios. It provides a historical perspective on how policies and cultural factors have shaped these trends.
gender ratio, demographics, policy, cultural impact, trends
Mixed Chart
Roland Berger
Saved
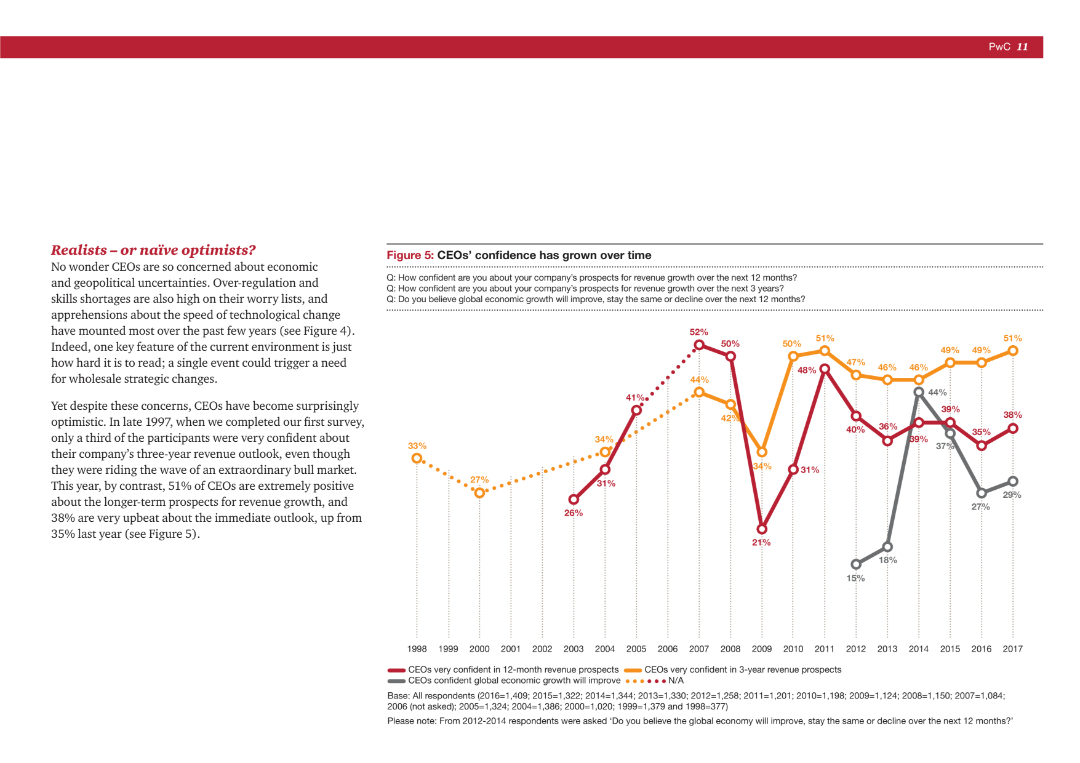
A mix of text and a line chart showing the change in CEOs' confidence over time regarding revenue growth and economic outlook.
Market Analysis and Trends
Professional Services
The slide tracks the historical confidence of CEOs in their company's revenue growth and the global economy, showing trends from 1998 to 2017.
CEO confidence, revenue growth, economic outlook, historical trends, market analysis
Mixed Chart
PwC/Strategy&
Saved
The slide compares the compound annual growth rate (CAGR) of technology investments to other sectors using a bar graph and provides explanatory text for observed trends in deal value growth.
Market Analysis and Trends
Technology & Software
This slide contrasts the growth rates in technology venture investing with other sectors, highlighting periods of resilience and expansion. It discusses the macroeconomic conditions influencing these trends and the notable increase in deal values in technology, emphasizing the sector's robust performance compared to others.
technology growth, CAGR, venture investing, market analysis, sector comparison
Mixed Chart
Oliver Wyman
Saved
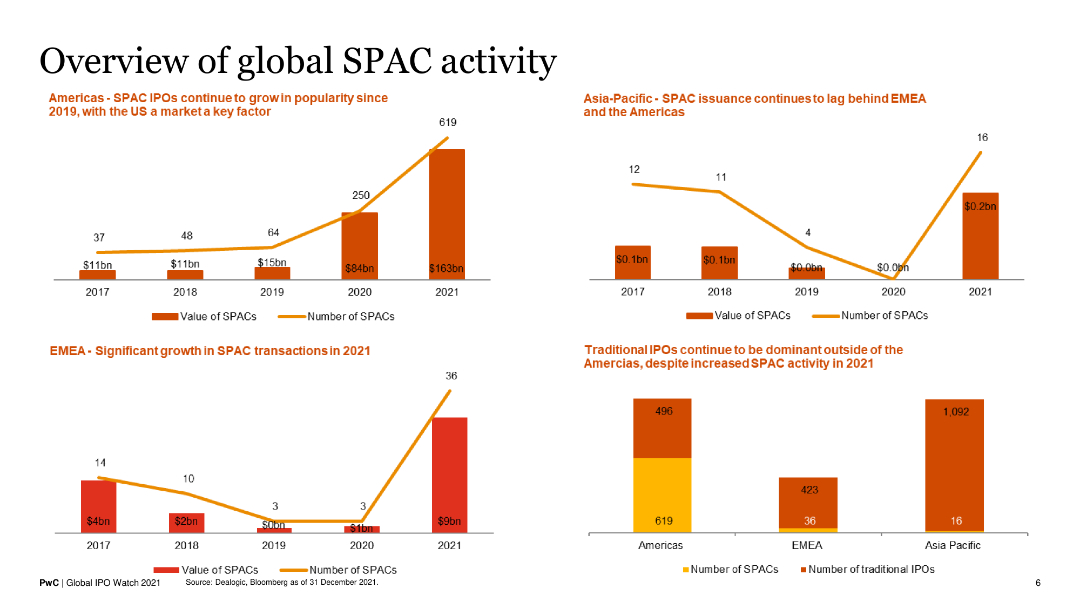
This slide contains four column charts, each showing the number and value of SPACs and traditional IPOs in different regions (Americas, EMEA, Asia-Pacific) from 2017 to 2021.
Market Analysis and Trends
Financial Services
The slide provides a comparative overview of SPAC and IPO activities across various regions, highlighting significant growth in the Americas.
SPACs, IPOs, financial markets, regional analysis, growth trends
Multiple Chart
PwC/Strategy&
Saved
Multiple bar and column graphs, with a clean layout displaying JPMorgan's asset management performance metrics.
Financial Performance
Financial Services
This slide aims to communicate JPMorgan's strategy and success in scaling asset management, using data visualizations to highlight growth in various investment types and to position themselves as industry leaders with effective ETFs and SMAs.
scaling, asset management, JPMorgan, ETFs, performance
Multiple Chart
JP Morgan
Saved
Slide with comparative column chart showing corporate income tax rates across ASEAN countries. Professional layout with a focus on clear data presentation.
Regulatory and Compliance
Financial Services
Discusses the changes in corporate income tax in the Philippines and compares it with other ASEAN countries, relevant for financial analysis.
Taxation, ASEAN, Philippines, corporate tax, comparative analysis
Mixed Chart
Deloitte
Saved
Slide is a table layout detailing figures, with clear demarcation and legible text.
Risk Assessment and Management
Energy & Utilities
Analyzes BBVA's exposure to the Oil & Gas sector, with a breakdown by region and subsegment.
Oil, Gas, exposure, BBVA, risk
Table
Morgan Stanley
Saved
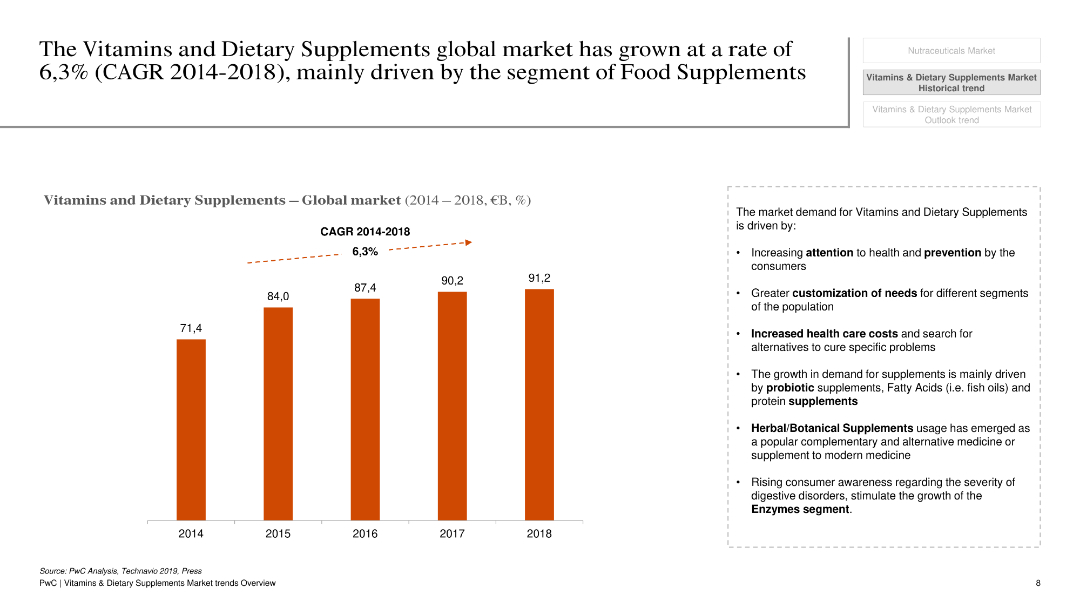
The slide has a white background with a column chart showing global market growth of vitamins and dietary supplements from 2014 to 2018.
Market Analysis and Trends
Healthcare & Pharmaceuticals
This slide presents the growth rate of the global market for vitamins and dietary supplements, highlighting the CAGR and key growth drivers.
Vitamins, dietary supplements, market growth, CAGR, global, healthcare, pharmaceuticals, trends, analysis
Mixed Chart
PwC/Strategy&
Saved
The slide features a two-column layout with a title and text explaining the key enhancements in financial risk management planned for the next 12 months, supported by a column chart.
Financial Performance
Financial Services
This slide presents planned enhancements in financial risk management, such as stress testing, risk measurement, and data aggregation, to improve financial stability.
financial risk management, enhancements, stress testing, risk measurement, data aggregation
Mixed Chart
EY
Saved
Previous
Next
If nothing, comes up, please save your slides first
Create a FREE account to continue browsing
Receive Instant Access to 1,000+ slides from companies like McKinsey, Google, and Goldman Sachs
First Name
Last Name
Email
Password
I agree to all
Terms & Privacy Policy
Thank you! Your submission has been received!
Oops! Something went wrong while submitting the form.
Have an account?
Sign in
Column Chart
Heatmap
Chevron
Org Chart
Infographic
Callouts
Timeline
List
Graphic
Picture
Process Flow
Diagram
Paragraph
Map
Table
Framework
Subtitle
Takeaway Box
Icon
Other Chart
Radar Chart
Waterfall Chart
Mekko Chart
Pie Chart
Scatter Plot
Line Chart
Bar chart
Bullet points