My Account
My Slides
Search by Category
Templates
Leave Feedback
Login
Logout
Get Started
Browse all Slides
Browse all Slides
Create a FREE Account
Instant access to 1,000+ real slides from top companies like McKinsey, BCG, Goldman Sachs, Google and many more!
First Name
Last Name
Email
Password
I agree to all
Terms & Privacy Policy
Thank you! Your submission has been received!
Oops! Something went wrong while submitting the form.
Have an account?
Sign in
Saved Slides
A bar graph and timeline are depicted, contrasting the private funding value across different halves of the years. The visual elements are in shades of blue, offering a stark visual against the white background. The data points are clear, and there is a dotted line indicating a forecasted trend.
Investment Analysis
Financial Services
The slide outlines the growth in deal value in Singapore, making it a preferred investment destination in the region. It provides historical and current data on private funding values, useful for assessing the investment climate and predicting future trends in regional investment activities.
investment, growth, deal value, Singapore, private funding
Single Chart
Bain
Saved
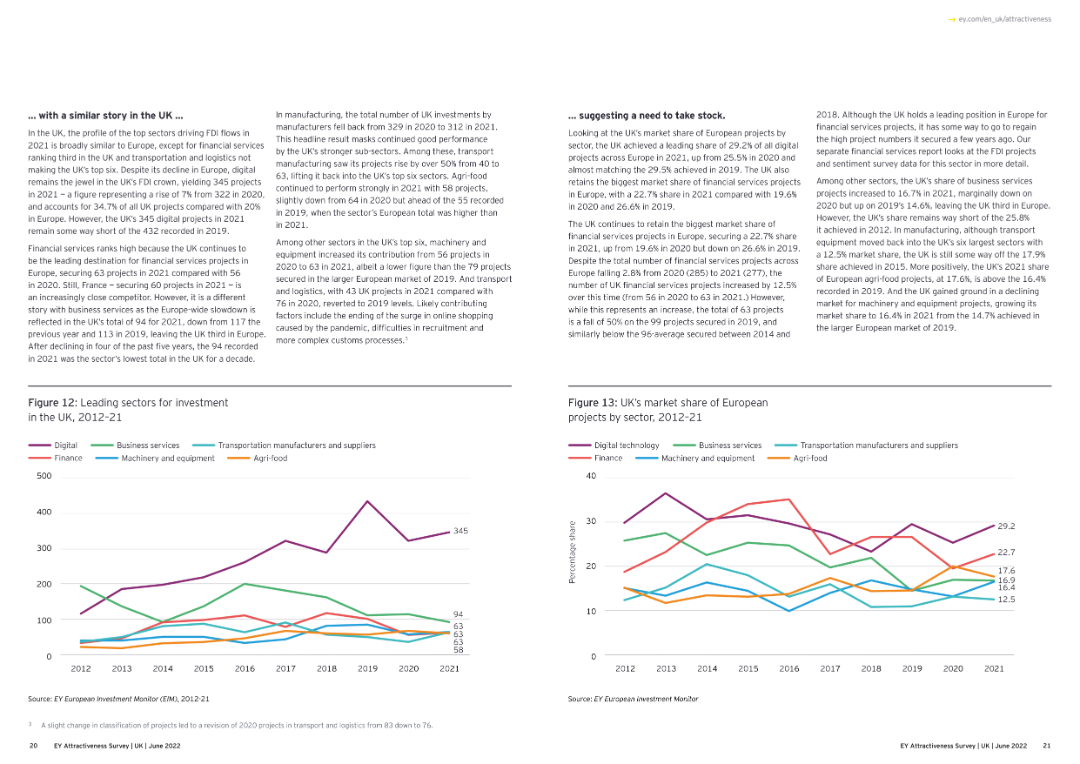
The slide contains a line chart displaying the leading sectors for investment in Europe from 2012 to 2021, with multiple colored lines representing sectors.
Market Analysis and Trends
Financial Services
It shows the trends in investment across various sectors in Europe over the years, indicating the rise and fall in investment preferences.
investment, sectors, Europe, trends, 2012-21
Multiple Chart
EY
Saved
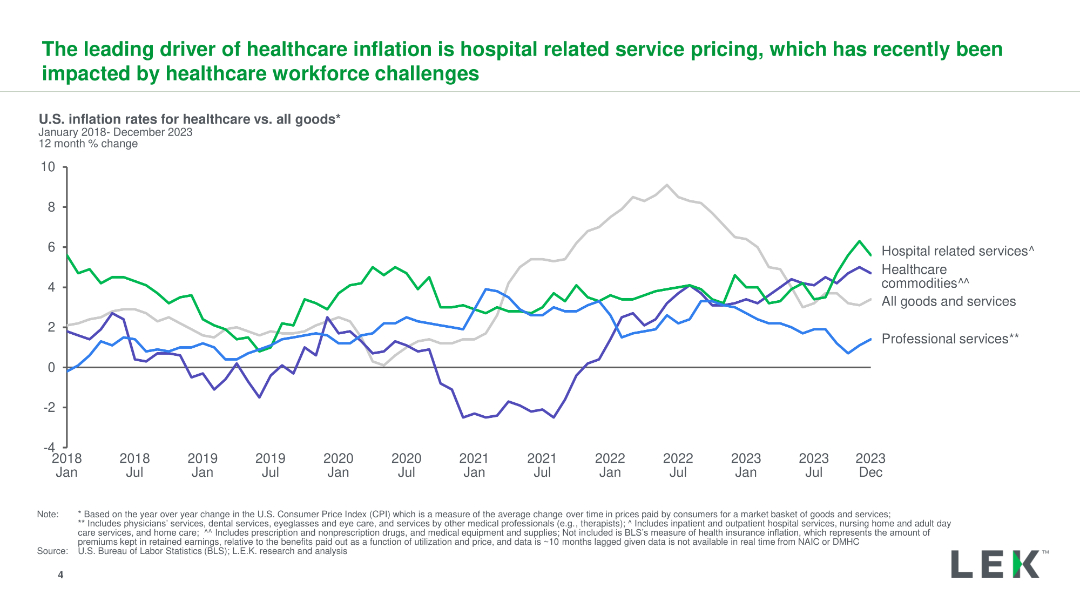
A line chart displaying U.S. inflation rates for healthcare services, commodities, and professional services from 2018 to 2023, with distinct color coding for each category.
Market Analysis and Trends
Healthcare & Pharmaceuticals
The slide explains the main drivers of healthcare inflation, emphasizing the impact of hospital service pricing and workforce challenges on recent trends.
inflation, healthcare, services, pricing, trends
Single Chart
LEK
Saved
Table with projects for delivery years and their values, client names. Column chart for net order book by segments. List of projects under execution. Company logo.
Operational Efficiency
Energy & Utilities
Details robust order book valued at ~$18B, upcoming project deliveries, and the segmentation of net order book. Used for showcasing financial strength and operational capacity.
order book, projects, net value, clients, execution, rigs, floaters, financial strength
Mixed Chart
Morgan Stanley
Saved
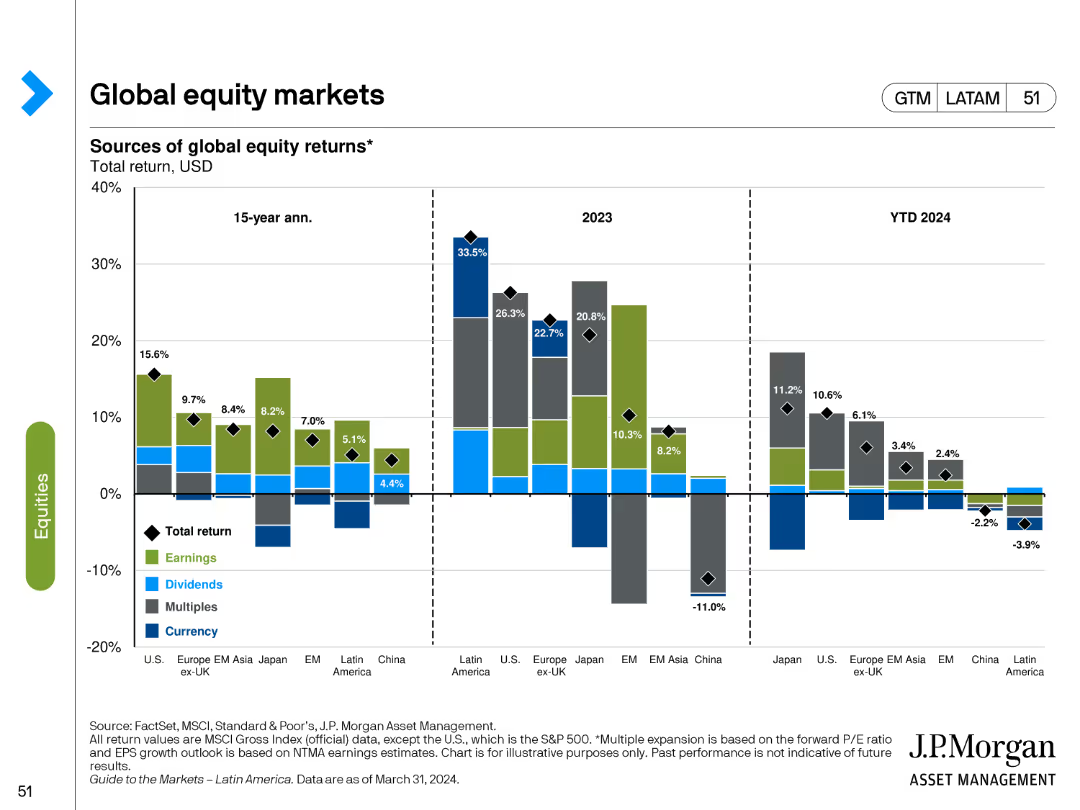
The slide features bar charts showing sources of global equity returns over different time periods. It uses various colors to represent different components of total return, such as earnings, dividends, and currency effects.
Market Analysis and Trends
Financial Services
It examines the sources of equity returns across global markets, providing insights into the factors driving performance in different regions and time frames.
Global equities, returns, earnings, dividends, currency effects
Multiple Chart
JP Morgan
Saved
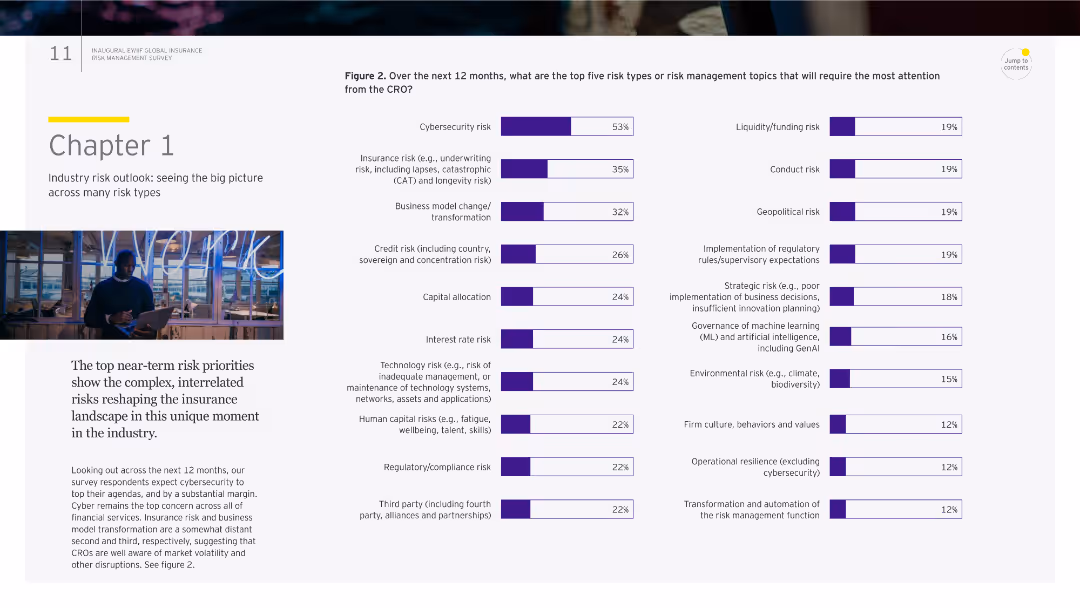
The slide has a column chart and a title "Chapter 1." The chart shows the top five risk types expected to require attention from the CRO.
Market Analysis and Trends
Financial Services
This slide presents the top risk priorities for the insurance industry over the next 12 months, focusing on cybersecurity, insurance risk, and business model changes.
risk outlook, cybersecurity, insurance, market trends, CRO
Multiple Chart
EY
Saved
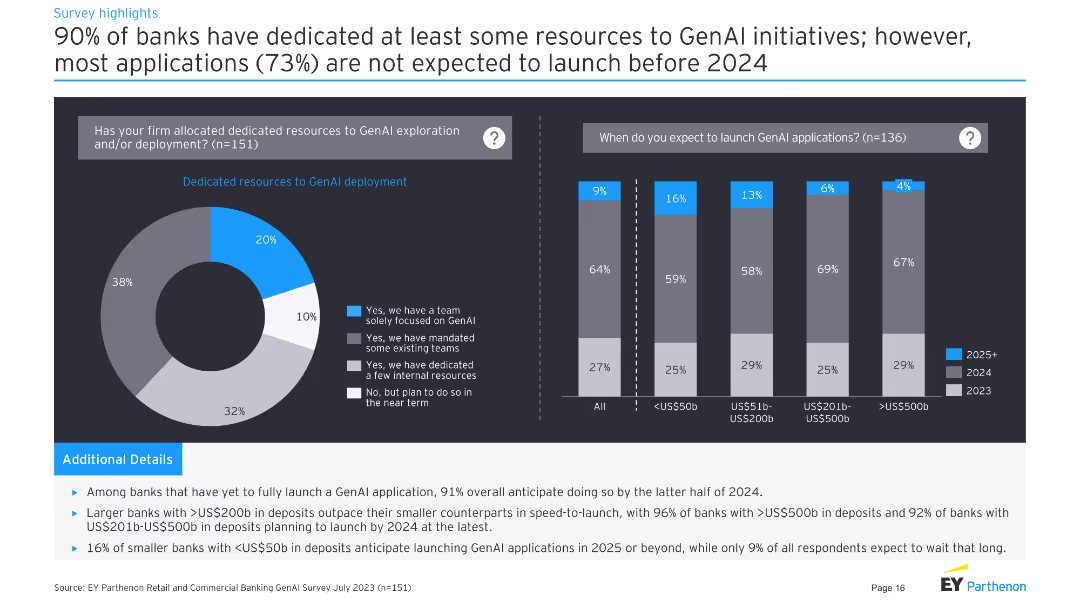
Left: pie chart on resource dedication to GenAI. Right: column chart on expected launch timelines for GenAI applications.
Strategic Planning
Financial Services
Shows that 90% of banks have dedicated resources to GenAI, with most applications not expected to launch before 2024.
resources, GenAI, deployment, launch, timeline
Multiple Chart
EY
Saved
A comparative bar chart showing stress levels among Millennials and Gen Z across various countries, with percentages and color-coded bars.
Market Analysis and Trends
Professional Services
The slide compares stress levels before and after the pandemic among Millennials and Gen Z across multiple countries, highlighting the impact of global economic changes.
Stress levels, Millennials, Gen Z, comparison, pandemic, global survey, mental health, economic impact
Multiple Chart
Deloitte
Saved
Includes icons and bullet points summarizing strategic approaches like 'Test & Learn' and 'Circular Model' for luxury brands.
Strategic Planning
Retail & E-commerce
Outlines strategic adaptations for luxury brands aiming to maintain profitability by adopting nimble and circular business models.
strategic planning, business models, luxury brands, operational efficiency, market adaptation
Pillar
Bain
Saved
The slide has a red and black theme with two column charts showcasing judicial and non-judicial FTE breakdowns, and a table comparing FTEs across family law. It contains a small amount of text to explain the graphics.
Operational Efficiency
Government & Public Sector
This slide presents the full-time equivalent (FTE) staffing breakdown in family law courts, comparing judicial and non-judicial roles, and provides insights into resource allocation and operational structure of the courts.
courts, FTE breakdown, family law, judicial staffing, operational efficiency, resource allocation, bar graph, pie charts
Multiple Chart
PwC/Strategy&
Saved
This slide displays two column charts comparing the types of podcast ads by announcer-read/pre-produced versus host-read and other ads between 2019 and 2020, showing growth in announcer-read ads.
Market Analysis and Trends
Media & Entertainment
Examines the preference shift in podcast advertising towards announcer-read/pre-produced ads, suggesting a trend towards greater control in ad messaging.
podcast ads, announcer-read, pre-produced, supplied ads, messaging control, 2019-2020
Single Chart
PwC/Strategy&
Saved
This slide features a balanced layout with text, images, and charts. It explains the concept of Climate FinTech, showcases its growth, and identifies key groups within this sector. The visual elements include a column chart and a Venn diagram.
Technology and Digital Transformation
Financial Services
The slide introduces Climate FinTech, describing its role in supporting climate change mitigation and adaptation. It highlights the growth of Climate FinTech, the main groups within the sector, and the types of digital financial products available for mitigation and adaptation.
Climate FinTech, climate change, mitigation, adaptation, digital finance
Mixed Chart
Barclays
Saved
The slide contains column chart, tables, and a bullet-pointed textual analysis. It uses shades of green for the bars and a mix of bold and standard text for emphasis.
Regulatory and Compliance
Financial Services
Displaying the escalating costs of compliance, the slide breaks down expenditures into regulatory project and routine compliance costs, alongside an analysis of historical spending trends.
Compliance, Regulatory, Cost, Analysis, Trend
Mixed Chart
Morgan Stanley
Saved
Includes a column chart under 'Multifamily New Construction by Class', with a line overlay indicating the percentage of Class A units. It's well-structured for comparison and trend analysis.
Investment Analysis
Real Estate & Construction
Analyzes the composition of new multifamily construction by unit class, offering insights into market segments and investment potential for different property types.
Construction Analysis, Class A Units, Multifamily Segment, Market Insights, Property Types, Investment Potential, Market Segmentation, Trend Analysis
Single Chart
Citigroup
Saved
The slide features two column charts comparing the impact of the Great Resignation on front and back office compensation packages. An image on the left shows professionals in a casual meeting. The charts use different shades of orange and red to display data.
Human Resources and Talent Management
Financial Services
The slide outlines how managers have increased base compensation and discretionary bonuses to address labor challenges for both front and back offices, focusing on improving compensation to retain staff.
Compensation, labor trends, Great Resignation, front office, back office
Multiple Chart
EY
Saved
Contains timelines and icons depicting hydrogen electrolysis capacity targets, infrastructure roadmaps, and targeted end-use sectors in a segmented layout.
Strategic Planning
Energy & Utilities
Discusses the Netherlands' hydrogen strategy focusing on developing infrastructure and scaling hydrogen use in various sectors by 2050, with specific targets for electrolysis capacity and transport applications.
Dutch, Hydrogen, Strategy, Infrastructure, Targets
Mixed Chart
McKinsey
Saved
Slide lists key topics from open-ended survey questions, divided into 'most excited about' and 'most concerned about' with associated icons.
Market Analysis and Trends
Financial Services
Summarizes main points of interest and concern among underwriters about the future of their industry, particularly focusing on AI and technology.
underwriting, technology, AI, excitement, concerns, future, industry insights
Boxed
Accenture
Saved
Two-column layout with column and line charts showing changes in CPI and PCE deflators from 2019-2025F.
Financial Performance
Financial Services
Discusses the challenges in reducing inflation to 2% by H2 2024, considering price sensitivity and economic factors.
inflation, CPI, PCE deflators, economic forecast, price sensitivity
Multiple Chart
EY
Saved
Contains a series of bar charts that represent the percentage of the largest Danish companies engaging with various SDGs, with color-coding corresponding to different SDG goals.
Market Analysis and Trends
Environmental Services & Sustainability
This slide reviews the SDG engagement of top Danish companies, showing high involvement in goals related to industry, innovation, and climate action, as reported in their annual sustainability reports.
SDGs, Danish companies, sustainability reporting, corporate engagement
Single Chart
McKinsey
Saved
Contains a line chart and an area chart illustrating fiscal revenue and expenditure, and the pace of central and local government bond issuance over time.
Regulatory and Compliance
Government & Public Sector
Analyzes China's fiscal policy with data on revenue, expenditure, and bond issuance, providing insights into government financial strategies and public sector funding.
Fiscal policy, China, Government, Revenue, Expenditure, Bonds, Public sector, Financial analysis, Economic data
Multiple Chart
JP Morgan
Saved
Column charts comparing OpEx, Energy, and CapEx for annual vs hourly matching in 2025 and 2030. Includes text boxes with insights on cost assumptions and learning rates.
Technology and Digital Transformation
Energy & Utilities
Column charts comparing OpEx, Energy, and CapEx for annual vs hourly matching in 2025 and 2030. Includes text boxes with insights on cost assumptions and learning rates.
This slide analyzes green hydrogen cost assumptions, focusing on the differences in costs between annual and hourly matching. It highlights key insights and future cost reductions.
Mixed Chart
BCG
Saved
The slide features an illustrative map with arrows and bubbles indicating the magnitude of cross-border data flows among different regions. A sidebar provides a color-coded key for bandwidth ranges, with larger bubbles on the map representing greater interregional bandwidth usage.
Market Analysis and Trends
Technology & Software
The slide communicates the exponential growth in cross-border data flows, emphasizing a 45x increase since 2008. The map and side key effectively showcase the regional disparities in data flow volume, providing a clear visualization of how digital connectivity is evolving globally. This serves as an indicator of international digital communication and business collaboration trends.
Data Flows, Global Connectivity, Bandwidth, Regions, Digital Communication, Business Collaboration, Growth, Telecommunications
Multiple Chart
McKinsey
Saved
This slide features a detailed hierarchical diagram outlining the planned changes to legal entities within UBS Group AG. The visual includes parent-child relationships between entities with labels.
Organizational Structure and Change
Financial Services
The slide explains the merger and restructuring of UBS Group AG's legal entities across various regions, including Switzerland, EU, UK, and the US, highlighting the simplification process.
UBS Group AG, legal entity changes, restructuring, financial services, merger
Diagram
UBS
Saved
Slide with a column chart showing revenue bridge to 2026 exit rate, with annotations explaining revenue expectations and assumptions.
Financial Performance
Financial Services
The slide illustrates UBS's revenue plans, highlighting enhanced capabilities and improved productivity leading to the 2026 exit rate.
revenue plans, enhanced capabilities, improved productivity, UBS financial performance
Single Chart
UBS
Saved
Circular icons and text describing four strategic approaches for banks to unlock value: improving existing services, expanding reach, offering non-financial products, and exploring new frontiers.
Strategic Planning
Financial Services
Outlines four key strategic initiatives for banks to enhance customer relationships and unlock potential growth opportunities.
strategic plays, banking, customer relationships, value, expansion, non-financial products, new frontiers, growth
Multiple Chart
Accenture
Saved
Previous
Next
If nothing, comes up, please save your slides first
Create a FREE account to continue browsing
Receive Instant Access to 1,000+ slides from companies like McKinsey, Google, and Goldman Sachs
First Name
Last Name
Email
Password
I agree to all
Terms & Privacy Policy
Thank you! Your submission has been received!
Oops! Something went wrong while submitting the form.
Have an account?
Sign in
Column Chart
Heatmap
Chevron
Org Chart
Infographic
Callouts
Timeline
List
Graphic
Picture
Process Flow
Diagram
Paragraph
Map
Table
Framework
Subtitle
Takeaway Box
Icon
Other Chart
Radar Chart
Waterfall Chart
Mekko Chart
Pie Chart
Scatter Plot
Line Chart
Bar chart
Bullet points