My Account
My Slides
Search by Category
Templates
Leave Feedback
Login
Logout
Get Started
Browse all Slides
Browse all Slides
Create a FREE Account
Instant access to 1,000+ real slides from top companies like McKinsey, BCG, Goldman Sachs, Google and many more!
First Name
Last Name
Email
Password
I agree to all
Terms & Privacy Policy
Thank you! Your submission has been received!
Oops! Something went wrong while submitting the form.
Have an account?
Sign in
Saved Slides
This slide includes a bar chart with horizontal bars colored in yellow showing various challenges related to green finance. The slide title and the chart caption are prominently displayed at the top.
Regulatory and Compliance
Environmental Services & Sustainability
The bar chart illustrates multiple obstacles for funding ESG initiatives, such as immature market infrastructure, high financing costs, lack of green finance professionals, and market transparency. Each challenge is quantified, indicating the percentage of respondents acknowledging these issues.
Green finance, ESG, Market challenges, Financing costs, Sustainability
Single Chart
PwC/Strategy&
Saved
Slide displays a bar chart listing top investors in Manchester tech companies, with counts of equity deals from 2011–2020, alongside descriptive text.
Investment Analysis
Technology & Software
Reviews major tech investors in Manchester, showing the number of deals each investor has completed, indicating a strong investment landscape.
Manchester, investors, tech companies, equity deals, investment trends, Mercia Asset Management, Growth Company Angels, Northern Powerhouse, business funding
Mixed Chart
Barclays
Saved
This slide includes a column chart comparing various drivers of growth in contact centers across different years, with icons representing each driver.
Market Analysis and Trends
Professional Services
The slide highlights key drivers of growth within contact centers, emphasizing customer experience and service improvement. It compares data from different years and includes insights into how companies prioritize different growth factors, such as customer expectations, business growth, and service improvement.
Customer experience, growth drivers, contact centers, column chart, service improvement
Single Chart
Deloitte
Saved
Features a comparative design with a pie chart and textual analysis side-by-side, effectively using space to discuss key global economic concerns.
Market Analysis and Trends
Financial Services
Compares business leader insights on global uncertainties and their expected impact on company performance.
economic, global shocks, uncertainty, risks
Mixed Chart
BCG
Saved
Series of column charts illustrating the EBIT trends of luxury goods brands through different economic phases from 2000 to 2017.
Financial Performance
Consumer Goods
Provides an analysis of how operating profits for luxury brands have evolved through various market conditions, emphasizing their resilience and profitability.
Profits, Luxury Goods, Financial Analysis
Single Chart
Bain
Saved
Diagram with a map of Central America and icons representing various benefits of nearshoring, such as growth in value chains and productivity.
Market Analysis and Trends
Transportation & Logistics
This slide explores the benefits of nearshoring for Central America, including promoting value chains, boosting productivity through R&D, and revitalizing the economy by developing local supply chains.
Nearshoring, Central America, benefits, productivity, economy
Diagram
Deloitte
Saved
The slide features a concentric circle chart indicating levels of EBIT uplift (<5%, <15%, <30%) and accompanying text outlining factors like new business models, platforms, and digital capabilities.
Financial Performance
Financial Services
The slide explains the impact of digital maturity on profitability, highlighting strategic measures like new business models, platforms, and value chain capabilities.
Digital Maturity, Profitability, EBIT, Business Models, Platforms, Digital Capabilities
Mixed Chart
Deloitte
Saved
The slide includes a map of Asia with annotations and percentages indicating market positions and growth. Awards and key strengths are listed on the right side.
Market Analysis and Trends
Financial Services
This slide showcases the company's strong regional footprint in Asia, highlighting market positions, growth percentages, and recent awards, emphasizing strengths in APAC IBCM and PB.
Regional Growth, APAC, Market Position, Awards, Strengths
Graphic
Credit Suisse
Saved
Includes stacked column charts and a table detailing credit losses and loan stages across different banking sectors.
Risk Assessment and Management
Financial Services
The slide focuses on credit loss provisions and the categorization of loans in different stages for various banking sectors, providing essential information for risk assessment and financial stability analysis. It is especially useful for credit analysts and financial risk managers looking at credit quality, risk exposure, and the effectiveness of credit management strategies within the banking industry.
Credit Risk, Loan Stages, Banking Sectors, Risk Management, Financial Stability
Multiple Chart
Deutsche Bank
Saved
The slide has five circular charts with percentages and descriptive text below each, set against a dark background.
Technology and Digital Transformation
Technology & Software
This slide presents survey results on employee perceptions of emerging technologies, highlighting the importance of human-centered approaches for adoption.
emerging technologies, survey results, employee perception, human-centered, adoption
Single Chart
EY
Saved
A column chart showing the distribution yield per share of various real estate investment companies. The X-axis lists companies, and the Y-axis represents distribution yield percentages up to 5%.
Financial Performance
Real Estate & Construction
This slide compares the distribution yield per share across different real estate investment companies, highlighting those with the highest and lowest yields.
distribution, yield, real estate, investment, companies, comparison, financial, performance, yield percentage, analysis
Single Chart
Credit Suisse
Saved
This simple layout slide displays a three-point agenda, each with a title and sub-points, set against a backdrop of a molecular structure graphic.
Strategic Planning
Financial Services
The agenda outlines the main topics for the presentation, including an executive summary, financial and business details, and additional backup information.
Agenda, Executive Summary, Details, Backup
Agenda
Morgan Stanley
Saved
The slide has a detailed summary text on the left, with two small bar charts on the right showing IPO proceeds and activity in Q4 2022. The layout is text-heavy with supporting visuals in grey and red for data highlights.
Market Analysis and Trends
Financial Services
This slide summarizes the record IPO activity in the MENA markets during Q4 2022. It highlights key IPOs, total proceeds, and changes compared to previous quarters. It includes a detailed narrative of notable IPOs and market performance, supported by visual data on proceeds and activity.
IPO, MENA markets, financial services, market trends, quarterly summary, IPO activity, proceeds, financial data, market analysis, investment
Mixed Chart
EY
Saved
The slide contains column charts showing top sellers and buyers in 2019 and 2020. It also includes two tables of transaction data.
Financial Performance
Financial Services
This slide details completed transactions in 2020 and ongoing ones in 2021, showing top sellers and buyers with financial details.
transactions, financial services, column chart, sellers, buyers
Multiple Chart
Deloitte
Saved
Column charts showing current NTM P/E vs. 10-year high, low, and average for various indices and sectors.
Investment Analysis
Financial Services
Evaluates valuation metrics, comparing current price-to-earnings ratios with historical data for different indices and sectors.
Valuation, NTM P/E, Indices, Historical Data, Investment Analysis
Mixed Chart
Morgan Stanley
Saved
Slide contains several vertical column charts, comparing different financial metrics such as Earnings Growth, P/E ratio, ROE, and Dividend Yield of the S&P 500.
Financial Performance
Financial Services
This slide is designed for financial professionals assessing short-term investment performance, with detailed comparison across key financial metrics of the S&P 500 index.
S&P 500, Financial Analysis, ROE, P/E Ratio, Dividend Yield, Earnings Growth, 1-Month Return, Column Chart
Multiple Chart
Morgan Stanley
Saved
Column charts showing ECL methodology drivers and forecast staging approach, with commentary on combination approaches and the use of transition matrices.
Risk Assessment and Management
Financial Services
Outlines the drivers behind ECL methodologies and forecast staging approaches used by banks, emphasizing a combination of regulatory and financial planning needs.
ECL, stress testing, methodology, banks, drivers, forecast, staging, approach, transition matrix, combination
Multiple Chart
EY
Saved
Column chart and line chart showing average private credit cashflow/interest expense and distressed debt & special situations dry powder over time.
Investment Analysis
Financial Services
The slide highlights the attractiveness of special situations private credit, with increasing borrower challenges and available capital for flexible solutions.
private credit, special situations, distressed debt, cashflow, interest expense, investment opportunity
Multiple Chart
Morgan Stanley
Saved
The slide is divided into three sections: a left section with general statistics, a middle section with role distributions, and a right section with jurisdiction data, represented by bar charts.
Market Analysis and Trends
Financial Services
This slide summarizes the demographics of the survey respondents, including the size of family offices, their roles, and the jurisdictions they operate in within the APAC region.
demographics, APAC, survey, roles, jurisdictions
Multiple Chart
EY
Saved
The slide includes a timeline and bullet points with text. It is moderately complex with clear visual differentiation between different years and provisions.
Regulatory and Compliance
Financial Services
The slide outlines key provisions of the SECURE 2.0 Act from 2023 to 2026 and later, emphasizing changes in retirement savings regulations.
SECURE Act, retirement, provisions, 2023, 2024, 2025, 2026
Linear Flow
UBS
Saved
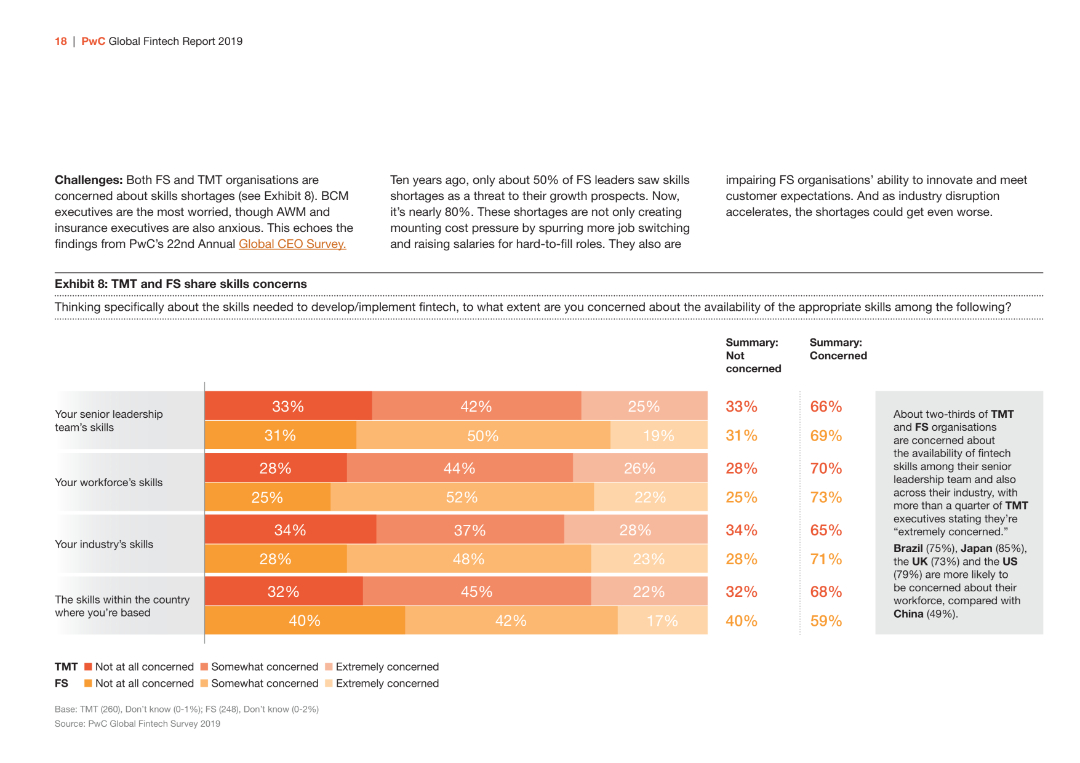
The slide features a horizontal bar chart (bar chart) showing the concerns about skills shortages among TMT and FS organizations. It uses different shades of orange and yellow to differentiate data.
Risk Assessment and Management
Financial Services
The slide discusses the skill shortages in TMT and FS organizations, highlighting concerns among senior leadership and workforce skills. It presents data on the extent of concern across various skill categories.
Skills, Shortages, TMT, FS, Leadership, Workforce
Mixed Chart
PwC/Strategy&
Saved
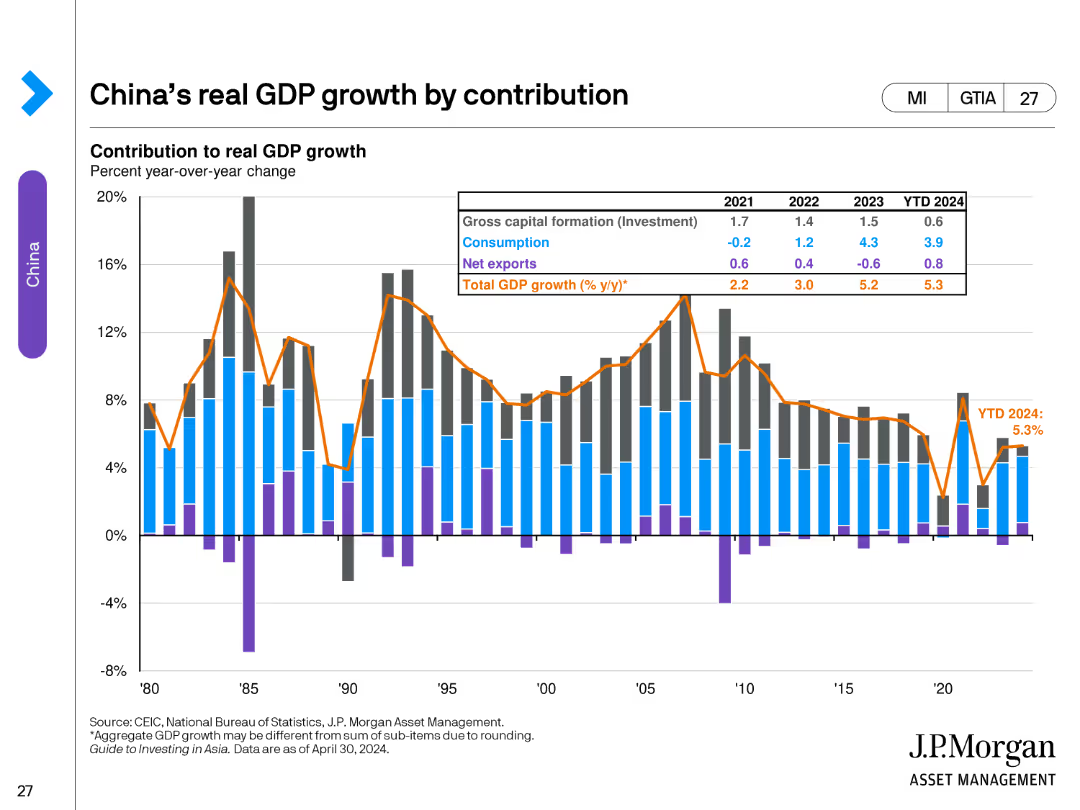
The slide contains a stacked bar chart showing the contribution to real GDP growth by gross capital formation, consumption, net exports, and total GDP growth from 1980 to 2024. A table summarizes year-over-year changes and projections for the near future.
Market Analysis and Trends
Financial Services
This slide analyzes the components of China's real GDP growth over several decades, highlighting the contributions of investment, consumption, and net exports. It provides a historical perspective and future projections of GDP growth rates.
China, GDP, growth, contribution, investment, consumption, net exports, projections, financial services, bar chart
Single Chart
JP Morgan
Saved
The slide features the Citigroup logo and mentions the event, "Investor Day," set against a blue and white background with a dotted pattern.
Corporate Finance and Valuation
Financial Services
Serves as the introductory slide for Citigroup's Investor Day presentation, setting the stage for corporate finance and valuation discussions.
Investor Day, Citigroup, Introduction, Corporate Event, Finance, Valuation, Presentation, Corporate Communication
Title
Citigroup
Saved
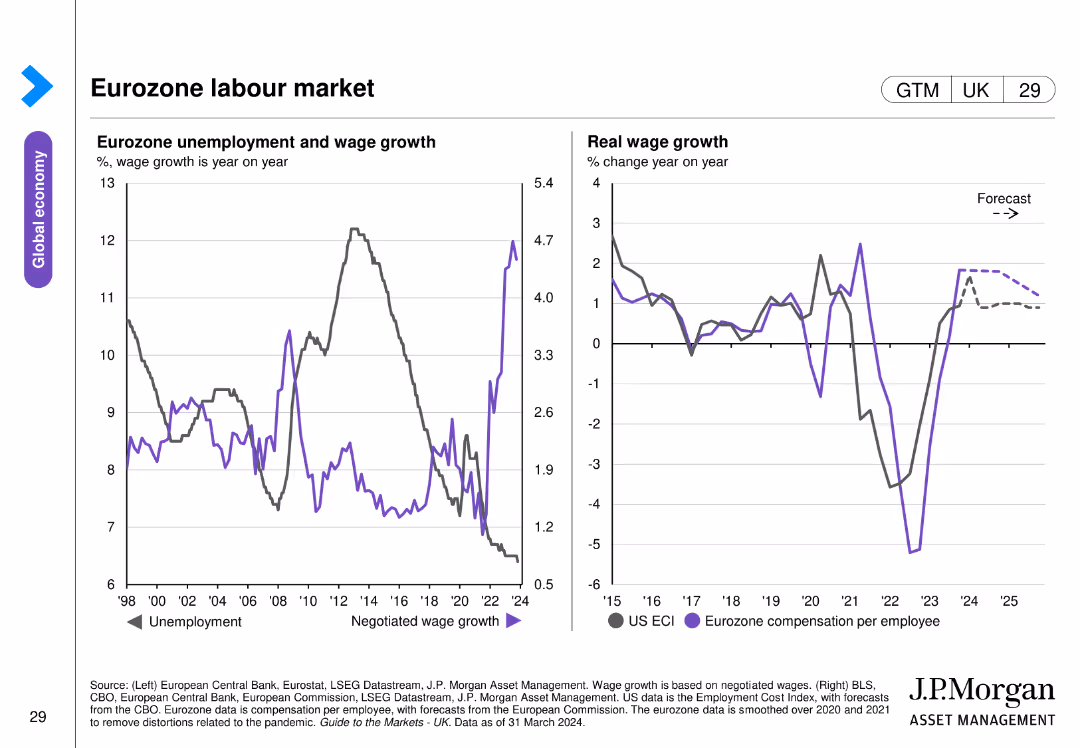
This slide includes two column charts. The left chart shows eurozone unemployment and wage growth rates over time. The right chart presents real wage growth trends for the US and Eurozone. The data is clearly segmented and color-coded.
Market Analysis and Trends
Financial Services
The slide provides insights into the Eurozone labor market, focusing on unemployment, wage growth, and real wage trends, essential for labor market analysis.
eurozone, labor market, unemployment, wage growth, real wages
Multiple Chart
JP Morgan
Saved
Pie chart showing the percentage distribution of net sales in emerging markets with an additional focus on market positions for various products in Latin America and Asia.
Market Analysis and Trends
Consumer Goods
Details Essity's market positioning in emerging markets, highlighting sales figures and leading product categories, valuable for strategic planning and competitive analysis.
Emerging Markets, Market Positioning, Sales Figures, Strategic Planning
Mixed Chart
Barclays
Saved
Previous
Next
If nothing, comes up, please save your slides first
Create a FREE account to continue browsing
Receive Instant Access to 1,000+ slides from companies like McKinsey, Google, and Goldman Sachs
First Name
Last Name
Email
Password
I agree to all
Terms & Privacy Policy
Thank you! Your submission has been received!
Oops! Something went wrong while submitting the form.
Have an account?
Sign in
Column Chart
Heatmap
Chevron
Org Chart
Infographic
Callouts
Timeline
List
Graphic
Picture
Process Flow
Diagram
Paragraph
Map
Table
Framework
Subtitle
Takeaway Box
Icon
Other Chart
Radar Chart
Waterfall Chart
Mekko Chart
Pie Chart
Scatter Plot
Line Chart
Bar chart
Bullet points