My Account
My Slides
Search by Category
Templates
Leave Feedback
Login
Logout
Get Started
Browse all Slides
Browse all Slides
Create a FREE Account
Instant access to 1,000+ real slides from top companies like McKinsey, BCG, Goldman Sachs, Google and many more!
First Name
Last Name
Email
Password
I agree to all
Terms & Privacy Policy
Thank you! Your submission has been received!
Oops! Something went wrong while submitting the form.
Have an account?
Sign in
Saved Slides
Column charts, text, and image of a woman with headphones. Data on exclusion, flexibility, mental health, and caregiving in hybrid vs. remote environments.
Human Resources and Talent Management
Professional Services
Discusses the exclusion and lack of flexibility for women in hybrid work environments and its impact on their mental health and stress levels.
hybrid work, flexibility, exclusion, mental health, stress, caregiving, women, support, employers
Multiple Chart
Deloitte
Saved
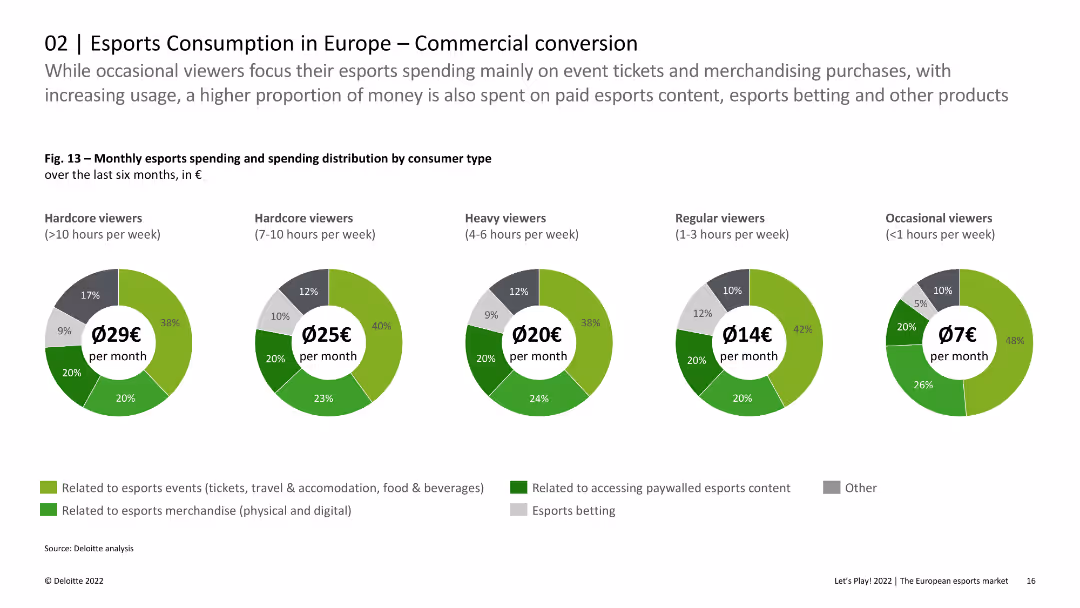
The slide includes pie charts showing monthly esports spending and spending distribution by consumer type. The visual presentation is balanced and data-rich.
Market Analysis and Trends
Media & Entertainment
This slide analyzes the spending habits of different types of esports viewers in Europe, highlighting that hardcore viewers spend more on various esports-related expenses compared to occasional viewers. It provides insights into the commercial potential of esports.
Esports, Spending, Consumer Types, Europe, Commercial
Multiple Chart
Deloitte
Saved
The slide includes bar graphs and pie charts illustrating the challenges companies face with local supplier arrangements, such as inconsistent supply and uncompetitive prices.
Risk Assessment and Management
Industrial & Manufacturing
The slide examines the challenges companies encounter with local suppliers, focusing on inconsistent supply, uncompetitive prices, and poor product quality.
local suppliers, inconsistent supply, uncompetitive prices, supply challenges, local alternatives
Mixed Chart
EY
Saved
This slide presents a combined graph and textual information. On the left, a column chart shows 'GS Group Vanilla and Preferred Stock Issuance vs. Maturities' over several years. On the right, a pie chart details '1Q20 GS Group Vanilla Issuance by Currency'. Additionally, there are bullet points summarizing key funding details.
Financial Performance
Financial Services
Offers a look into the company's funding strategy through various debt instruments and preferred stocks, useful for investors or financial analysts interested in funding diversification and debt maturity profiles.
vanilla funding, preferred stock, issuance, debt maturities, bar chart, pie chart, currency distribution, investment analysis, financial diversification, funding strategy
Multiple Chart
Goldman Sachs
Saved
Depicts a multi-category column chart with various colors representing different segments of digital financial services. Noteworthy are the substantial deal values in H1 2021 which are clearly highlighted.
Market Analysis and Trends
Financial Services
Highlights the explosive growth in digital financial services, particularly in payments and investments, with H1 2021 deal values surpassing the full year of 2020. Fintech infrastructure is presented as a significant emerging theme.
Digital Financial Services, Growth, Fintech, SEA
Mixed Chart
Bain
Saved
This slide showcases a title at the top, a vertical axis dividing the slide into two parts, with the left side listing momentum drivers such as payments and logistics, and the right side displaying icons representing emerging enablers like ESG and digital inclusion. The layout is clean with a white background and contrasting blue and green elements.
Strategic Planning
Technology & Software
The slide emphasizes the progress in momentum drivers for the digital economy and introduces new enablers emerging for the 'Digital Decade'. It could be used to discuss strategic planning in various industries, assessing the progress and planning for the integration of these enablers to enhance digital transformation initiatives and sustainable growth.
Momentum Drivers, Progress, Digital Economy, ESG, Digital Inclusion, Data Infrastructure, Sustainable Growth, Strategic Planning
Header Horizontal
Bain
Saved
Displays column charts analyzing demographic responsiveness to inclusive marketing across various industries.
Market Analysis and Trends
Professional Services
Discusses the impact of inclusive marketing on consumer perceptions and brand loyalty, focusing on diverse demographics.
marketing, inclusive, demographics, brand loyalty, advertising, consumer perception
Mixed Chart
Deloitte
Saved
A series of circular graphics and arrows guide the eye through various stages of talent development. Ample text supports the visuals, creating a moderately dense slide.
Operational Efficiency
Education & Training
This slide outlines the stages in building and managing a talent pool for the Tempest partners. It addresses workforce development strategies from school outreach to inclusive opportunities.
talent management, school outreach, apprenticeships, graduates, skills policy, inclusive opportunities, STEM, workforce development
Linear Flow
PwC/Strategy&
Saved
This slide presents a column chart that breaks down the LCOH for a PEM electrolyzer, with electricity being the largest cost component.
Market Analysis and Trends
Energy & Utilities
The slide shows the breakdown of LCOH costs for a PEM electrolyzer, emphasizing the significant impact of electricity costs on overall expenses.
LCOH, electrolyzer, PEM, electricity costs, capex
Single Chart
Kearney
Saved
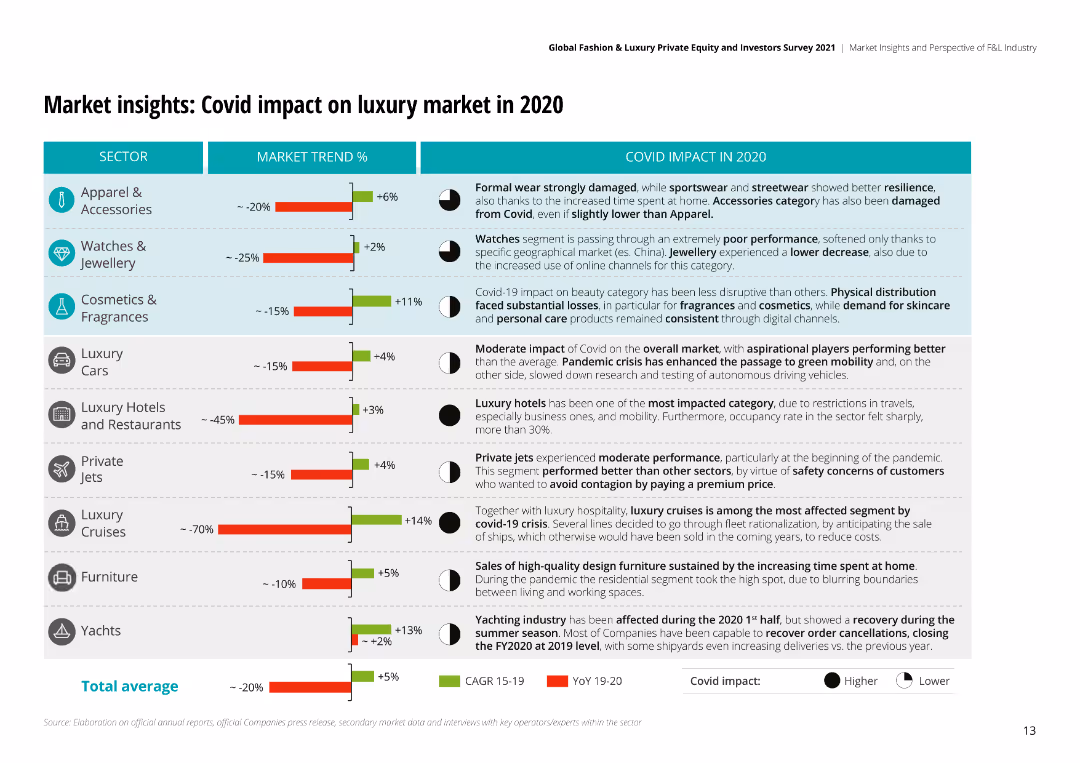
The slide uses a combination of bar charts and textual analysis to detail the impact of COVID-19 on different luxury sectors, including percentages of market trends.
Market Analysis and Trends
Retail & E-commerce
Analyzes the impact of COVID-19 on the luxury market, showing how various sectors like apparel, watches, and hotels were affected during the pandemic.
COVID-19, market impact, luxury, retail, e-commerce, apparel, watches, analysis
Mixed Chart
Deloitte
Saved
Features a central hexagon with various team effectiveness traits surrounded by related icons, a circle graph, and two small bar charts depicting related statistics.
Human Resources and Talent Management
Professional Services
Discussing top team effectiveness, this slide provides a framework for building a capable leadership team aligned with SDG goals. It underscores the importance of strategic alignment, stakeholder perspective, and interpersonal interactions to foster an effective, sustainable leadership environment.
Team Effectiveness, Leadership, SDGs, Strategic Alignment, Stakeholder Engagement
Multiple Chart
McKinsey
Saved
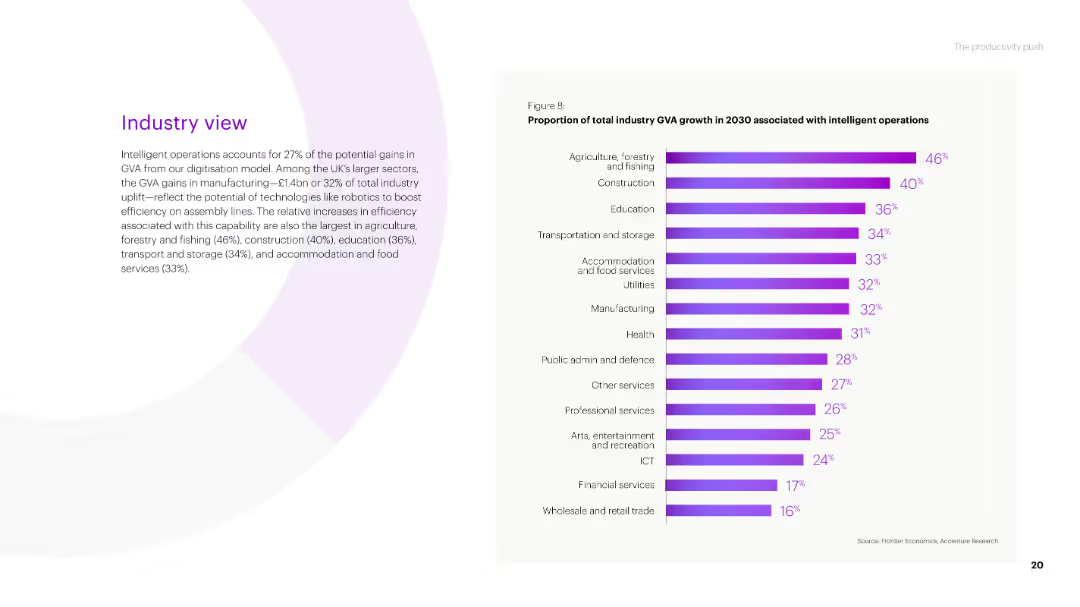
A bar chart showing the proportion of total industry GVA growth in 2030 associated with intelligent operations across various industries, with percentages indicated for each industry.
Market Analysis and Trends
Technology & Software
The slide focuses on the impact of intelligent operations on industry GVA growth by 2030, with significant contributions from sectors like agriculture, construction, and education.
industry GVA, intelligent operations, growth, agriculture, construction, education
Mixed Chart
Accenture
Saved
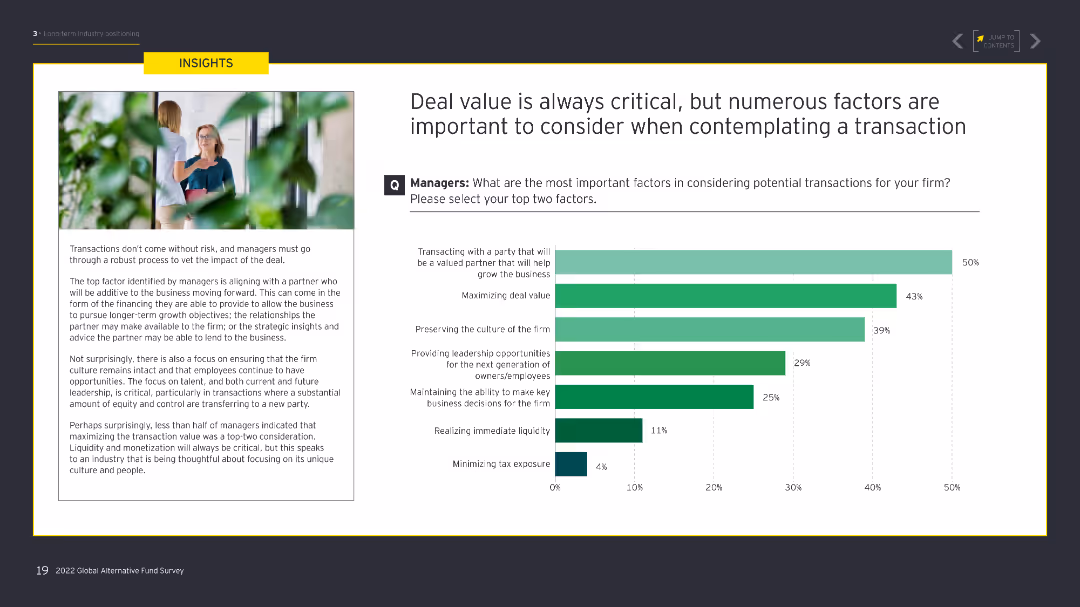
The slide contains a text box on the left about transaction factors, with a column chart on the right illustrating the most important factors for managers when considering potential transactions.
Mergers and Acquisitions
Financial Services
This slide examines the key factors managers consider when evaluating potential transactions, emphasizing the importance of deal value and other critical elements.
deal value, transactions, managers, factors, evaluation
Mixed Chart
EY
Saved
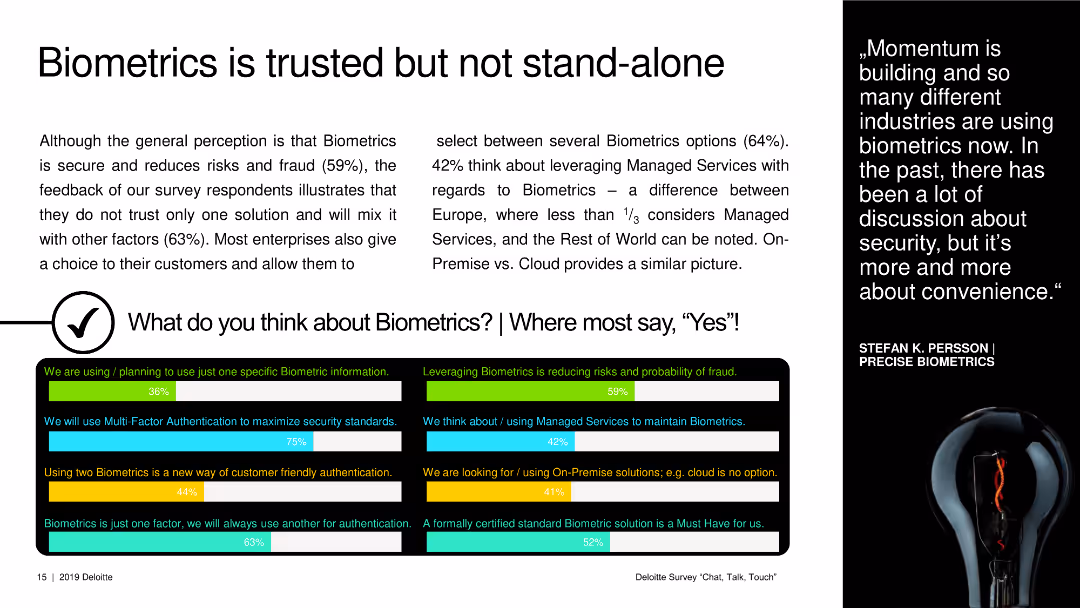
A text slide with small graphical icons and a black box showing survey results on biometric usage and opinions.
Strategic Planning
Technology & Software
This slide discusses the perception and usage of biometrics, highlighting its role in security and customer authentication preferences.
biometrics, security, customer authentication, survey results, technology adoption
Multiple Chart
Deloitte
Saved
This slide features timelines and a pie chart depicting the interest in Copernicus services by sector. It’s organized clearly with separated sections for textual and visual information.
Market Analysis and Trends
Environmental Services & Sustainability
Highlights the operational phases of Copernicus services and the growing interest across various sectors. Useful for discussions on space data applications and service adoption across different industries.
Copernicus, service adoption, space data, industry sectors, operational phases
Mixed Chart
PwC/Strategy&
Saved
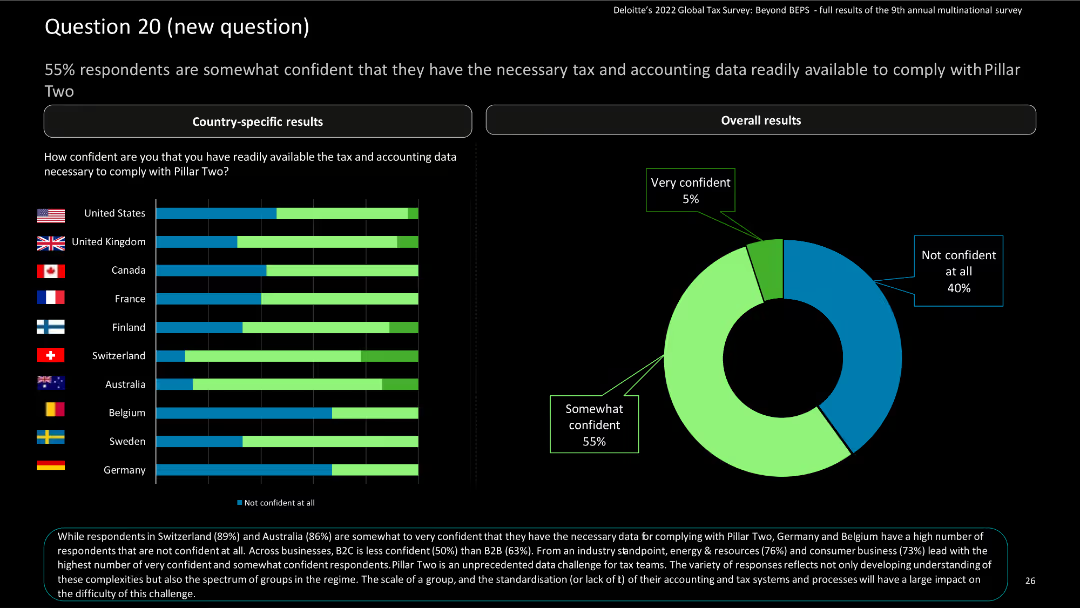
The slide contains horizontal bar charts for country-specific results and a donut chart for overall results, highlighting confidence levels.
Risk Assessment and Management
Financial Services
The slide summarizes survey findings on confidence in having the necessary tax and accounting data for complying with Pillar Two. It includes country-specific and overall responses.
Pillar Two, compliance, tax data, survey, financial services
Multiple Chart
Deloitte
Saved
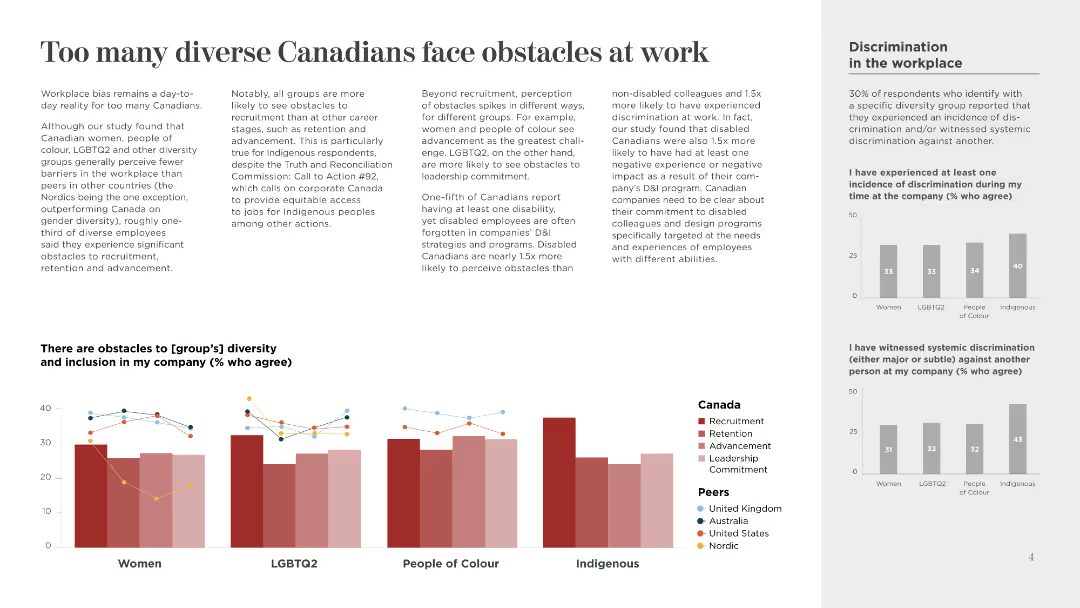
This slide features a column chart and multiple text sections. It uses a combination of light and dark text on a white background, with minimalistic icons and color-coded sections.
Human Resources and Talent Management
Government & Public Sector
The slide discusses the challenges faced by diverse groups in Canadian workplaces, highlighting recruitment, retention, and advancement obstacles. It also compares discrimination experiences.
Diversity, Discrimination, Inclusion, Workplace, Canada, Recruitment, Retention, Advancement, Leadership, Commitment
Multiple Chart
BCG
Saved
The slide features a horizontal bar chart showing the change in agreement with the statement on global brands from 2021 to 2022 in various countries.
Market Analysis and Trends
Technology & Software
The slide highlights an increase in the preference for global brands over the past year across different markets.
Global brands, market preference, survey, public opinion, brand analysis
Mixed Chart
IPSOS
Saved
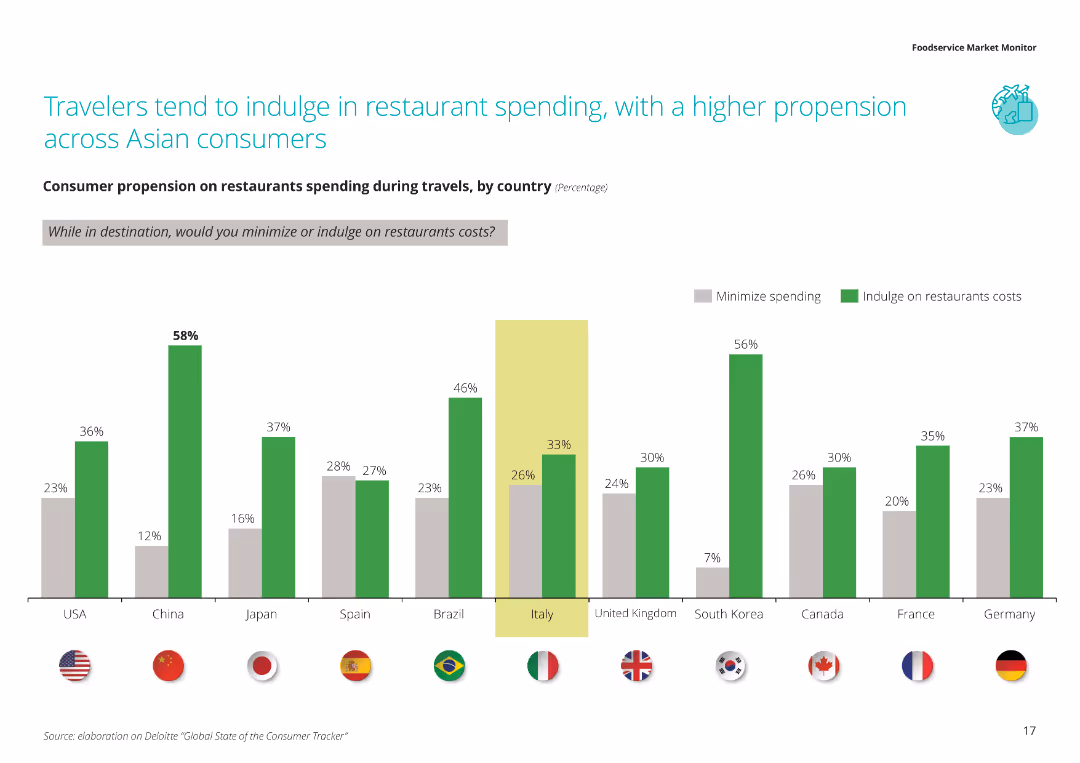
The slide shows a column chart depicting consumer propensity to minimize or indulge in restaurant spending during travels, broken down by country.
Market Analysis and Trends
Hospitality & Tourism
This slide examines consumer spending behavior in restaurants during travel, with a focus on the tendency of Asian consumers to indulge more compared to those from other regions.
Consumer spending, travel, restaurants, spending behavior, country comparison
Single Chart
Deloitte
Saved
The slide features a column chart illustrating the decrease in RWA from 2023 to 2026, with annotations on key factors like Basel III finalization and balance sheet optimization.
Risk Assessment and Management
Financial Services
This slide presents the forecasted reduction in risk-weighted assets (RWA) due to optimization and non-core and legacy (NCL) unwind, detailing the impact of Basel III finalization.
RWA, optimization, Basel III, NCL, 2026
Mixed Chart
UBS
Saved
This slide presents multiple data visualizations, including bar charts and line graphs, tracking COVID-19's impact on various factors like mobility, economic forecasts, and consumer activity from August to November. Each section uses a different color to denote the type of data being represented, like green for mobility and red for GDP.
Strategic Planning
Financial Services
Summarizes key metrics affected by COVID-19, such as global epidemic progression, mobility trends, GDP forecasts, and stock market performance. It provides a comprehensive overview of how different sectors and regions are recovering from the pandemic impacts.
COVID-19, economic impact, healthcare, GDP, mobility, stock markets
Mixed Chart
BCG
Saved
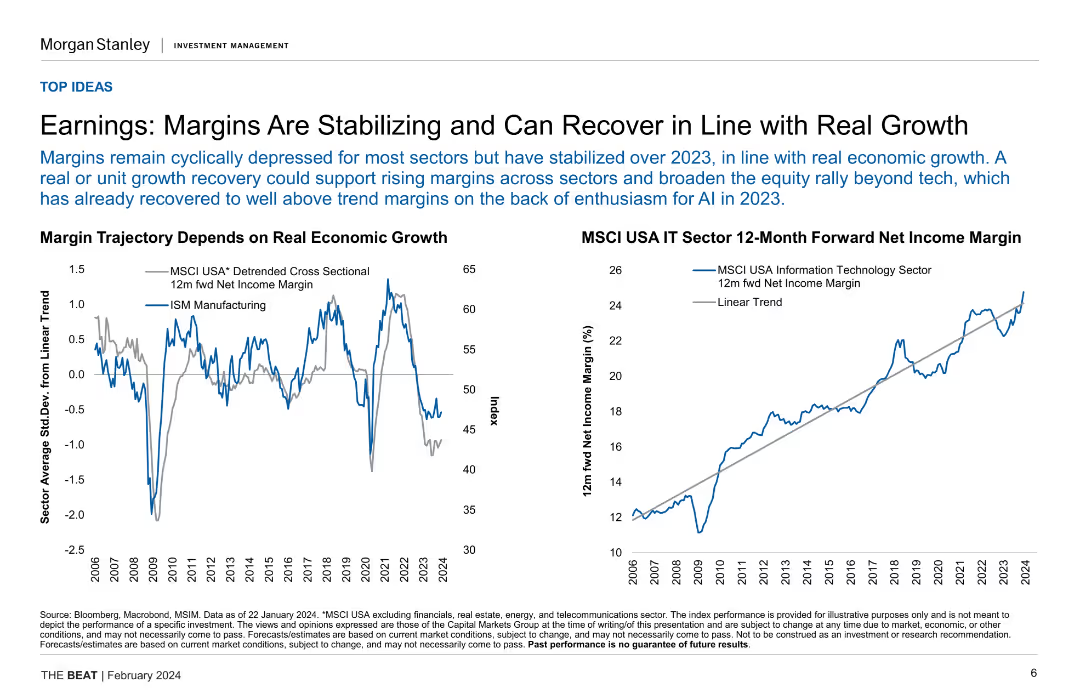
Two line charts illustrating margin trajectory based on real economic growth and MSCI USA IT sector 12-month forward net income margin.
Financial Performance
Financial Services
This slide analyzes the stabilization and potential recovery of earnings margins in relation to real economic growth, focusing on specific sector performance.
earnings, margins, economic growth, IT sector, financial performance
Multiple Chart
Morgan Stanley
Saved
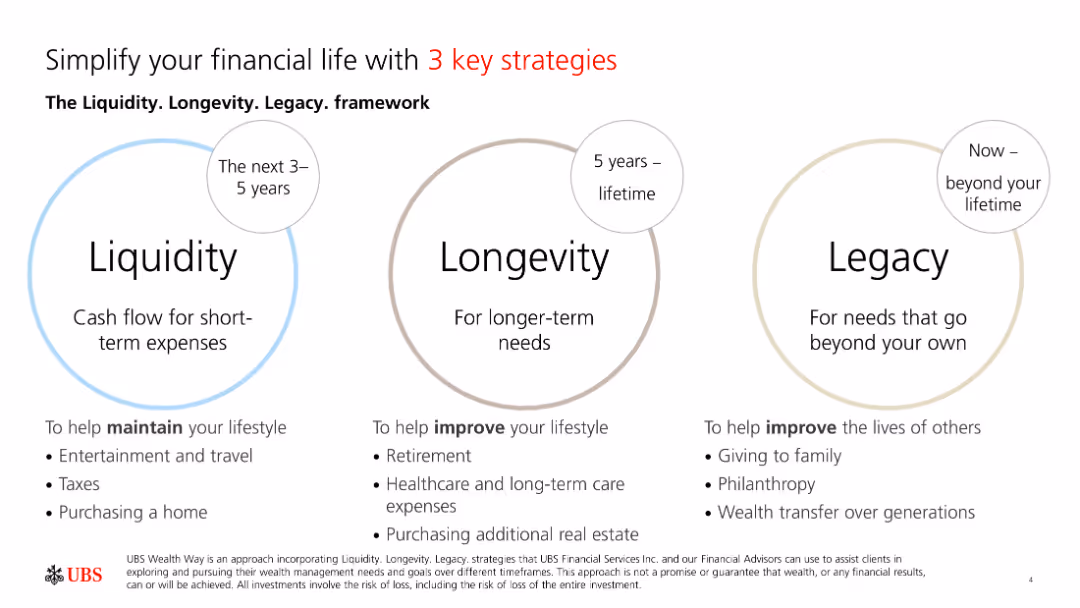
The slide contains three circular diagrams labeled Liquidity, Longevity, and Legacy, each representing different financial strategies over timeframes.
Strategic Planning
Financial Services
The slide introduces the Liquidity, Longevity, and Legacy framework, highlighting strategies for maintaining lifestyle, long-term needs, and beyond lifetime.
Liquidity, Longevity, Legacy, Strategies, Finance
Framework
UBS
Saved
Pie charts and text boxes showing key performance metrics, client coverage, and strategic priorities.
Market Analysis and Trends
Financial Services
The slide presents P&C's market position and strategic priorities, highlighting client coverage and financial performance metrics.
P&C, market position, client coverage, strategic priorities, financial performance
Multiple Chart
UBS
Saved
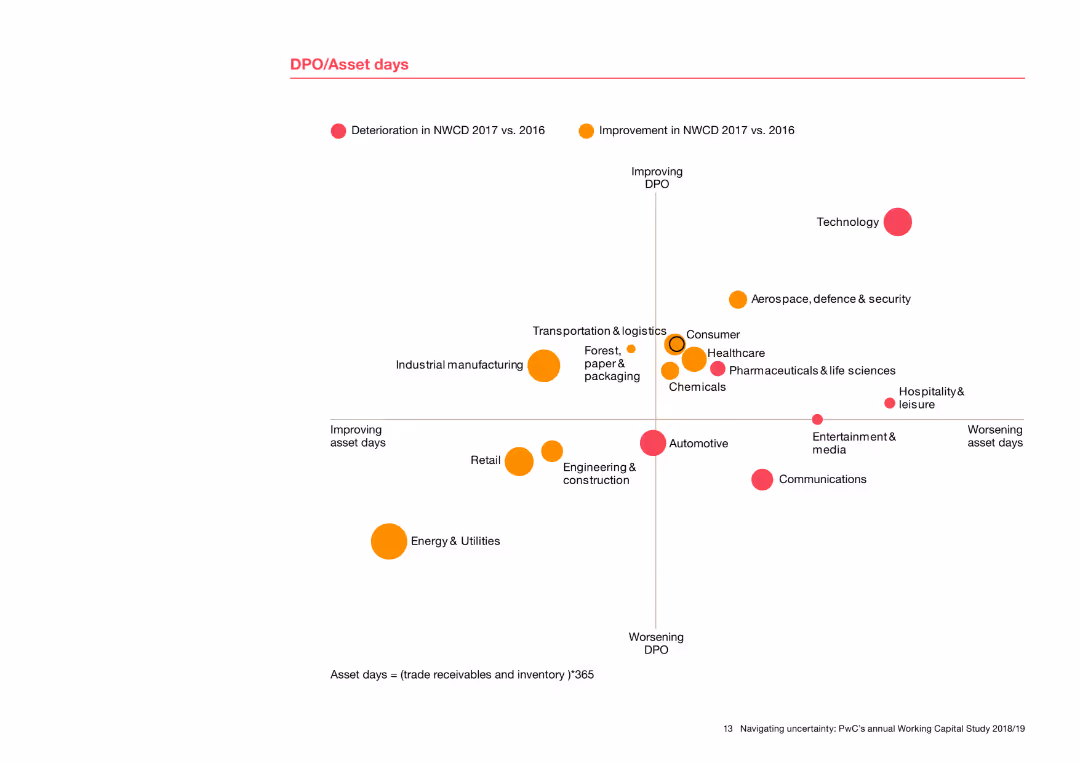
The slide includes a scatter plot showing DPO (Days Payable Outstanding) against asset days for various industries. Dots are color-coded to indicate improvement or deterioration from 2016 to 2017. Industries are labeled around the dots, providing a clear comparison of performance.
Risk Assessment and Management
Financial Services
This slide presents a detailed analysis of DPO and asset days across industries, showing trends in payables and asset management. The scatter plot visualizes how different sectors have improved or worsened in these metrics, offering insights into risk management and operational efficiency.
DPO, asset days, scatter plot, industry comparison, performance trends, risk management
Single Chart
PwC/Strategy&
Saved
Previous
Next
If nothing, comes up, please save your slides first
Create a FREE account to continue browsing
Receive Instant Access to 1,000+ slides from companies like McKinsey, Google, and Goldman Sachs
First Name
Last Name
Email
Password
I agree to all
Terms & Privacy Policy
Thank you! Your submission has been received!
Oops! Something went wrong while submitting the form.
Have an account?
Sign in
Column Chart
Heatmap
Chevron
Org Chart
Infographic
Callouts
Timeline
List
Graphic
Picture
Process Flow
Diagram
Paragraph
Map
Table
Framework
Subtitle
Takeaway Box
Icon
Other Chart
Radar Chart
Waterfall Chart
Mekko Chart
Pie Chart
Scatter Plot
Line Chart
Bar chart
Bullet points