My Account
My Slides
Search by Category
Templates
Leave Feedback
Login
Logout
Get Started
Browse all Slides
Browse all Slides
Create a FREE Account
Instant access to 1,000+ real slides from top companies like McKinsey, BCG, Goldman Sachs, Google and many more!
First Name
Last Name
Email
Password
I agree to all
Terms & Privacy Policy
Thank you! Your submission has been received!
Oops! Something went wrong while submitting the form.
Have an account?
Sign in
Saved Slides
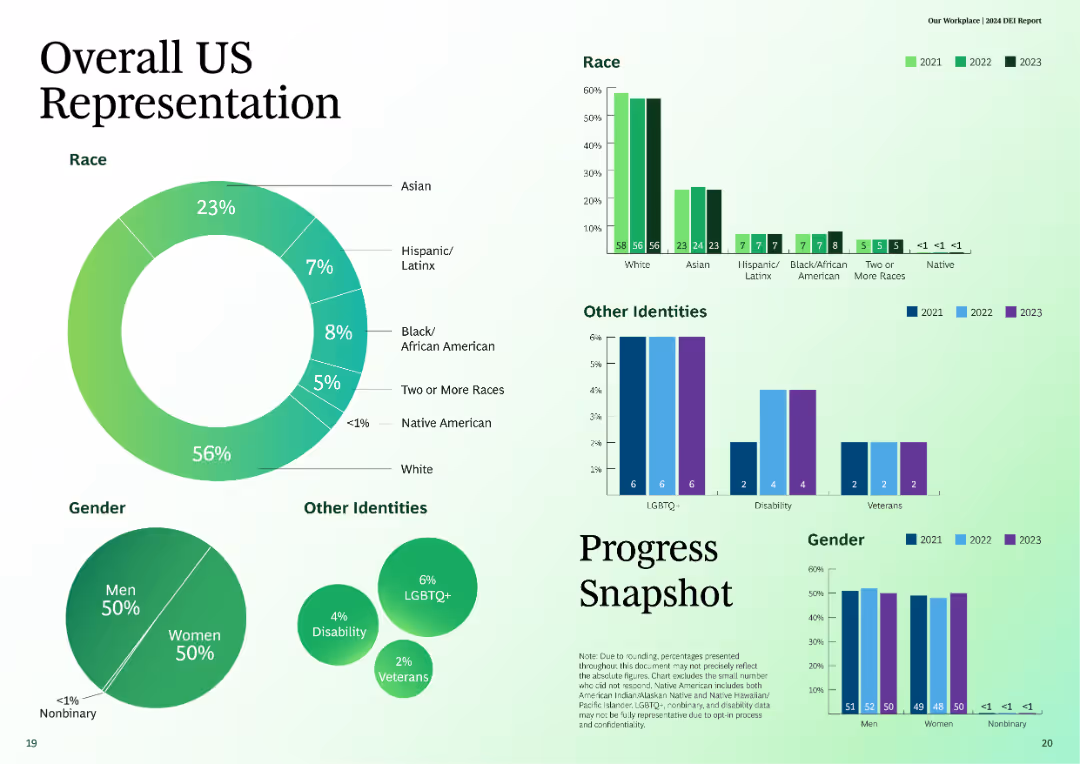
This slide features multiple charts, including a pie chart, bar charts, and column charts, displaying demographic data for race, gender, and other identities.
Customer and Market Segmentation
Professional Services
The slide presents a snapshot of overall US representation in terms of race, gender, and other identities over the years 2021, 2022, and 2023.
representation, demographics, race, gender, diversity
Multiple Chart
BCG
Saved
A bar graph comparing gross and EBITDA margins across various distribution companies, titled "Distribution businesses can have very different margin profiles."
Financial Performance
Financial Services
This data-driven slide shows the margin profiles of different distribution companies, highlighting the variability in profitability across the sector.
distribution companies, gross margin, EBITDA, profitability, financial performance, bar graph
Single Chart
EY
Saved
The slide includes images of ammonia and methanol production plants, a pie chart, and detailed text on the hydrogen market trends and sources.
Market Analysis and Trends
Energy & Utilities
The slide discusses hydrogen consumption in the chemicals industry, focusing on ammonia and methanol synthesis, market trends, and sources of hydrogen within the industry.
hydrogen, chemicals, ammonia, methanol, synthesis, market trends, case study
Mixed Chart
Kearney
Saved
The slide shows two businesswomen walking and talking on the left, with a column chart on the right illustrating investor plans to increase, decrease, or maintain target allocations in the next three years.
Investment Analysis
Financial Services
This slide explores investor plans regarding their target allocations in alternative asset classes over the next three years, showing intentions to increase, maintain, or decrease allocations.
investors, target allocations, alternative asset classes, next three years
Mixed Chart
EY
Saved
Column charts for revenues, detailed text boxes with key financials
Financial Performance
Financial Services
Results and highlights for personal banking and wealth management sectors
Personal Banking, Wealth Management, Revenue, Column Chart, Financials
Mixed Chart
Citigroup
Saved
This slide shows a line chart illustrating current and projected social media spending across various sectors.
Market Analysis and Trends
Professional Services
Discusses the stagnation and expected rise in social media investment, analyzing the sectoral distribution and future potential.
social media, spending trends, industry analysis, future projection, line graph
Mixed Chart
Deloitte
Saved
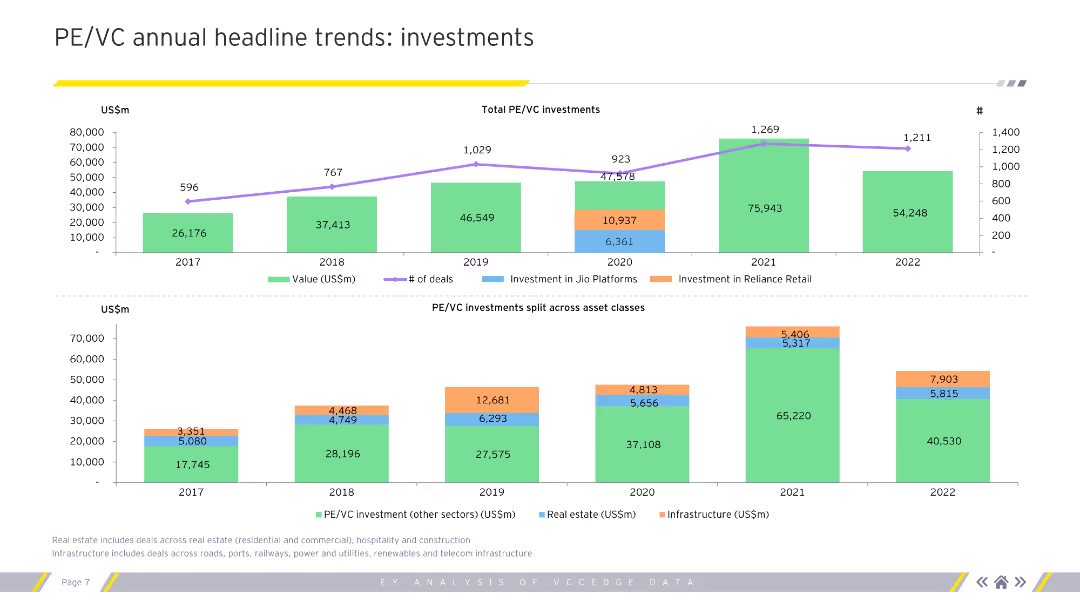
The slide contains column charts showing PE/VC investments by value, number of deals, and asset classes from 2017 to 2022.
Financial Performance
Financial Services
The slide presents PE/VC investment trends, highlighting total investments, number of deals, and asset class distribution over recent years.
PE/VC investments, investment trends, asset classes, column charts, financial performance
Multiple Chart
EY
Saved
Contains multiple column charts comparing the distribution of podcast ad lengths from 2019 to 2020, emphasizing longer ads.
Market Analysis and Trends
Media & Entertainment
Analyzes trends in podcast ad lengths, noting a significant portion exceeding 30 seconds, indicating a shift towards more detailed messaging.
podcast ads, ad lengths, detailed messaging, 2019-2020
Single Chart
PwC/Strategy&
Saved
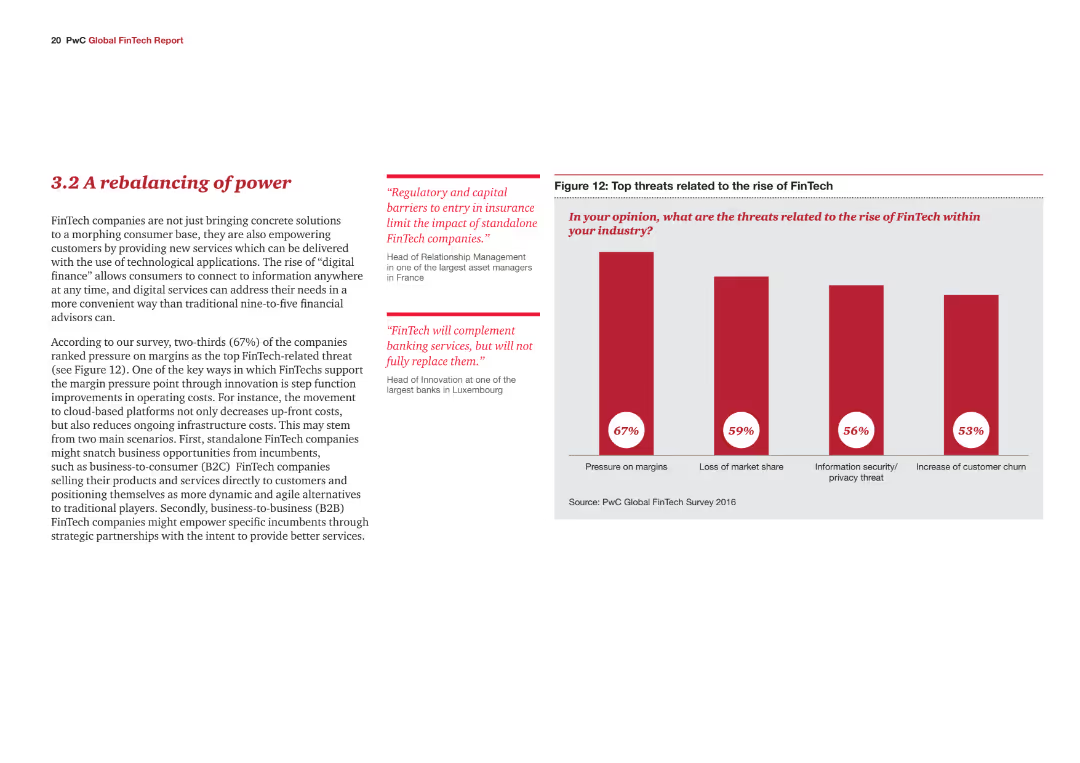
The slide contains a column chart and text. The chart outlines top opportunities related to the rise of FinTech.
Market Analysis and Trends
Financial Services
The slide highlights opportunities that FinTech presents to incumbents, such as cost reduction and improved customer retention.
FinTech, opportunities, cost reduction, customer retention, financial services
Mixed Chart
PwC/Strategy&
Saved
Line chart showing Japan's policy rate and yield curve control band. Another chart shows BOJ's holdings of government bonds and ETFs.
Market Analysis and Trends
Financial Services
Examines the Bank of Japan's monetary policy, highlighting the policy rate and bond holdings to understand its impact on the market.
Bank of Japan, monetary policy, yield curve, bonds, ETFs
Multiple Chart
JP Morgan
Saved
Features a line chart and a large, detailed column chart comparing generational focus of wealth firms currently and predictions for the next three years across different sectors. The design is data-intensive yet clearly structured for easy interpretation.
Market Analysis and Trends
Financial Services
Analyzes the anticipated wealth transfer across generations and its impact on investment strategies, with a focus on how firms plan to adapt to these demographic shifts.
generational wealth, investment focus, wealth transfer, demographic shifts, financial strategy
Multiple Chart
Deloitte
Saved
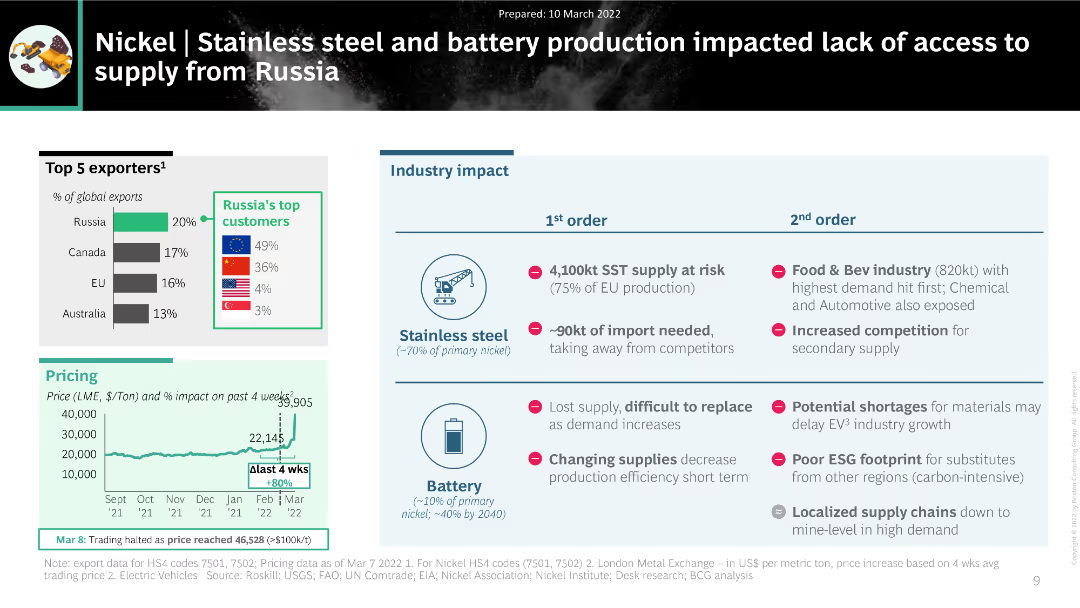
The slide features a combination of charts and tables, including a column chart showing the top exporters of nickel, a pricing trend chart, and a table summarizing the industry impact on stainless steel and battery production.
Market Analysis and Trends
Industrial & Manufacturing
The slide analyzes the impact of disrupted nickel supply from Russia on stainless steel and battery production. It includes data on top exporters, pricing trends, and the cascading effects on various industries, highlighting significant supply chain challenges.
nickel, supply disruption, stainless steel, battery production, industry impact
Multiple Chart
BCG
Saved
Orange background with percentage statistics on CEO actions: promoting diversity, moving talent, seeking talent, and using data analytics. Text discusses recruitment trends and challenges.
Human Resources and Talent Management
Professional Services
The slide details CEO strategies for attracting and retaining talent, highlighting diversity, mobility, and data analytics in talent management practices.
Talent, Recruitment, CEOs, Diversity, Mobility, Data analytics, Talent management, Strategies, Trends, Challenges
Multiple Chart
PwC/Strategy&
Saved
Contains a large column chart detailing the yearly trends in mortgage inquiries.
Market Analysis and Trends
Financial Services
Analyzes the trends in mortgage inquiries over the years, highlighting significant decreases and their implications for the market.
Mortgage, Trends, Market, Analysis, Inquiries
Single Chart
Barclays
Saved
The slide features multiple tables, bar graphs and column charts, detailing quarterly financial metrics like revenues, assets under management, and net flows. The layout is clean with clearly labeled sections and contrasting colors to distinguish different data points.
Financial Performance
Financial Services
This slide presents Q4 2023 financial results for a private banking division, highlighting revenue growth and net asset flows. It is used to analyze financial health and performance trends.
banking, financial results, revenue growth, asset management, Q4 2023
Multiple Chart
Deutsche Bank
Saved
Features a column chart with blue bars, a key in flags representing SEA countries, and a title on top.
Industry Overview
Technology & Software
Depicts the percentage of new digital consumers across different e-commerce and online media categories in SEA countries.
e-commerce, online media, SEA, digital consumers, market segmentation
Single Chart
Bain
Saved
Uses various icons and bullet points to compare aspects of JPMorgan's global operations and asset management.
Financial Performance
Financial Services
Examines the mutual benefits within different segments of JPMorgan, including client reach, technology, and community engagement.
Corporate synergy, client reach, technology, brand, marketing, community engagement, talent management
Table
JP Morgan
Saved
Features images of a digital banking interface, application components, and text descriptions on the side.
Technology and Digital Transformation
Technology & Software
Details J.P.Morgan's new product development for embedded banking, emphasizing speed and user experience.
Embedded Banking, Product Development, User Experience, J.P.Morgan, Digital Onboarding
Header Horizontal
JP Morgan
Saved
The slide features three vertical column charts comparing survey responses from 2013 and 2022 in India, Sweden, and the US.
Market Analysis and Trends
Technology & Software
The slide analyzes changes in public opinion on data privacy concerns and online privacy attitudes across different countries.
Data privacy, online privacy, public opinion, survey, trends
Multiple Chart
IPSOS
Saved
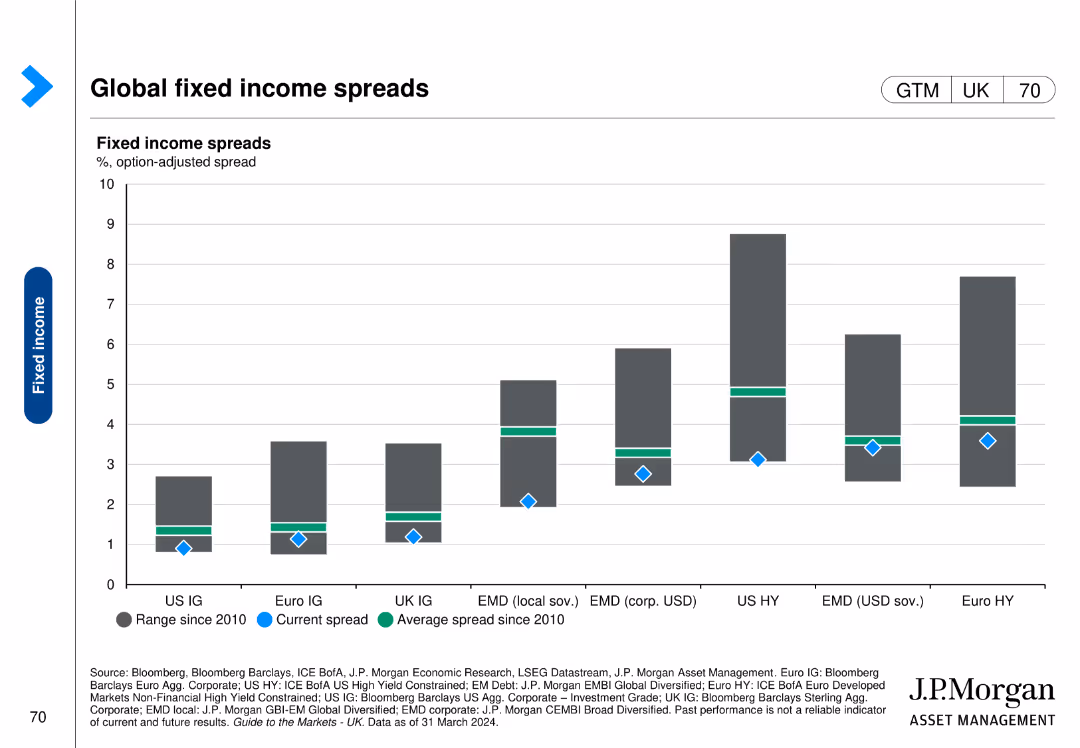
This slide features a column chart comparing fixed income spreads across various regions and asset classes, with current spread, average spread, and range since 2010 indicators.
Market Analysis and Trends
Financial Services
The slide provides an overview of global fixed income spreads, illustrating the differences and trends in spreads across regions and asset classes since 2010.
fixed income, spreads, global, regions, trends
Single Chart
JP Morgan
Saved
The slide uses a metaphorical image of a cooking setup with various ingredients laid out next to a diagram representing the organization's operating model. The image and diagram complement the textual content that outlines the structured phases of strategy development.
Strategic Planning
Professional Services
Illustrates the company's structured approach to strategic planning and innovation, represented through a culinary metaphor. This creative presentation aids in understanding the systematic phases of strategy formulation and execution, emphasizing the organization's extensive experience with numerous companies.
Strategic planning, innovation process, operational model, company experience
Vertical Flow
McKinsey
Saved
The slide presents a combination of column charts and tables, detailing the number of IPOs and proceeds across the Asia-Pacific region. It includes stock exchange data and sector breakdowns.
Market Analysis and Trends
Financial Services
The slide examines the mixed momentum in the Asia-Pacific IPO market, with a focus on the leading growth in Indonesia and Japan. It provides comprehensive data on the number of IPOs, proceeds, and top stock exchanges and sectors.
Asia-Pacific IPOs, regional growth, stock exchanges, sector analysis, financial trends
Multiple Chart
EY
Saved
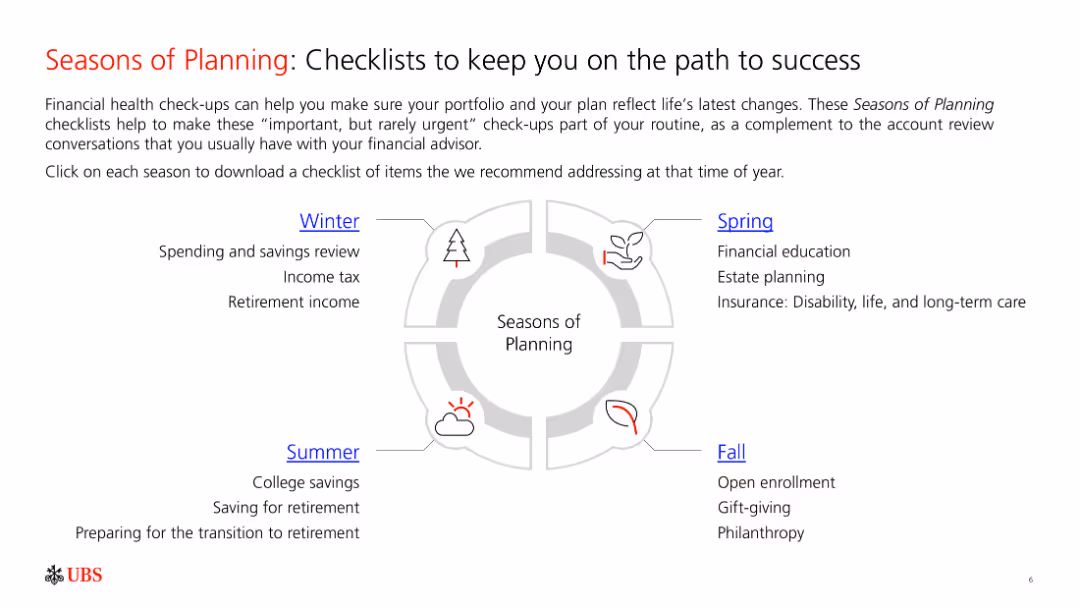
The slide includes a circular diagram representing four seasons, each with specific financial planning tasks, and text descriptions for each season.
Strategic Planning
Financial Services
The slide provides a seasonal checklist for financial planning, detailing specific tasks to address during Winter, Spring, Summer, and Fall.
Planning, Checklist, Seasons, Financial, Tasks
Diagram
UBS
Saved
Includes a table with bullet points and textual analysis detailing Australia's presence in global mining for key battery materials like lithium, cobalt, and nickel.
Competitive Landscape
Energy & Utilities
Discusses Australia's leading role and capabilities in mining essential battery materials, highlighting global market shares and reserves, and outlining upcoming projects.
Australia, mining, lithium, cobalt, nickel, market share, reserves
Table
Accenture
Saved
This slide features bar charts comparing carbon emissions across different regions using both accounting methods. The bar charts are displayed side-by-side, with clear labels and distinct color coding for consumption-based and production-based emissions.
Market Analysis and Trends
Government & Public Sector
The slide compares regional carbon emissions under production-based and consumption-based accounting methods, highlighting the differences in reported emissions. It underscores how consumption-based accounting reveals higher emissions for regions like the US and EU due to their imported goods, advocating for more comprehensive emissions tracking.
Carbon Emissions, Accounting, Regional Comparison, Consumption, Production
Multiple Chart
EY
Saved
Previous
Next
If nothing, comes up, please save your slides first
Create a FREE account to continue browsing
Receive Instant Access to 1,000+ slides from companies like McKinsey, Google, and Goldman Sachs
First Name
Last Name
Email
Password
I agree to all
Terms & Privacy Policy
Thank you! Your submission has been received!
Oops! Something went wrong while submitting the form.
Have an account?
Sign in
Column Chart
Heatmap
Chevron
Org Chart
Infographic
Callouts
Timeline
List
Graphic
Picture
Process Flow
Diagram
Paragraph
Map
Table
Framework
Subtitle
Takeaway Box
Icon
Other Chart
Radar Chart
Waterfall Chart
Mekko Chart
Pie Chart
Scatter Plot
Line Chart
Bar chart
Bullet points