My Account
My Slides
Search by Category
Templates
Leave Feedback
Login
Logout
Get Started
Browse all Slides
Browse all Slides
Create a FREE Account
Instant access to 1,000+ real slides from top companies like McKinsey, BCG, Goldman Sachs, Google and many more!
First Name
Last Name
Email
Password
I agree to all
Terms & Privacy Policy
Thank you! Your submission has been received!
Oops! Something went wrong while submitting the form.
Have an account?
Sign in
Saved Slides
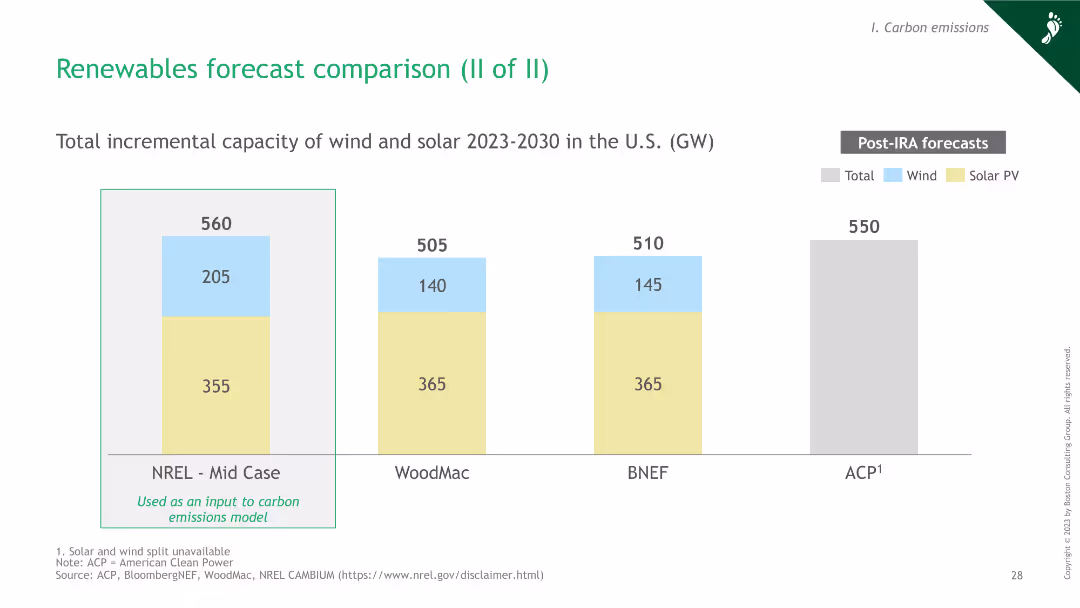
Column chart showing total incremental capacity of wind and solar in the U.S. from 2023 to 2030 by different sources. Divided into total, wind, and solar PV components.
Market Analysis and Trends
Energy & Utilities
This slide presents the forecasted incremental capacity of wind and solar in the U.S. from 2023 to 2030. It compares projections from different sources for informed decision-making.
renewables, forecast, wind, solar, capacity, U.S., incremental, 2030, trends
Single Chart
BCG
Saved
The slide displays a diagram contrasting the current and future state of AI at Morgan Stanley, with icons representing AI tools and their integration into advisor-client interactions.
Technology and Digital Transformation
Technology & Software
The slide highlights Morgan Stanley's leadership in AI, showcasing current tools like AI@MS Assistant and future state interactions to enhance advisor-client experiences.
AI, Artificial Intelligence, Morgan Stanley, Technology Integration, Advisor Tools, Client Interaction, Diagram, Innovation
Diagram
Morgan Stanley
Saved
Line chart comparing optimism about the U.S. economy over time with annotations highlighting changes influenced by COVID variants and inflation.
Market Analysis and Trends
Professional Services
Discusses trends in economic optimism among surveyed companies, influenced by external factors like COVID-19 variants and inflation, crucial for understanding market sentiment.
economy, COVID-19, inflation, market sentiment, trends
Mixed Chart
Deloitte
Saved
Two sets of column charts show Goldman Sachs M&A Fee Share by deal size and coverage rate by client size. Annotations provide additional context about client coverage and deal segmentation.
Market Analysis and Trends
Financial Services
The slide presents data on the firm's M&A fee share across different deal sizes and its client coverage rate in Americas and EMEA. It emphasizes the uniform fee share for well-covered clients across all sizes and the potential to increase fee share by expanding client coverage, showcasing strategic market positioning and client relationship management.
M&A, Fee Share, Client Coverage, Deal Size, Strategy, Market Positioning
Multiple Chart
Goldman Sachs
Saved
The slide features two column charts with and without borders, emphasizing Tufte's principle of removing unnecessary borders.
Technology and Digital Transformation
Professional Services
This slide explains how removing borders can make data presentations clearer and more effective, in line with Tufte's data-to-ink ratio principle.
Tufte, data-to-ink, ratio, survey, responses, visualization, borders, chart, clarity, design
Multiple Chart
EY
Saved
Detailed presentation with column charts showing Bitcoin metrics over years, including price projections and mining outputs.
Technology and Digital Transformation
Financial Services
Analyzes the future economic impact of Bitcoin mining, illustrating projected growth in value and reduction in new coins mined.
Bitcoin, Mining, Growth, Projection, Economy
Multiple Chart
McKinsey
Saved
The slide features a pie chart with nine segments, each numbered and labeled with different business strategies such as "Develop tech-enabled advisors" and "Recalibrate pricing and business models". The background is dark with section headers like "RESEARCH BACKGROUND" in lighter text.
Strategic Planning
Technology & Software
This slide visually presents nine strategic actions aimed at enhancing business performance and adaptation in a tech-driven market, suitable for discussions on corporate strategy in finance and tech sectors.
strategy, technology, finance, innovation, pie chart, business model, digital transformation, market adaptation, tech advisors, pricing
Vertical Flow
Deloitte
Saved
The slide features a dark background with two line charts and one column chart displaying budget deficits and total revenues/expenses over several years. Key data points are highlighted in yellow and red.
Regulatory and Compliance
Government & Public Sector
This slide presents historical and projected data on budget balance, showing actuals, estimates, and budget figures for revenues and expenses. It's used to assess financial health and planning.
budget, finance, government, revenue, expenses, deficit, projection, financial health, analysis, planning
Single Chart
PwC/Strategy&
Saved
Line graph and table detailing distributor stock performance and M&A activity, color-coded by industry segment.
Investment Analysis
Financial Services
Shows distributor stock performance against the S&P 500 and the number of acquisitions by segment since 2000.
Stock Performance, M&A, Distribution, Acquisition, Benchmark, Industry
Single Chart
EY
Saved
Pie charts displaying time allocation across various media, accompanied by an image of a person using a smartphone at a concert.
Market Analysis and Trends
Media & Entertainment
The slide discusses the distribution of consumer attention across various digital and traditional media, highlighting the dominance of mobile usage.
digital marketing, consumer attention, media time allocation, mobile usage
Multiple Chart
PwC/Strategy&
Saved
Combines textual explanations with imagery illustrating various human-AI interaction models.
Organizational Structure and Change
Professional Services
Explores the dynamic relationship between AI and human interaction, proposing models for maximizing AI utility in business settings.
Human-AI Dynamics, Organizational Change, AI Models, Business Optimization, Interaction Efficiency, Professional Services
Header Horizontal
BCG
Saved
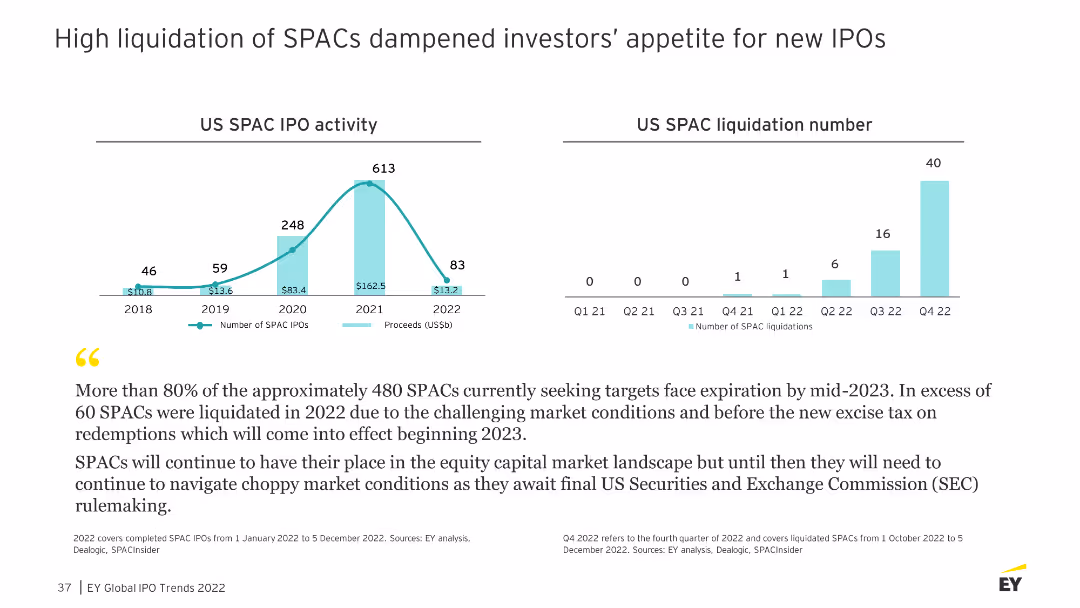
The slide presents two column charts depicting US SPAC IPO activity and SPAC liquidation numbers from 2018 to 2022, with a detailed narrative explaining the trends.
Risk Assessment and Management
Financial Services
Discusses the impact of high SPAC liquidations on investor sentiment and the challenging market conditions leading to these liquidations.
SPAC, liquidation, investor sentiment, trends
Multiple Chart
EY
Saved
This slide displays a dark blue background with one large column chart showing the progressive increase in deal values...
Investment Analysis
Financial Services
The slide provides an overview of deal values in the first half of 2021 compared to previous years, indicating a sign...
Malaysia, deal value, investments, financial analysis, H1 2021, trend, surpass, previous years
Single Chart
Bain
Saved
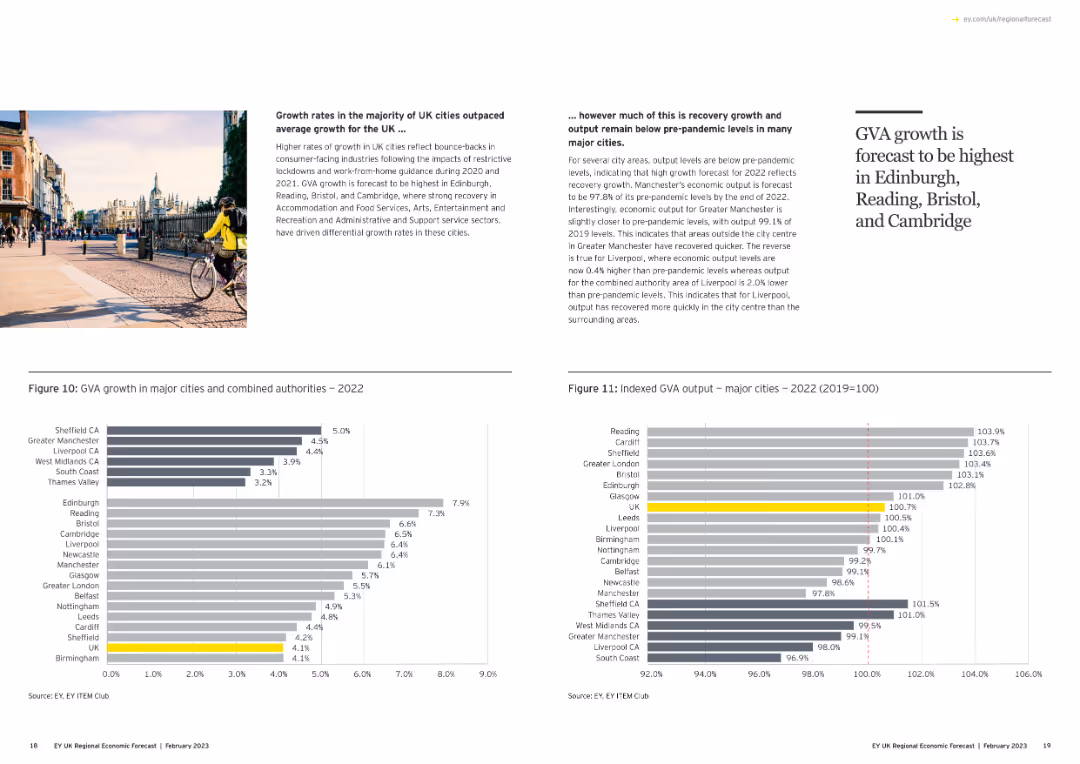
Contains two column charts: one showing GVA growth in major cities and another showing indexed GVA output for 2022.
Market Analysis and Trends
Government & Public Sector
Analyzes GVA growth rates in major UK cities, comparing recovery levels to pre-pandemic benchmarks, and highlighting leading cities.
GVA growth, major cities, recovery, pre-pandemic, column chart
Multiple Chart
EY
Saved
This slide features two bar charts: one showing the bond market size in value and as a percentage of GDP for various countries, and another showing the debt and bonds as a percentage of GDP by country, broken down by government, corporate, and household sectors.
Market Analysis and Trends
Financial Services
The slide analyzes the global debt and bond market, comparing the market sizes and debt levels across countries, and breaking down the types of debt to provide insights into the financial health and risks associated with different economies.
Global debt, bond market, market size, GDP, government debt, corporate debt, household debt, financial health, economic analysis, financial risks
Multiple Chart
JP Morgan
Saved
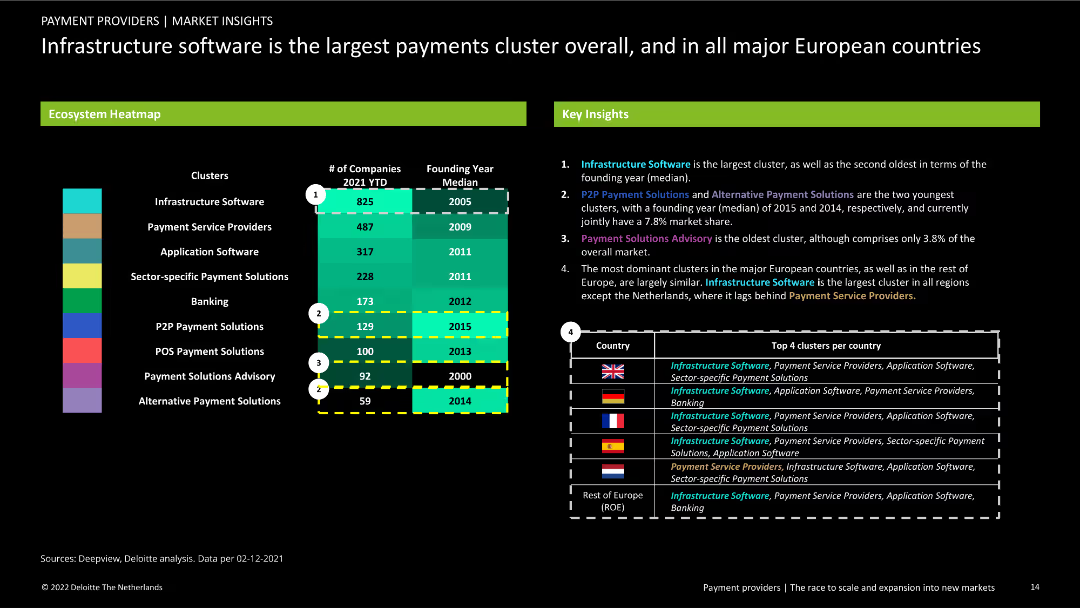
Contains a heatmap showing company clusters, founding years, and number of companies. Includes key insights and a table of top clusters by country on the right.
Market Analysis and Trends
Financial Services
Detailed view of the largest clusters in the European payments ecosystem, highlighting infrastructure software as the most dominant. Provides insights into cluster characteristics and top clusters by country.
infrastructure software, clusters, key insights, payments ecosystem, market analysis, financial services, trends, company numbers, founding years, top clusters
Header Horizontal
Deloitte
Saved
Contains a combination of line and scatter plots showing year-to-date shareholder returns by sector with variability highlighted.
Market Analysis and Trends
Financial Services
Shows year-to-date shareholder returns for various sectors, indicating performance spread within each sector and identifying sectoral winners in a downturn.
shareholder returns, sectors, performance, variability, downturn
Multiple Chart
BCG
Saved
This slide uses multiple lists and a large bar chart detailing sustainable finance volumes and targets.
Regulatory and Compliance
Environmental Services & Sustainability
Covering sustainability efforts and achievements, this slide details increased finance volumes, partnerships, and strategic sustainability initiatives. It is useful for stakeholders and regulatory bodies interested in corporate environmental responsibilities and progress towards sustainability goals, including long-term financial commitments to sustainability-linked projects and reporting on environmental, social, and governance (ESG) criteria.
Sustainability, Finance, ESG, Partnerships, Regulatory Compliance
Mixed Chart
Deutsche Bank
Saved
The slide features two pie charts and a column chart showing the growth of digital consumers in the Philippines.
Market Analysis and Trends
Technology & Software
Captures the Philippines' notable increase in digital consumers who are likely to continue using internet services post-COVID-19.
Digital consumers, Philippines, Growth, Internet services, COVID-19, Usage trends, Continuity
Multiple Chart
Bain
Saved
Slide with three column and icons related to "Ecosystem co-innovation", "Transition support", and "Regional collaboration". Includes detailed actions for regions and sectors to improve sustainability efforts.
Strategic Planning
Environmental Services & Sustainability
Expands on previous discussions about enhancing SEA's green economy at an ecosystem level, outlining specific collaborative actions and support mechanisms necessary for environmental sustainability.
ecosystem, SEA, sustainability, collaboration, innovation
Pillar
Bain
Saved
The slide displays column charts showing profit before tax and income. Text sections discuss consistent profits, recurring income, and disciplined resource management.
Financial Performance
Financial Services
This slide highlights UBS's strong and steady profits in personal and corporate banking, detailing income sources and financial performance.
Profits, UBS, Banking, Income, Resource Management
Multiple Chart
UBS
Saved
The slide features a column chart that lists and ranks the most important skill sets needed in the risk management function over the next five years, such as cybersecurity and business knowledge.
Human Resources and Talent Management
Financial Services
It identifies and ranks the critical skill sets required in risk management, emphasizing areas like cybersecurity, AI-based model risk management, and business knowledge. This information is useful for talent acquisition and training programs in risk management.
skill sets, risk management, cybersecurity, business knowledge, AI
Mixed Chart
EY
Saved
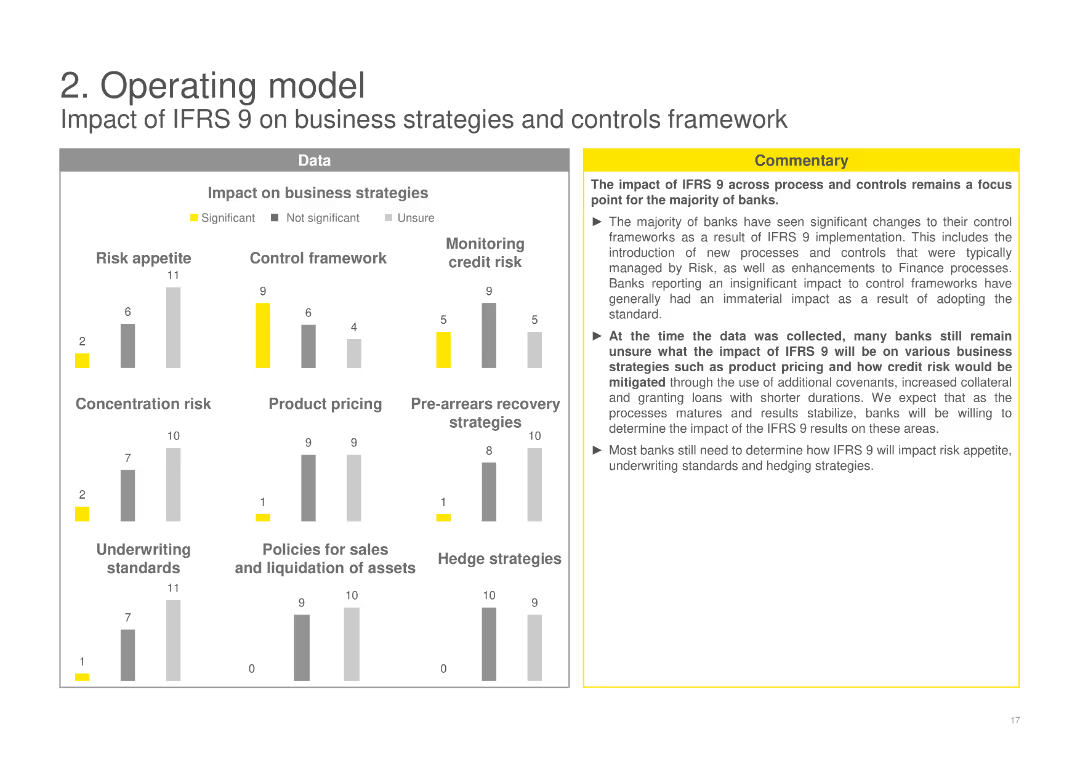
Includes column charts evaluating the impact of IFRS 9 on various business strategies like risk appetite, control framework, product pricing, and more, with a commentary box discussing overall impacts and uncertainties.
Operational Efficiency
Financial Services
Assesses the impact of IFRS 9 on different business strategies and controls framework, highlighting changes in risk appetite, control practices, and business strategies among banks post-implementation.
IFRS 9, business strategies, impact assessment, risk appetite, control framework
Multiple Chart
EY
Saved
The slide shows a scatter plot of service lines and markets for top 20 clients.
Client Case Studies
Professional Services
The slide demonstrates how large clients rely on Ipsos' cross-country and cross-sector expertise.
clients, service lines, markets, expertise, Ipsos, top 20
Single Chart
IPSOS
Saved
Column charts show the current and projected regulatory requirements, complemented by a text box describing the capital management approach.
Regulatory and Compliance
Financial Services
The slide outlines changes in regulatory capital requirements and the firm's strategy to manage capital effectively during this transition.
capital, regulatory, requirements, transition, compliance, column charts, JPMorgan
Mixed Chart
JP Morgan
Saved
Previous
Next
If nothing, comes up, please save your slides first
Create a FREE account to continue browsing
Receive Instant Access to 1,000+ slides from companies like McKinsey, Google, and Goldman Sachs
First Name
Last Name
Email
Password
I agree to all
Terms & Privacy Policy
Thank you! Your submission has been received!
Oops! Something went wrong while submitting the form.
Have an account?
Sign in
Column Chart
Heatmap
Chevron
Org Chart
Infographic
Callouts
Timeline
List
Graphic
Picture
Process Flow
Diagram
Paragraph
Map
Table
Framework
Subtitle
Takeaway Box
Icon
Other Chart
Radar Chart
Waterfall Chart
Mekko Chart
Pie Chart
Scatter Plot
Line Chart
Bar chart
Bullet points