My Account
My Slides
Search by Category
Templates
Leave Feedback
Login
Logout
Get Started
Browse all Slides
Browse all Slides
Create a FREE Account
Instant access to 1,000+ real slides from top companies like McKinsey, BCG, Goldman Sachs, Google and many more!
First Name
Last Name
Email
Password
I agree to all
Terms & Privacy Policy
Thank you! Your submission has been received!
Oops! Something went wrong while submitting the form.
Have an account?
Sign in
Saved Slides
The slide divides into two halves; one for consumer e-wallet adoption and the other for merchant adoption. It includes bullet points and icons representing consumers and merchants.
Market Analysis and Trends
Financial Services
This slide discusses the growth in e-wallet transactions spurred by consumer and merchant adoption, fostering a 'virtuous cycle'. It can be used to highlight the impact of digital platforms on e-wallet proliferation and market engagement.
e-Wallet, Consumer, Merchant, Adoption, Growth, Digital payments, Market engagement, Incentives
Header Horizontal
Bain
Saved
Column charts for industry performance, country performance, and new orders index
Market Analysis and Trends
Financial Services
This slide examines the industry performance in Europe, detailing country-specific trends and the new orders index.
Europe outlook, industry performance, country trends, new orders
Multiple Chart
Accenture
Saved
A centered diamond-shaped graphic unites four business sectors, with a blue bar graph showing a case study's results.
Competitive Landscape
Financial Services
Depicts how the firm's integrated approach across various sectors enhances its position as a market maker, demonstrated by a multiplier effect case study.
market maker, integration, business sectors, Goldman Sachs, case study, multiplier effect, competitive advantage
Single Chart
Goldman Sachs
Saved
The slide features a column chart comparing the components of delivered cost of wheat into Indonesia from different states and countries, with percentages.
Market Analysis and Trends
Transportation & Logistics
This slide presents a column chart showing the breakdown of wheat delivery costs into Indonesia, comparing Australia with other countries like Ukraine and Canada.
Wheat, Transport, Costs, Indonesia, Comparison
Single Chart
LEK
Saved
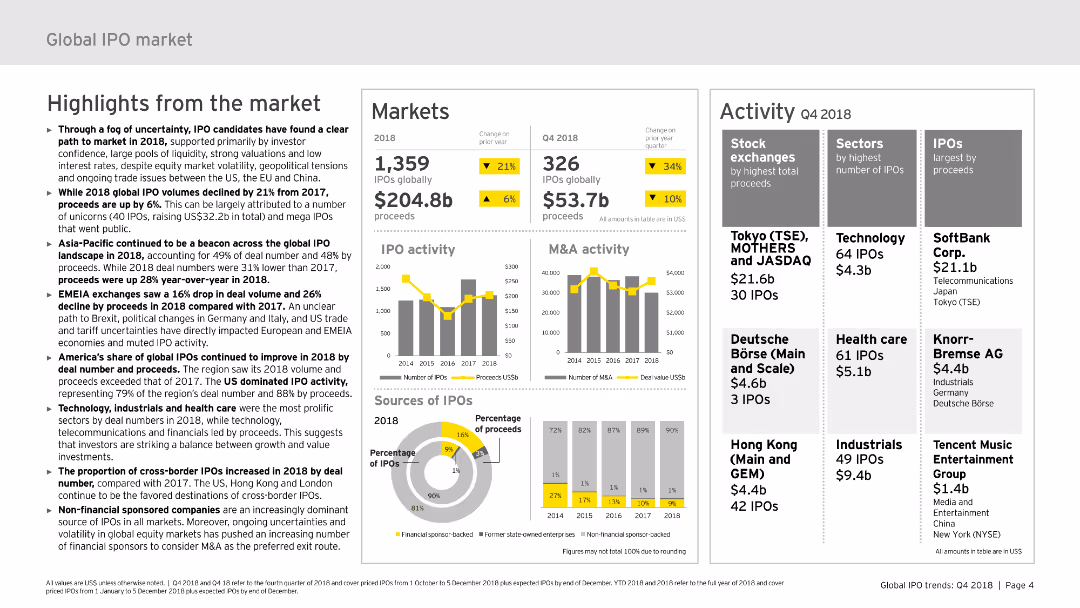
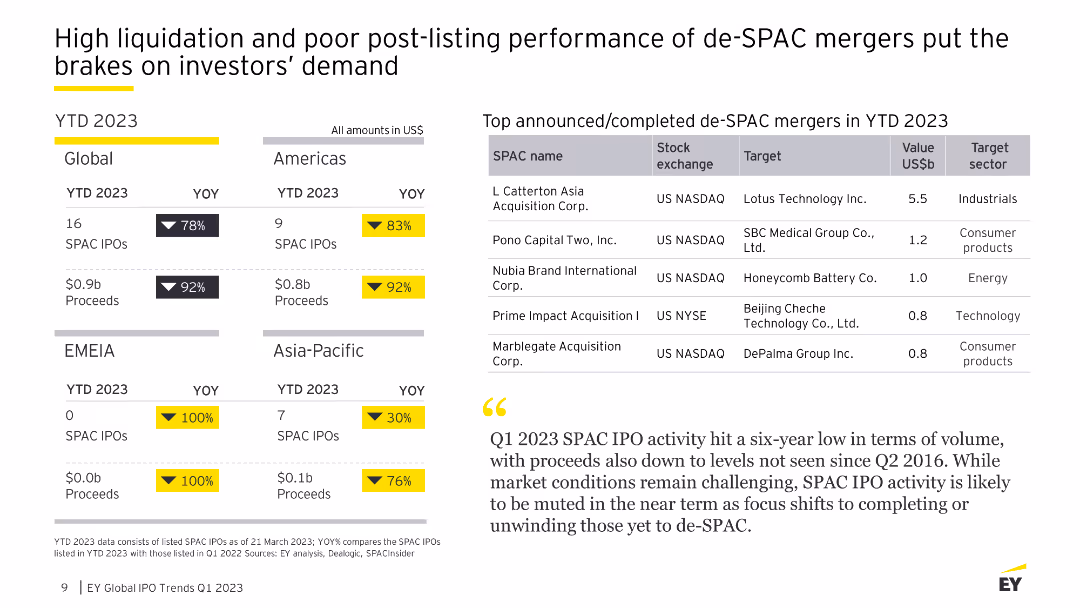
The slide includes text summaries, column charts, and pie charts presenting highlights from the global IPO market, focusing on trends and key metrics for 2018 and Q4 2018.
Market Analysis and Trends
Financial Services
This slide provides an overview of the global IPO market in 2018, discussing key trends, regional performances, and notable IPO activities across various sectors.
IPO market, 2018, trends, highlights, key metrics
Multiple Chart
EY
Saved
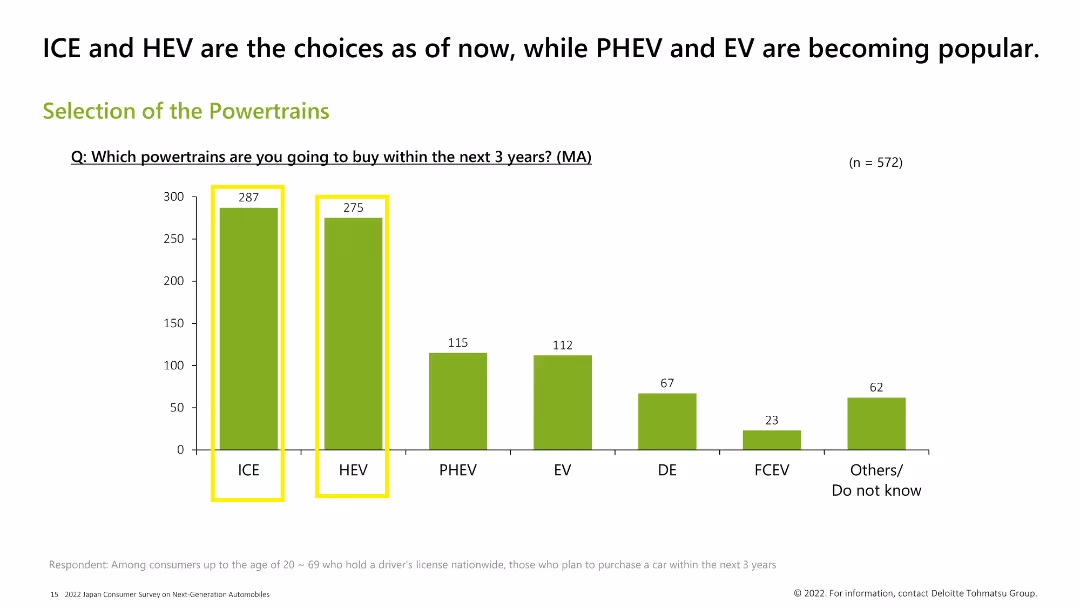
Column chart displaying preferences for different powertrain types among consumers planning to buy a car in the next 3 years. Bars for ICE and HEV are highlighted in yellow, indicating they are the most popular choices.
Market Analysis and Trends
Transportation & Logistics
This slide shows the preferred powertrain types among consumers planning to buy a car in the next 3 years. ICE and HEV are the most popular choices, followed by PHEV, EV, DE, FCEV, and others.
powertrains, ICE, HEV, consumer preference, EV, PHEV
Single Chart
Deloitte
Saved
Four blocks highlighting industry drivers of profitability in distribution: Inventory turns, Technical expertise, Fragmentation, Regulatory environment, Pricing dynamics, each with descriptive bullet points.
Market Analysis and Trends
Financial Services
The slide outlines the key profitability drivers in distribution industries, focusing on inventory, technical knowledge, market fragmentation, regulations, and pricing trends.
profitability, inventory turns, technical expertise, fragmentation, regulations, pricing dynamics, distribution
Pillar
EY
Saved
Two-column charts depicting the U.S. real GDP year-over-year changes and S&P 500 Price Index calendar year returns from 1947 to 2022.
Market Analysis and Trends
Financial Services
This slide shows the relationship between U.S. government configurations and the economy, highlighting real GDP changes and S&P 500 returns under different political scenarios.
GDP, S&P 500, stock market, government, economy
Multiple Chart
JP Morgan
Saved
The slide features comparative column charts detailing the fleet size and average age of Seadrill and its competitors. It uses a dual-axis format to display numbers of rigs and fleet age, making direct comparisons straightforward. The color palette is consistent with Seadrill's branding, and each graph is clearly labeled to ensure viewer understanding. The overall design is sleek and professional, emphasizing key data points through effective visual contrast.
Competitive Landscape
Energy & Utilities
The slide compares Seadrill's fleet size and age with those of its competitors, highlighting its position in the market. It serves as a competitive analysis tool in investor briefings or strategic meetings, arguing Seadrill's advantages in terms of a newer, more technologically advanced fleet. The presentation of this data aims to convey Seadrill's industry standing and readiness for future market demands, supporting arguments for investment or strategic shifts based on fleet composition and age.
competitive analysis, fleet size, age, Seadrill, bar graphs, market position, strategic meetings, technology, investment, industry standing
Multiple Chart
Barclays
Saved
Features four small column charts comparing capacity differences between Option 3C and the Base case across various scenarios (Central, Step Change, Fast Change, Slow Change).
Financial Performance
Energy & Utilities
Compares capacity differences between Option 3C and the Base case, providing insights into potential changes in energy production capacities across different scenarios.
Option 3C, capacity, comparison, Base case, energy, scenarios, Central, Step Change, Fast Change, Slow Change
Multiple Chart
EY
Saved
Includes a column chart with a 1.0 and 1.4 ratio, surrounded by a circular arrow diagram, and includes key performance ranks.
Performance Metrics and KPIs
Financial Services
Emphasizes the franchise collaboration model's success and its impact on generating additional revenue from clients.
Client Experience, Collaboration, Revenue Growth, IB Corporate Clients, Multiplier Effect
Single Chart
JP Morgan
Saved
Contains column charts and lists inside boxes detailing historical data and investment strategies.
Risk Assessment and Management
Financial Services
Highlights how principles of fiduciary mindset and insights contribute to navigating market events and client challenges, with growth data from pivotal market events.
Fiduciary, Market Events, Growth, Strategy
Multiple Chart
JP Morgan
Saved
Text and bar chart showing market share of top luxury goods markets in 2023.
Market Analysis and Trends
Consumer Goods
Analyzes the market share and growth projections of top markets for luxury goods, focusing on USA and China.
Luxury, Markets, Share, Projections, Growth
Mixed Chart
Kearney
Saved
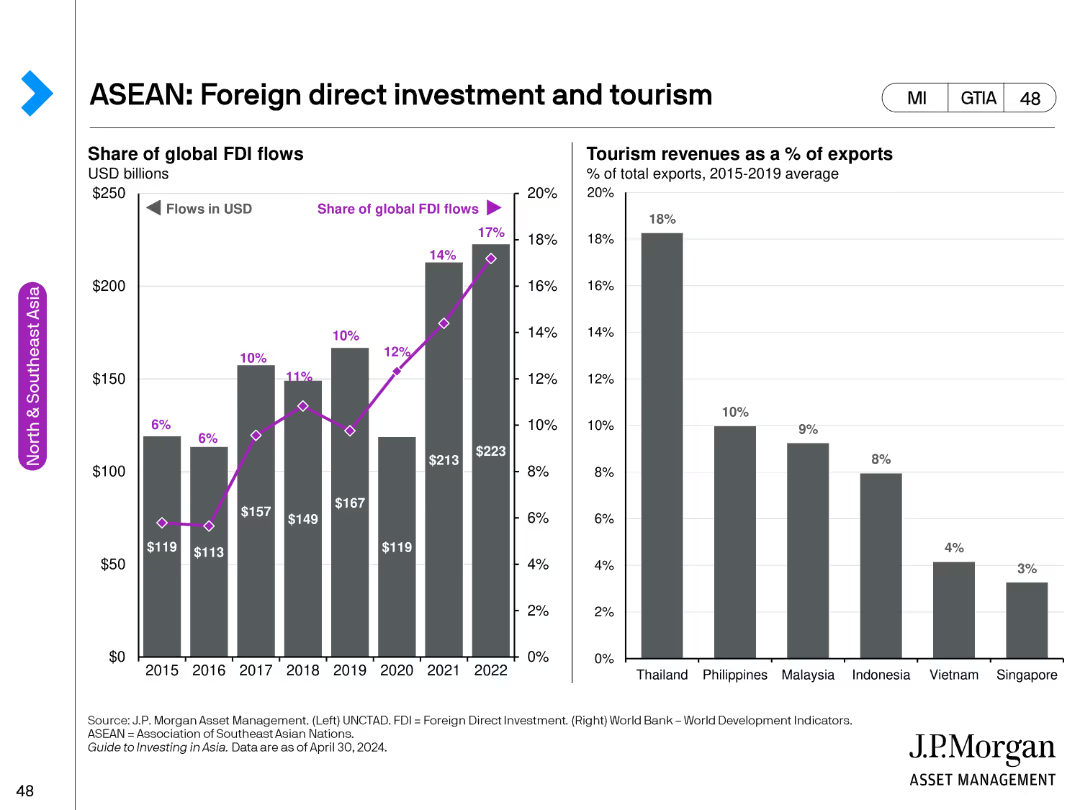
The left side of the slide features a bar chart showing the share of global FDI flows from 2015 to 2022. The right side has a bar chart depicting tourism revenues as a percentage of total exports for ASEAN countries.
Investment Analysis
Financial Services
This slide analyzes foreign direct investment trends and tourism revenues in ASEAN countries, providing insights into economic inflows and their impact on regional economies.
ASEAN, foreign direct investment, tourism, economic analysis, regional inflows
Multiple Chart
JP Morgan
Saved
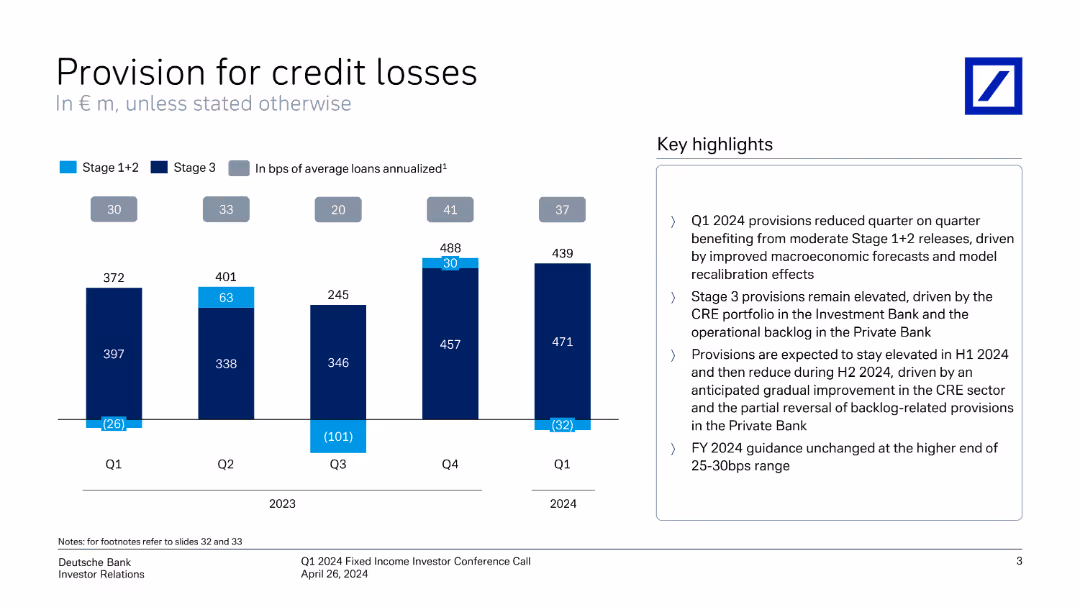
The slide features a vertical column chart displaying credit loss provisions by quarter, with detailed annotations. Additional key highlights are listed on the right.
Risk Assessment and Management
Financial Services
The slide details the provisions for credit losses across different quarters, emphasizing the impact of economic factors and forecast adjustments.
credit losses, provisions, financial health, risk management, Deutsche Bank, Q1 2024, economic forecast, quarterly performance, investor relations
Mixed Chart
Deutsche Bank
Saved
Showcases a pie chart illustrating the breakdown of a bond portfolio and column charts representing maturity breakdown of the bonds with segments labeled as up to 1 year, 1-5 years, etc.
Financial Performance
Financial Services
Provides an analysis of a bond portfolio focused on hold-to-collect debt securities, detailing their types, maturity, and fair value gap, which is essential for financial strategy and risk assessment.
bonds, securities, portfolio, maturity, finance
Multiple Chart
Deutsche Bank
Saved
Features multiple graphs including a line chart showing SPAC IPO trends and column charts for de-SPAC mergers and post-merger performance for YTD 2023.
Market Analysis and Trends
Financial Services
The slide discusses the decline in SPAC IPOs and de-SPAC mergers, highlighting high liquidation rates and poor post-merger stock performance.
SPAC IPOs, de-SPAC mergers, YTD 2023, liquidation, market trends, financial services, column charts, line chart
Table
EY
Saved
A world map with varying shades indicating case numbers, icons for trends, and data boxes.
Risk Assessment and Management
Healthcare & Pharmaceuticals
Maps the worldwide spread of COVID-19 and containment efforts, using color-coded data to indicate case numbers and trends by region.
virus spread, containment efforts, case numbers, world map
Graphic
McKinsey
Saved
The slide contrasts ground with air transportation, using a simple table format with icons. It's visually straightforward, comparing with driver/autonomous and crewed/uncrewed categories.
Market Analysis and Trends
Transportation & Logistics
Discusses the potential for disruption in transportation, comparing current and future states of passenger and goods transport both on the ground and in the air.
ground transportation, air mobility, autonomous vehicles, VTOL, hyperloop, drones
Header Horizontal
McKinsey
Saved
This content slide combines a text block discussing job impacts with two column charts. The left chart compares gray and green job changes under LCE scenarios, while the right chart shows total employment deviations from baseline over time.
Human Resources and Talent Management
Professional Services
The slide highlights the job market shifts due to the green transition, projecting job losses in fossil fuel sectors (gray jobs) and job creation in green sectors (green jobs) by 2050. It emphasizes the need for investment in eco-industries to boost employment and manage the transition smoothly.
Green Jobs, Employment, Workforce, Transition, LCE
Multiple Chart
EY
Saved
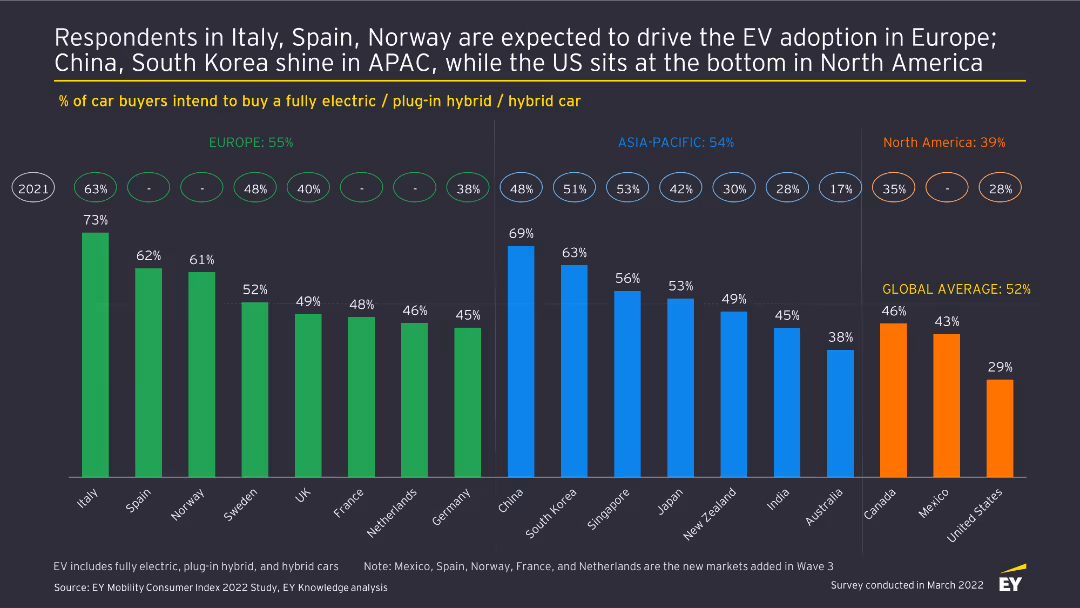
This slide features a column chart comparing the percentage of car buyers intending to buy an EV across different regions, highlighting Europe, APAC, and North America.
Market Analysis and Trends
Transportation & Logistics
The slide analyzes regional differences in EV adoption intentions based on the EY Mobility Consumer Index 2022 Study, comparing the percentage of car buyers planning to purchase an electric vehicle in Europe, APAC, and North America.
EV Adoption, Regional Comparison, Transportation, Market Analysis, 2022, Consumer Trends, Survey, Electric Vehicles, Car Buyers
Multiple Chart
EY
Saved
The slide features financial figures, including a large orange free cash flow number, a column chart for debt maturity, and text for undrawn credit lines. The layout is data-centric and clearly presented.
Financial Performance
Financial Services
The slide presents Ipsos' strong financial profile, highlighting free cash flow, low net debt, and available credit lines, emphasizing financial stability and sound management.
financial profile, cash flow, debt maturity, credit lines, stability
Mixed Chart
IPSOS
Saved
The slide includes a strategy diagram similar to slide 8017, with actions and priority-actions for improving freight location and performance data.
Strategic Planning
Transportation & Logistics
It emphasizes strategic actions for enhancing freight location and performance, focusing on data improvement and regulatory approaches.
Strategy, freight, supply chain, data, improvement, regulatory, planning, actions, priorities
Diagram
LEK
Saved
Diagrams and bullet points explain the consumer payment process, the management of funds by an eCommerce platform, and flexible payouts to merchants, alongside benefits listed at the bottom.
Operational Efficiency
Financial Services
Illustrates the end-to-end wholesale payment solutions and benefits for eCommerce platforms, emphasizing operational efficiency and treasury optimization, suitable for discussions on improving eCommerce payment systems.
eCommerce, Wholesale Payments, Treasury, Operational Efficiency, Payouts
Linear Flow
JP Morgan
Saved
A clean layout with multiple text boxes summarizing key takeaways, including advertiser objectives, channel measurement, and data challenges. Each box contains a brief summary and a small icon representing the concept.
Strategic Planning
Media & Entertainment
This slide provides key takeaways on brand awareness, measurement, and data strategies. It emphasizes the importance of leveraging multiple channels and addressing data challenges to enhance marketing effectiveness.
Takeaways, Strategy, Brand, Measurement, Data
Multiple Chart
Nielsen
Saved
Previous
Next
If nothing, comes up, please save your slides first
Create a FREE account to continue browsing
Receive Instant Access to 1,000+ slides from companies like McKinsey, Google, and Goldman Sachs
First Name
Last Name
Email
Password
I agree to all
Terms & Privacy Policy
Thank you! Your submission has been received!
Oops! Something went wrong while submitting the form.
Have an account?
Sign in
Column Chart
Heatmap
Chevron
Org Chart
Infographic
Callouts
Timeline
List
Graphic
Picture
Process Flow
Diagram
Paragraph
Map
Table
Framework
Subtitle
Takeaway Box
Icon
Other Chart
Radar Chart
Waterfall Chart
Mekko Chart
Pie Chart
Scatter Plot
Line Chart
Bar chart
Bullet points