My Account
My Slides
Search by Category
Templates
Leave Feedback
Login
Logout
Get Started
Browse all Slides
Browse all Slides
Create a FREE Account
Instant access to 1,000+ real slides from top companies like McKinsey, BCG, Goldman Sachs, Google and many more!
First Name
Last Name
Email
Password
I agree to all
Terms & Privacy Policy
Thank you! Your submission has been received!
Oops! Something went wrong while submitting the form.
Have an account?
Sign in
Saved Slides
The slide features two column charts comparing Booz Allen's total shareholder returns to core peers and broader indexes over one-, three-, and five-year periods. The bars are clearly labeled with percentages and time frames.
Investment Analysis
Financial Services
This slide highlights Booz Allen's market performance, illustrating total shareholder returns compared to core peers and broader indexes. It underscores the company's strong financial performance and effective capital management over different periods.
shareholder returns, market performance, investment, comparison
Multiple Chart
Booz Allen Hamilton
Saved
The slide features a column chart showing the ratio of direct to distributed traffic according to the Nielsen & Fletcher approach, which excludes subsequent visits. Detailed annotations explain the methodology and findings.
Market Analysis and Trends
Media & Entertainment
This slide presents the Nielsen & Fletcher approach to measuring the ratio of direct to distributed traffic, focusing on the last step before reaching news articles, excluding subsequent visits, and providing insights into traffic sources.
Nielsen & Fletcher, Direct Traffic, Distributed Traffic, Column Chart, Traffic Analysis
Single Chart
IPSOS
Saved
This slide presents a structured overview with text and icons detailing the acquisition of Global Shares and its potential impact across different business lines. The visual elements include icons, small text sections, and a diagram that maps out the integration process and expected benefits across market segments.
Market Analysis and Trends
Financial Services
Discussing the acquisition of Global Shares, the slide outlines the potential for client base growth and cross-sector integration. Useful in strategic business development sessions or discussing market expansion strategies.
global shares, acquisition, market growth, cross-sector, strategy
Header Vertical
JP Morgan
Saved
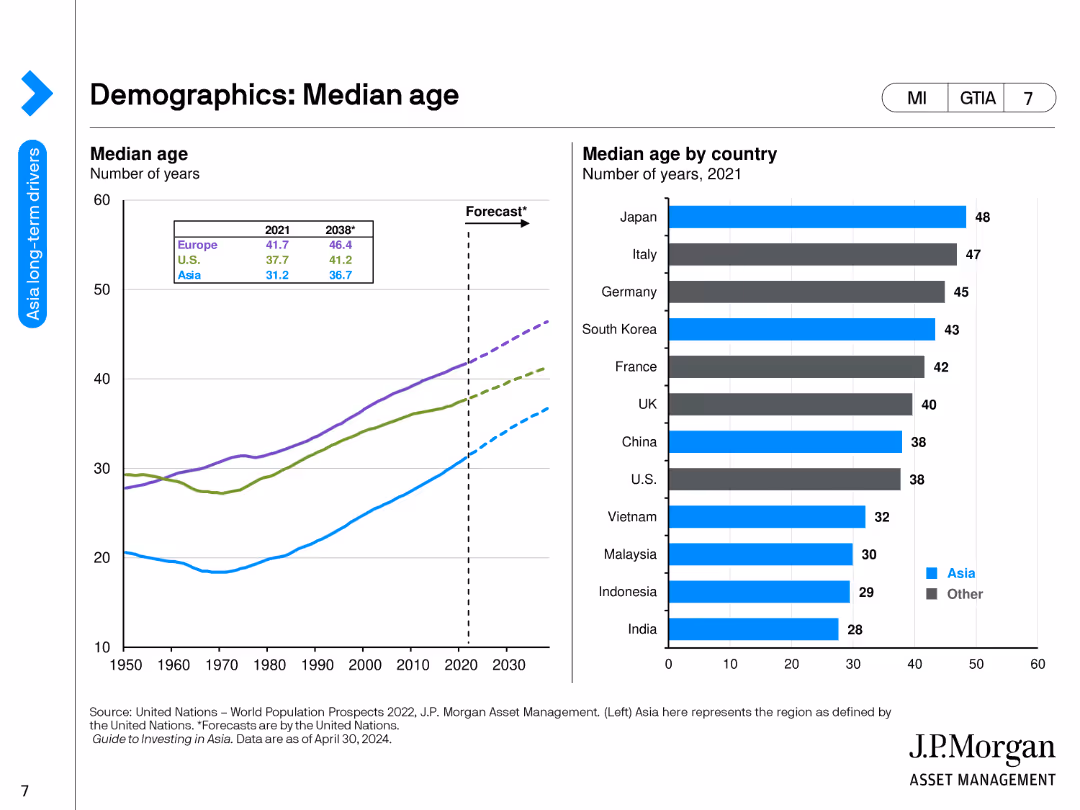
The slide contains a line chart showing the median age of various regions from 1950 to 2030, and a bar chart listing the median age by country in 2021.
Market Analysis and Trends
Financial Services
This slide provides an analysis of median age trends across different regions and countries, highlighting demographic shifts and their potential impact on economic and social structures.
Median Age, Demographics, Regions, Countries, Trends
Multiple Chart
JP Morgan
Saved
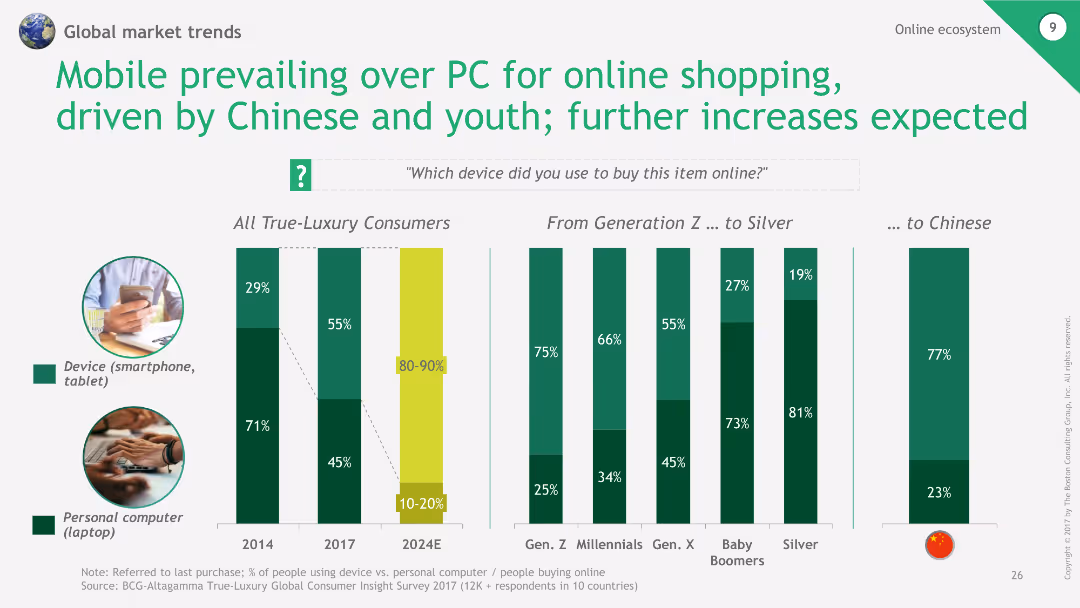
The slide presents column charts comparing device usage for online shopping among different generations and nationalities from 2014 to 2024.
Market Analysis and Trends
Retail & E-commerce
The slide highlights the shift towards mobile devices for online shopping, particularly among Chinese and younger consumers, with future growth expected.
Mobile shopping, PC, Generations, Chinese consumers, Online shopping
Multiple Chart
BCG
Saved
Slide contains two overlaid column charts comparing numbers of companies in different market capitalisation ranges between March 2023 and March 2022. Bars are color-coded in two shades of red, indicating the count for each year. Includes minimal text, primarily annotations for data values.
Market Analysis and Trends
Financial Services
This slide analyzes the spread of market capitalisation among the top 100 global companies over two consecutive years, showing growth or shrinkage in different ranges. Useful for financial analysis and investment insights.
Market Capitalisation, Financial Analysis, Global Top 100, Growth, Investment
Single Chart
PwC/Strategy&
Saved
A balance of text and graphics, showing the bank's strengths and how it aligns with J.P.Morgan's strategies, accompanied by a pie chart.
Mergers and Acquisitions
Financial Services
Slide compares the business models of First Republic Bank and J.P.Morgan, focusing on client service, credit performance, and strategic alignment. Suitable for M&A context or business model comparison.
First Republic Bank, client service, credit performance, strategic alignment, loan portfolio, high-growth markets, talent acquisition
Mixed Chart
JP Morgan
Saved
Column charts showing RWA, LRD, CET1 capital ratio, and total loss absorbing capacity
Risk Assessment and Management
Financial Services
Highlights actions taken to reinforce balance sheet strength and maintain capital ratios
balance, sheet, capital, reinforcement
Multiple Chart
UBS
Saved
Contains column charts comparing statutory RoTE across different bank divisions over several years.
Financial Performance
Financial Services
Demonstrates how different bank divisions contribute to overall growth and performance, emphasizing improvements and future targets.
RoTE, performance, divisions, growth, targets
Multiple Chart
Barclays
Saved
A comparative bar chart showing top concerns among Millennials and Gen Z before and after the pandemic, with categories like climate change and health care.
Market Analysis and Trends
Professional Services
This slide compares the primary concerns of Millennials and Gen Z before and after the pandemic, focusing on issues like climate change and health care.
World challenges, pandemic, Millennials, Gen Z, concerns, climate change, health care, comparison, global issues
Multiple Chart
Deloitte
Saved
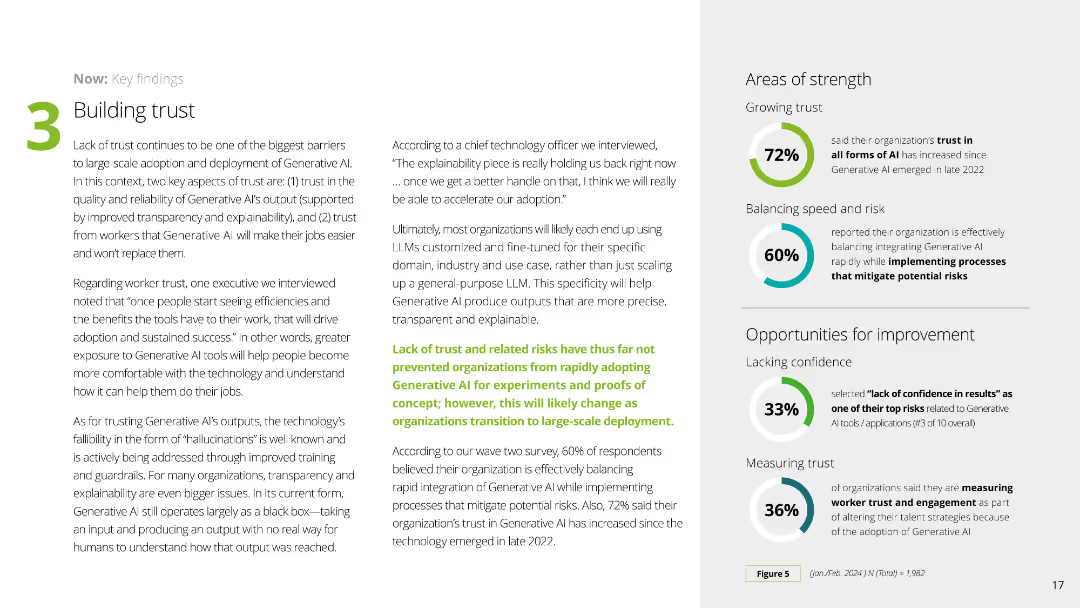
This slide contains a mix of text and percentage graphics to discuss the importance of building trust in Generative AI. The layout is structured with clear sections and supportive color elements for visual appeal.
Technology and Digital Transformation
Technology & Software
It addresses the barriers to Generative AI adoption related to trust, emphasizing the need for transparency, explainability, and worker trust, along with key statistics on organizational trust levels and risk management.
trust, Generative AI, adoption, barriers, transparency
Multiple Chart
Deloitte
Saved
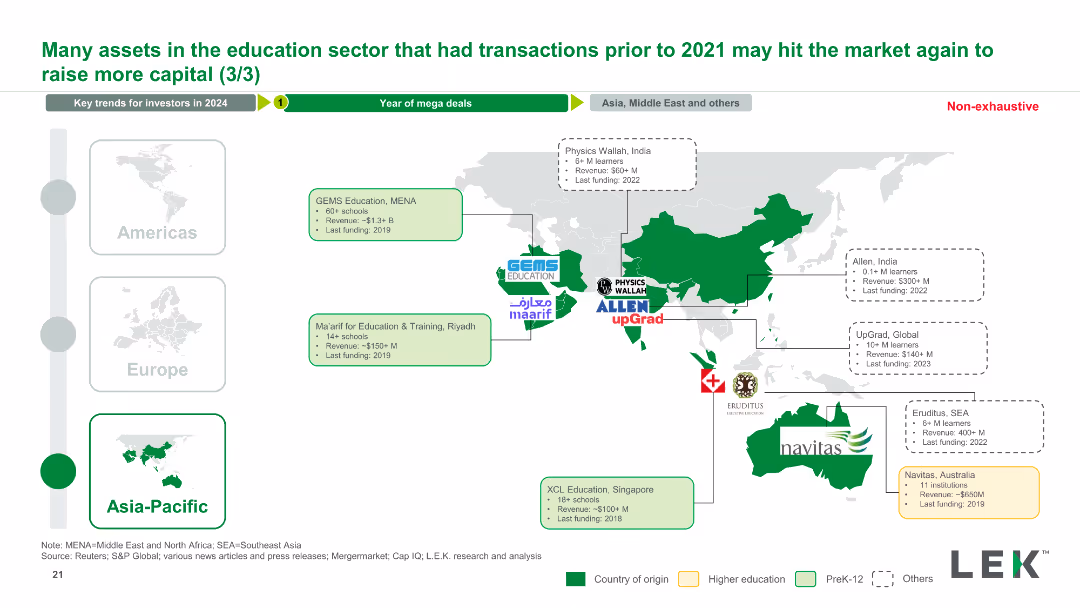
The slide features a map of Asia-Pacific with logos and brief details of education companies, accompanied by icons indicating educational sectors and financial data.
Market Analysis and Trends
Education & Training
This slide outlines Asia-Pacific education companies that had transactions before 2021 and may raise capital, listing company names, locations, and sector details.
capital raising, education assets, Asia-Pacific, market analysis, transaction history, education companies, investment opportunities
Graphic
LEK
Saved
A comparative slide with six pie charts representing different geographical regions and industries. Each pie chart shows the distribution of Champions, Leaders, Strivers, and Traditionalists.
Market Analysis and Trends
Professional Services
This slide presents the distribution of service player categories across different geographical regions and industries, highlighting the diversity in service management maturity.
geography, industry, Champions, Leaders, Strivers, Traditionalists
Multiple Chart
Accenture
Saved
The layout includes a header, three columns dividing the content into 'Our Clients', 'Our Business', and 'By the Numbers'. It features icons, bullet points, and column charts with light blue bars representing different financial metrics from 2017 and 2021, demonstrating an increase in each category.
Market Analysis and Trends
Financial Services
This slide highlights the achievements in record revenue and assets under custody for JPMorgan Chase's Securities Services. It provides a breakdown of client types, business services offered, and key financial metrics over time. Suitable for analyzing market trends and discussing strategic planning for business development and operational efficiency.
Securities, Revenue, Assets, Custody, Trading, Data Management, ETFs, Growth, Efficiency, Clients
Multiple Chart
JP Morgan
Saved
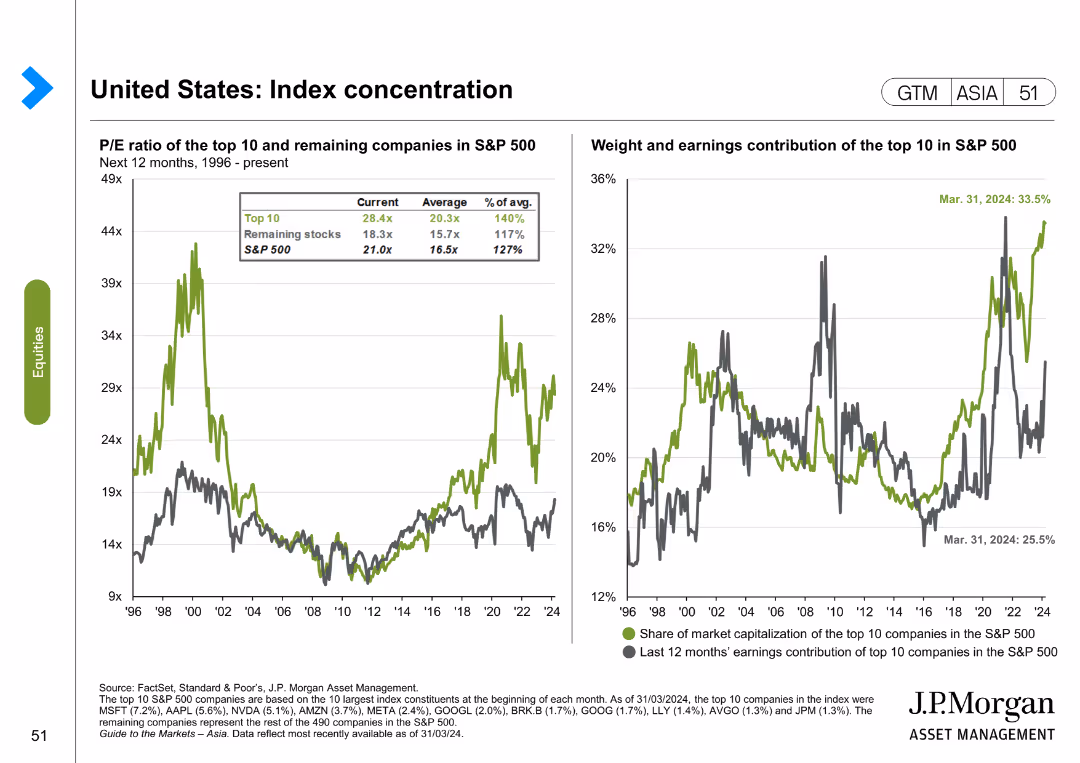
The slide features two line charts. The first chart shows the P/E ratio of the top 10 and remaining companies in the S&P 500 from 1996 to the present. The second chart shows the weight and earnings contribution of the top 10 in the S&P 500.
Market Analysis and Trends
Financial Services
The slide analyzes index concentration in the United States, focusing on the P/E ratio and earnings contribution of the top 10 companies in the S&P 500. It is used for market analysis and investment decision-making.
United States, index concentration, S&P 500, P/E ratio, earnings contribution, market analysis
Multiple Chart
JP Morgan
Saved
Slide contains charts and visual elements that illustrate the enhancement of digital services.
Technology and Digital Transformation
Financial Services
Discusses the role of digital transformation in enhancing service delivery, focusing on customer experience and operational efficiency.
Digital, Services, Enhancement, Technology
Single Chart
Barclays
Saved
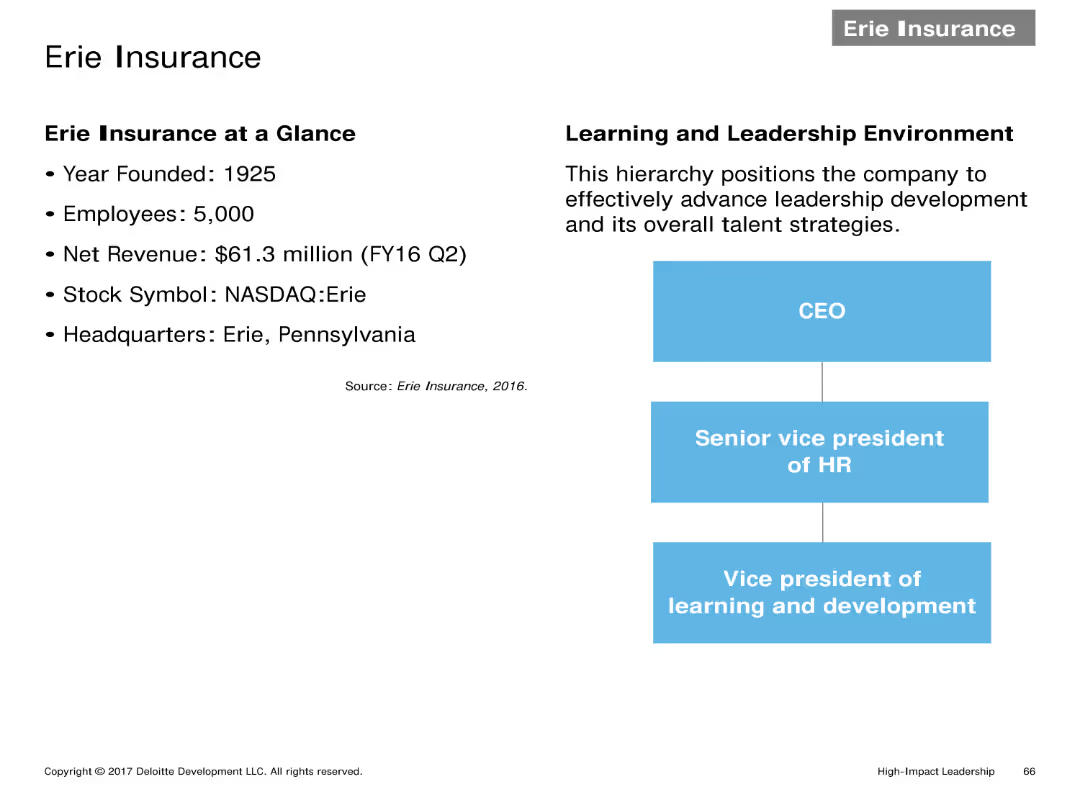
Two-column layout with company details on the left and a hierarchy chart on the right. Text details key information and organizational structure of Erie Insurance.
Client Case Studies
Financial Services
Provides an overview of Erie Insurance, including year founded, number of employees, net revenue, stock symbol, headquarters, and their learning and leadership environment.
Company overview, hierarchy, financial details, Erie Insurance, leadership environment
Header Horizontal
Deloitte
Saved
Features a line chart tracking the revenue of different types of mobile internet advertising in Hong Kong from 2015 to 2024, including mobile video, mobile search, and other mobile display advertising. Each line is color-coded, with highlighted circles emphasizing the CAGR for each category. The slide also includes bullet points summarizing the key drivers of mobile video advertising growth.
Market Analysis and Trends
Media & Entertainment
Focuses on the increasing significance of mobile video in internet advertising revenue in Hong Kong, detailing the growth rates and the impact of factors like 5G and social media platforms on this trend. The slide is intended to inform on the trajectory of mobile advertising expenditures and the evolving landscape of digital media consumption.
mobile video, advertising, growth, CAGR, Hong Kong, 2025, revenue, line chart
Mixed Chart
PwC/Strategy&
Saved
Slide features column charts showing projections for sales growth, income growth, and shareholder returns.
Financial Performance
Financial Services
Details the company's growth strategy through key financial metrics, focusing on margin expansion and shareholder returns.
financial growth, sales, income, shareholder returns, projections, column chart
Single Chart
Barclays
Saved
Slide with column charts comparing the superior rating of underwriting processes by line of business, using colors to differentiate the lines.
Operational Efficiency
Financial Services
Compares the quality ratings of underwriting processes across different insurance lines, focusing on aspects like pricing strategy and system accessibility.
quality rating, underwriting processes, insurance lines, pricing strategy, system accessibility
Mixed Chart
Accenture
Saved
Two column charts depict historical returns from government bonds during market shocks, comparing different countries. The background is white with 'Fixed Income' highlighted in blue.
Investment Analysis
Financial Services
The slide provides a historical comparison of government bond returns during economic shocks, potentially guiding investment decisions during times of market volatility. It is crucial for investors or policymakers analyzing diversification and risk management strategies.
Government Bonds, Returns, Shocks, Fixed Income, Diversification, Risk
Multiple Chart
JP Morgan
Saved
Slide with multiple pie charts detailing company focus areas in personalized nutrition, with percentages and icons.
Market Analysis and Trends
Agriculture & Food Production
Discusses company investments in personalized nutrition, focusing on product traceability and plant-based alternatives.
personalized nutrition, product traceability, plant-based, pie charts, investment
Multiple Chart
Deloitte
Saved
Uses a purple and blue gradient color scheme with a line graph displaying revenue growth. Graph markers indicate key financial milestones.
Market Analysis and Trends
Healthcare & Pharmaceuticals
Illustrates the revenue growth trajectory of Experian Health, aiming for a target beyond US$1 billion. Suitable for strategic presentations to investors or internal stakeholders focusing on growth in the healthcare sector.
revenue growth, healthcare market, Experian Health, financial targets
Single Chart
Barclays
Saved
The slide features a column chart showing the distribution of methane reduction efforts. It includes several text boxes outlining various technologies and solutions to reduce methane production in livestock and waste.
Technology and Digital Transformation
Agriculture & Food Production
This slide discusses strategies to reduce methane emissions in agriculture, focusing on livestock and waste. It details the potential abatement, associated costs, and specific technologies like feed supplements and biogas capture.
Methane reduction, Livestock, Emissions, Technology, Agriculture
Mixed Chart
EY
Saved
Advanced visual complexity, featuring a numbered list and associated detailed text, with a DNA strand graphic emphasizing the subject of bioengineering debate topics.
Strategic Planning
Education & Training
Outlines topics of debate regarding bioengineering such as risk, bioethics, changes to daily life, and future outlooks of the technology.
bioengineering, debate, ethics, daily life, future, bioethics, technology, sustainability, impact, society
Header Vertical
McKinsey
Saved
Previous
Next
If nothing, comes up, please save your slides first
Create a FREE account to continue browsing
Receive Instant Access to 1,000+ slides from companies like McKinsey, Google, and Goldman Sachs
First Name
Last Name
Email
Password
I agree to all
Terms & Privacy Policy
Thank you! Your submission has been received!
Oops! Something went wrong while submitting the form.
Have an account?
Sign in
Column Chart
Heatmap
Chevron
Org Chart
Infographic
Callouts
Timeline
List
Graphic
Picture
Process Flow
Diagram
Paragraph
Map
Table
Framework
Subtitle
Takeaway Box
Icon
Other Chart
Radar Chart
Waterfall Chart
Mekko Chart
Pie Chart
Scatter Plot
Line Chart
Bar chart
Bullet points