My Account
My Slides
Search by Category
Templates
Leave Feedback
Login
Logout
Get Started
Browse all Slides
Browse all Slides
Create a FREE Account
Instant access to 1,000+ real slides from top companies like McKinsey, BCG, Goldman Sachs, Google and many more!
First Name
Last Name
Email
Password
I agree to all
Terms & Privacy Policy
Thank you! Your submission has been received!
Oops! Something went wrong while submitting the form.
Have an account?
Sign in
Saved Slides
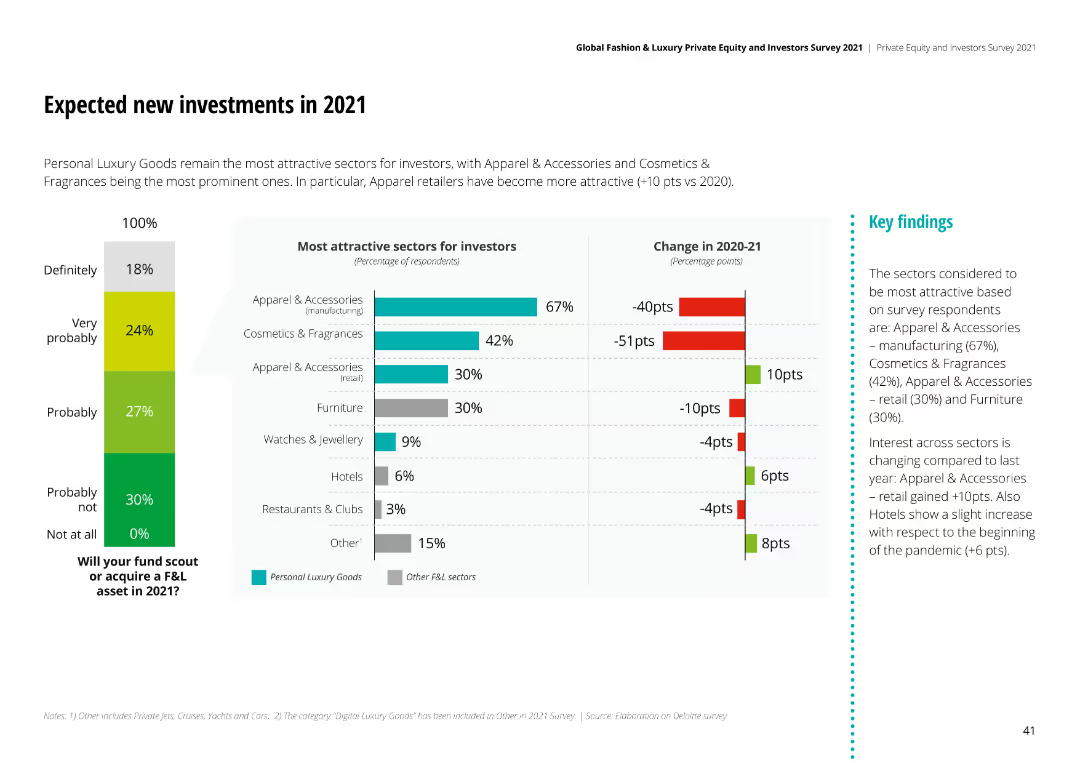
Column chart showing most attractive sectors for investors in 2021, with Apparel & Accessories and Cosmetics & Fragrances leading. Includes a change in 2020-21 sentiment chart.
Investment Analysis
Financial Services
Personal Luxury Goods sectors like Apparel & Accessories and Cosmetics & Fragrances are most attractive for 2021 investments, with significant sentiment changes from 2020.
new investments, 2021, sector attractiveness, investor perspective, sentiment change
Multiple Chart
Deloitte
Saved
A stylistic column chart with projected quarterly growth, using contrasting colors and a clear timeline, also includes bullet points on rate outlook and loan growth.
Financial Performance
Financial Services
Forecasts the net interest income growth for a financial institution, detailing contributing factors and expectations for the upcoming quarters.
NII, financial forecast, interest income, growth, quarterly, finance, loan growth, projections
Single Chart
JP Morgan
Saved
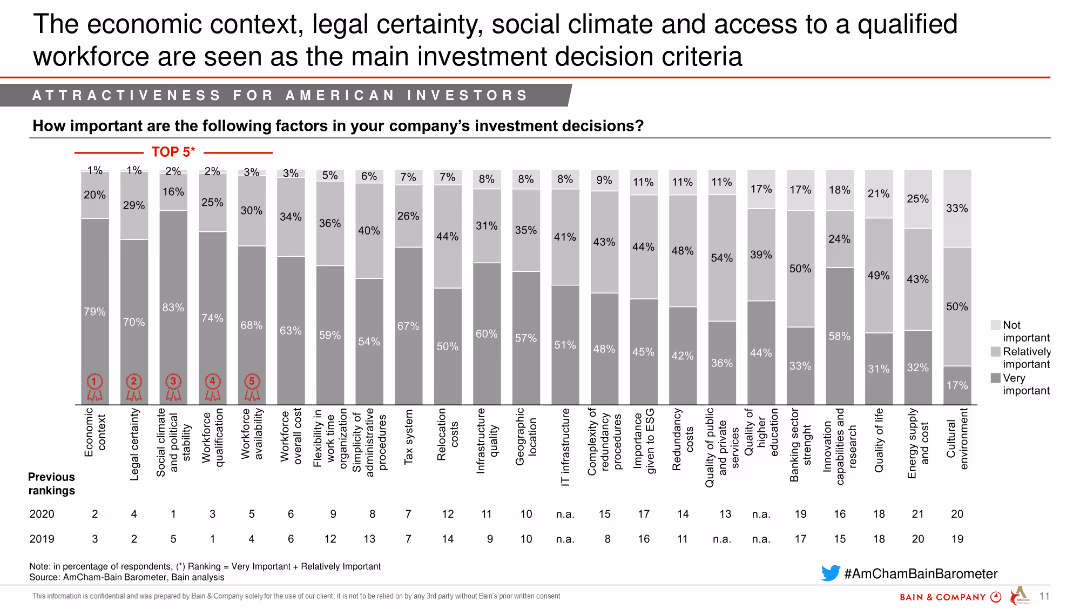
The slide contains a column chart highlighting the importance of various factors in investment decisions, such as economic context, legal certainty, and social climate, with rankings from 2019 to 2021.
Market Analysis and Trends
Media & Entertainment
This slide presents the key factors influencing investment decisions in France, with economic context and legal certainty being top priorities.
Investment criteria, Economic context, Legal certainty, Social climate, Workforce
Single Chart
Bain
Saved
The slide shows a line chart with time on the horizontal axis and percentage on the vertical axis, displaying a rising trend.
Financial Performance
Financial Services
Details the growing proportion of marketing budgets in company finances over time, attributing the increase to digital marketing investments. Suitable for financial analysis and planning, particularly in assessing the impact of marketing on overall budgets.
financial, marketing, budgets, trends, digital, analysis, growth, investment
Mixed Chart
Deloitte
Saved
Featuring an explanatory text block on the left and a colorful, detailed circular diagram on the right, this slide delves into the concept of "Total Enterprise Reinvention." The diagram includes elements like "Build Digital Core" and "People, Culture, and Purpose," highlighting components of the reinvention process.
Strategic Planning
Technology & Software
This slide introduces a comprehensive strategy model for transforming performance and operations within companies. It could be used in strategic planning sessions to facilitate discussions on the adoption of a technology-centric approach to business growth and operational excellence.
enterprise reinvention, strategy model, digital core, culture, business transformation
Single Chart
Accenture
Saved
Similar to the previous slide, this uses a split circular diagram with segments highlighted in orange and red, focusing on different tax proposals like Betting activities and VAT on asset managers. Icons and minimal text enhance clarity.
Regulatory and Compliance
Government & Public Sector
Further tax amendments for Namibia in 2018 are shown, discussing betting and gaming taxes, VAT changes for asset managers, and fuel levy increases. It helps in reviewing the expected financial outcomes from these legislative changes.
tax, amendments, revenue, betting, VAT, asset managers, fuel levy, Namibia, 2018
Framework
PwC/Strategy&
Saved
The slide includes a line graph showing the competitiveness of FCEV vs BEV in terms of fuel cell capex and vehicle range.
Strategic Planning
Energy & Utilities
The slide discusses the long-term competitiveness of fuel cell electric vehicles compared to battery electric vehicles, highlighting cost projections and competitive thresholds.
FCEV, BEV, competitiveness, cost, projections
Mixed Chart
Kearney
Saved
This slide includes multiple column charts comparing the monthly reach of AM/FM radio versus other music services among different age groups.
Market Analysis and Trends
Media & Entertainment
The slide compares the monthly reach percentages of AM/FM radio to various streaming services, showing the dominance of radio across all age groups in the U.S.
AM/FM radio, audio reach, column chart, age groups, streaming
Mixed Chart
Nielsen
Saved
The slide contains a column chart illustrating retail NPL sales volumes from 2010 to 2023. Different colors represent optimistic, base, and conservative growth projections.
Market Analysis and Trends
Financial Services
This slide provides projections for retail NPL sales volumes in Turkey from 2010 to 2023, with different scenarios reflecting optimistic, base, and conservative growth rates.
retail NPL, growth, Turkey, projections, scenarios
Mixed Chart
PwC/Strategy&
Saved
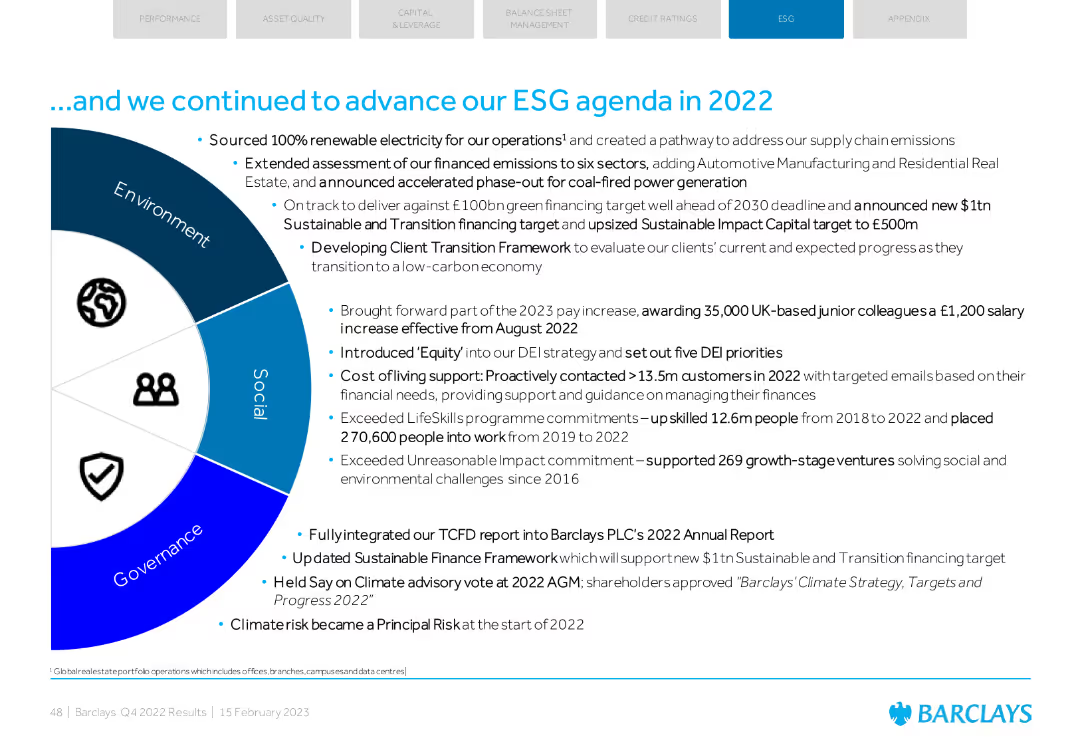
A mix of text and an infographic wheel illustrating ESG progress across Environment, Social, and Governance.
Regulatory and Compliance
Financial Services
Summarizes Barclays' ESG advancements in 2022, including renewable energy sourcing, DEI initiatives, and support for social and environmental ventures.
ESG, renewable energy, DEI, social impact, governance
Diagram
Barclays
Saved
A timeline depicting the evolution of SP trading from 2000 to 2019, with key milestones and strategic shifts indicated.
Strategic Planning
Financial Services
The slide outlines the historical development of SP trading, focusing on the consolidation, capital usage optimization, and partnership expansions.
SP trading, timeline, strategic planning, capital optimization, partnership expansion
Linear Flow
Credit Suisse
Saved
Two donut charts comparing the proportion of ad spend by delivery mechanism between 2015 and 2016, showing a shift towards dynamically inserted ads.
Market Analysis and Trends
Media & Entertainment
Analyzes shifts in podcast ad delivery mechanisms, highlighting an increase in dynamically inserted ads over the period, useful for strategic planning in advertising approaches within the media industry.
podcast, ad delivery, media trends, advertising
Multiple Chart
PwC/Strategy&
Saved
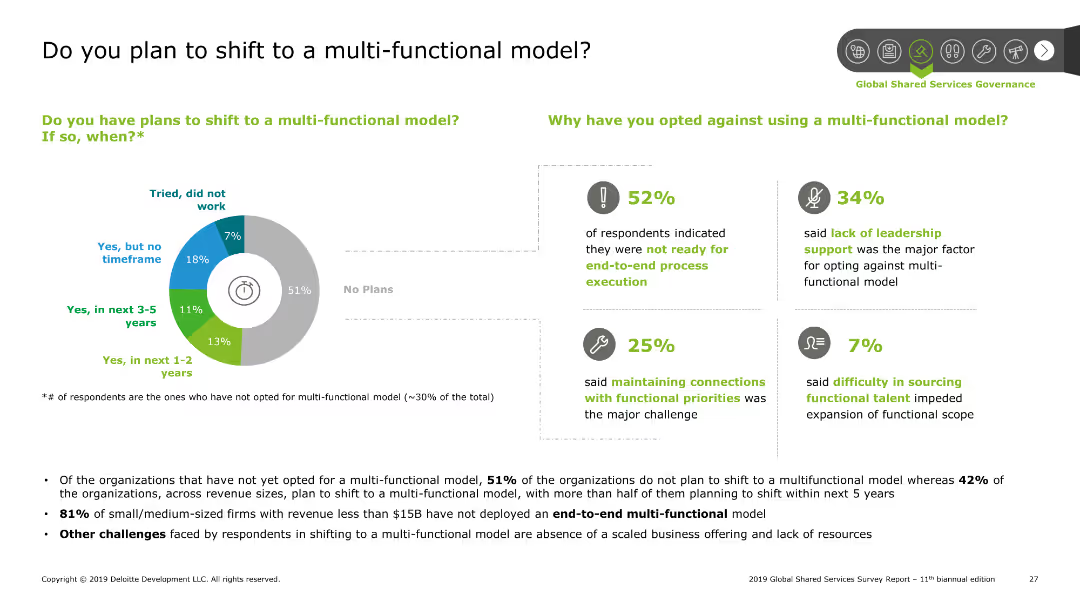
Pie chart showing the percentage of organizations planning to shift to a multi-functional model. Bar charts detailing reasons for not shifting. Summary points discuss findings and challenges faced by organizations.
Strategic Planning
Professional Services
The slide presents data on organizational plans to shift to a multi-functional model. A pie chart shows the percentage breakdown, while bar charts explain reasons for not shifting. Summary points highlight major challenges such as readiness for end-to-end execution and leadership support.
SSC, multi-functional model, planning, challenges, shift
Mixed Chart
Deloitte
Saved
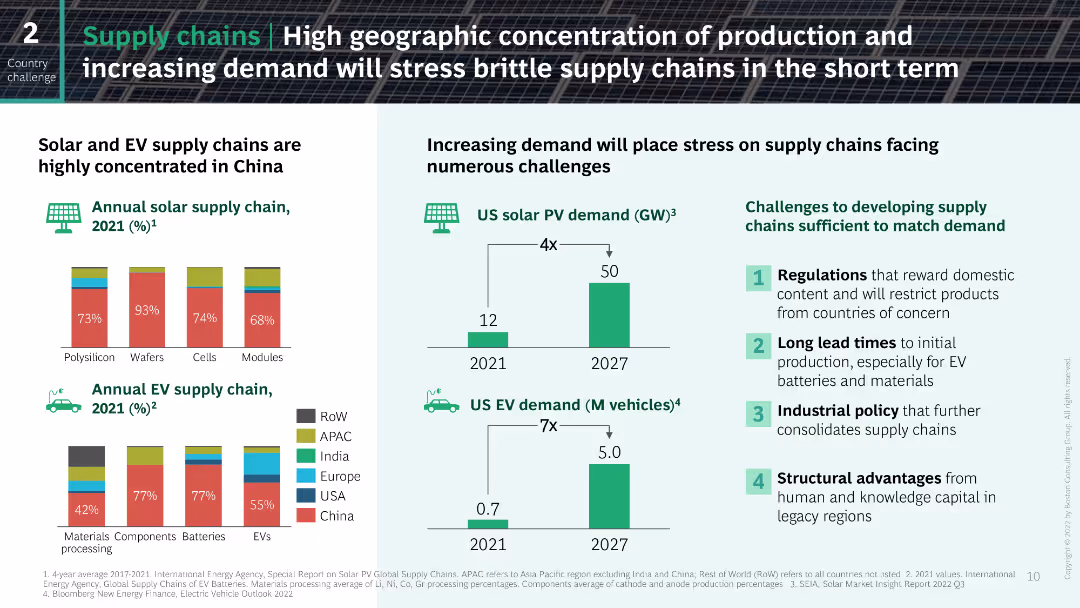
The slide contains a series of column charts and bar charts illustrating the concentration of solar and EV supply chains in China and the projected demand increases in the US. The layout is data-heavy with clear, color-coded segments representing different regions and their respective market shares.
Risk Assessment and Management
Industrial & Manufacturing
This slide analyzes the concentration of solar and EV supply chains in China and the projected increase in demand for these technologies in the US, highlighting the potential challenges in meeting this demand and the associated risks.
supply chains, solar, EV, China, demand
Multiple Chart
BCG
Saved
The slide contains a column chart displaying annual returns on a 60/40 stock-bond portfolio from 1994 to 2024. The chart shows equity contribution in gray, bond contribution in purple, and total return in green.
Investment Analysis
Financial Services
This slide provides an analysis of the returns on a 60/40 stock-bond portfolio, highlighting the contributions of stocks and bonds to the overall performance.
Portfolio returns, stock-bond, investment analysis, financial performance, equity, bond, annual returns, column chart
Single Chart
JP Morgan
Saved
Slide includes timelines and column charts detailing planned capital distributions over several years.
Strategic Planning
Financial Services
Outlines a multi-year plan for capital returns to shareholders, with specific targets set for 2024-2026.
capital, planning, 2026, returns, shareholders
Linear Flow
Barclays
Saved
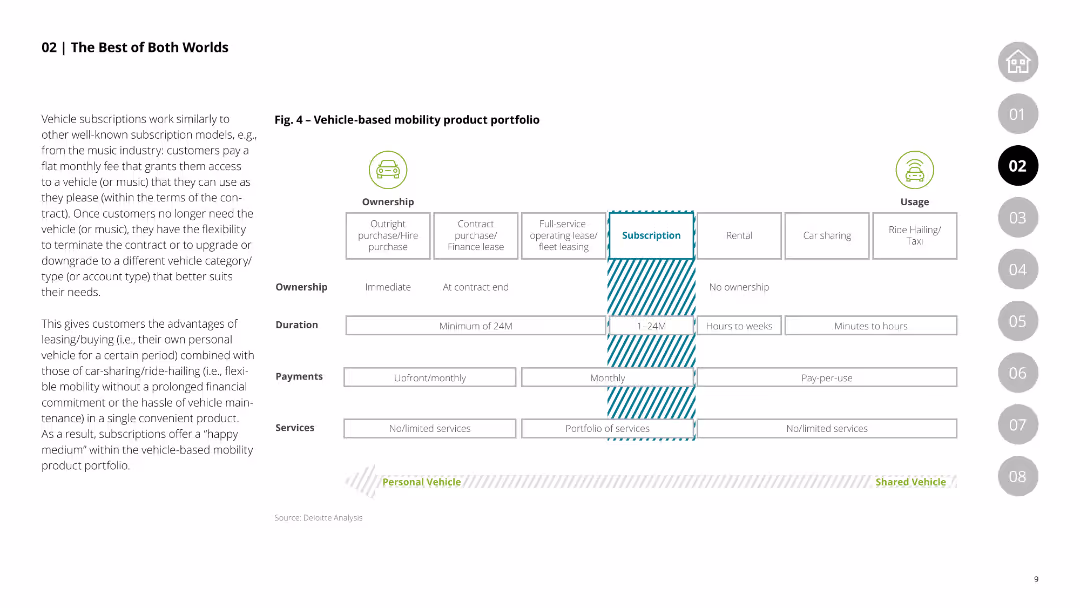
This slide features a comparative table showing the characteristics of vehicle-based mobility products, including ownership types, duration, payments, and services, comparing outright purchase, leasing, and subscription models.
Product and Service Analysis
Transportation & Logistics
Compares various vehicle-based mobility products, highlighting the flexibility and advantages of subscription models over traditional purchase and leasing options.
mobility products, vehicle ownership, leasing, subscription models, comparative analysis
Table
Deloitte
Saved
The slide uses a color scheme with gray and purple, featuring a centralized graphic representing China’s technology goals and four numbered segments with icons and brief descriptions around it. It contains moderate text and data visualizations like charts or graphs are not present.
Industry Overview
Technology & Software
This slide presents China's strategic focus in technology as outlined in their 14th Five-Year Plan, highlighting key imperatives to become a global digital powerhouse within the next five years. It breaks down the plan into four main objectives such as investment in digital infrastructure and enhancing education quality, aimed at fostering international collaboration and maintaining a policy of openness.
China, Technology, Five-Year Plan, Digital Powerhouse, Infrastructure, Education, Collaboration, Policy, Global Leader, Investment
Single Chart
Kearney
Saved
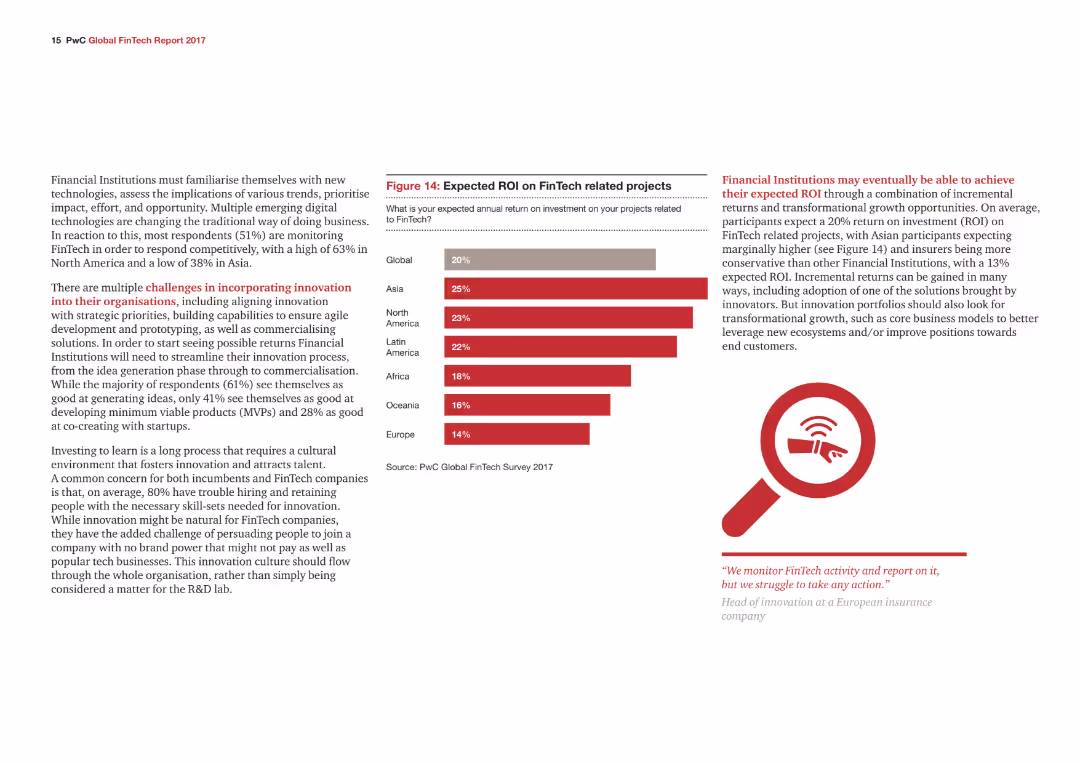
The slide features three pie charts detailing the type of companies, origin of participants, and type of respondents in the survey, with different colors and sections.
Market Analysis and Trends
Financial Services
The slide provides demographic details about the participants of the FinTech survey, including company types, regional distribution, and roles of respondents.
Participant profile, Demographics, Survey, FinTech, Analysis
Mixed Chart
PwC/Strategy&
Saved
Features pie charts and column charts analyzing commercial real estate loan risk and modifications.
Market Analysis and Trends
Real Estate & Construction
Provides a detailed look at commercial real estate loan risks and modifications over recent quarters, useful for risk assessment in real estate finance.
real estate, CRE, loan risk, market analysis, modifications
Multiple Chart
Deutsche Bank
Saved
Slide features purple and blue sections, icons for operational excellence, customer differentiation, and IT agility.
Technology and Digital Transformation
Technology & Software
Discusses how new technologies like GenAI enhance CSPs' ability to accelerate their tech transformation and gain a competitive edge, making them more likely to invest in updating their IT capabilities.
digital transformation, competitive advantage, GenAI, CSPs, IT investment
Header Vertical
Accenture
Saved
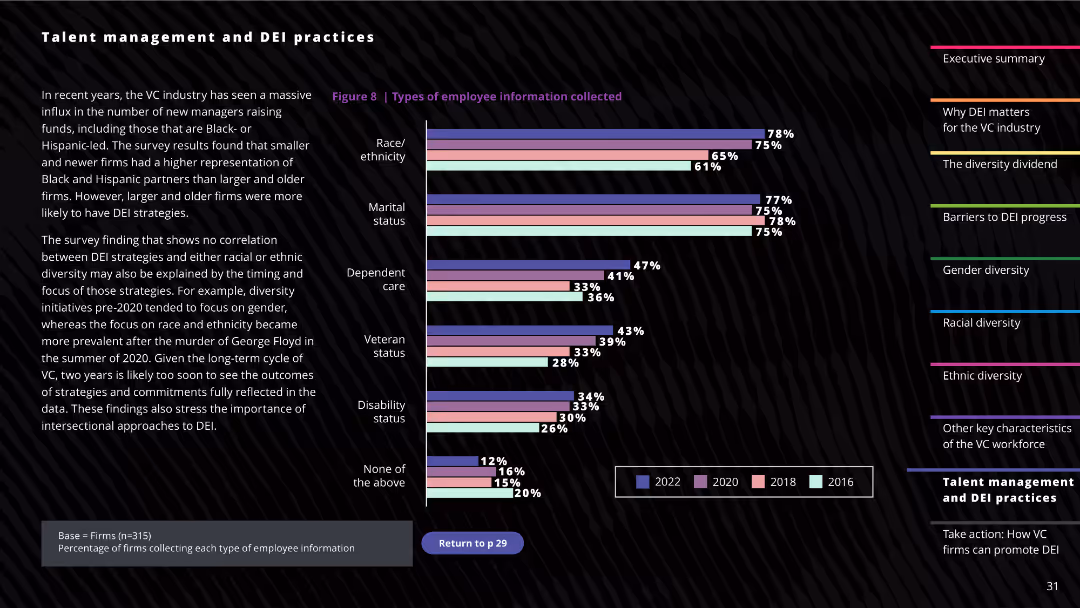
The slide contains a column chart showing the types of employee information collected by firms, such as race/ethnicity, marital status, and veteran status. Textual descriptions and notes on the importance of DEI practices are included.
Human Resources and Talent Management
Professional Services
This slide presents data on the types of demographic information collected by firms to support DEI practices, highlighting the increasing focus on race, ethnicity, and other diversity factors within the workforce.
Talent management, DEI practices, Employee information, Workforce diversity, Demographic data
Mixed Chart
Deloitte
Saved
The slide presents multiple stacked column charts in green shades showing the percentage of companies reporting different barriers to the development of personalized nutrition. Text boxes provide additional context and statistical data.
Market Analysis and Trends
Agriculture & Food Production
The slide provides insights into the main barriers faced by companies in developing personalized nutrition, such as R&D, consumer demand variations, and cost issues, alongside commentary on market trends and challenges.
personalized nutrition, R&D, consumer demand, cost barriers, market challenges
Mixed Chart
Deloitte
Saved
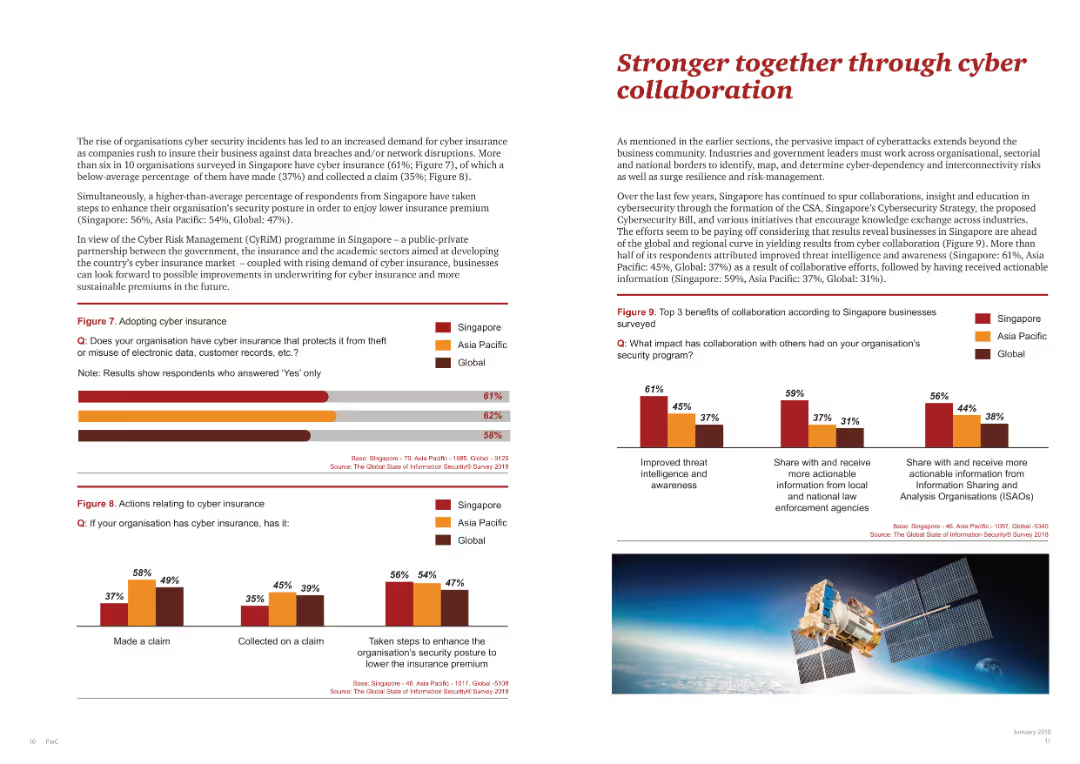
This slide shows two bar charts, one on adopting cyber insurance and another on the benefits of cyber collaboration.
Risk Assessment and Management
Telecommunications
Highlights the importance of collaboration in cybersecurity, showcasing benefits and adoption rates of cyber insurance across regions.
cyber collaboration, cyber insurance, survey benefits, regional data, security measures
Multiple Chart
PwC/Strategy&
Saved
Diagram of a central circle labeled 'Goldman Sachs' with connecting lines to various entities representing API connections.
Technology and Digital Transformation
Technology & Software
Outlines the central role of Goldman Sachs in connecting different sectors through APIs with a focus on technology development and service externalization.
platforms, technology, APIs, Goldman Sachs, development, externalization, developers, service
Framework
Goldman Sachs
Saved
Previous
Next
If nothing, comes up, please save your slides first
Create a FREE account to continue browsing
Receive Instant Access to 1,000+ slides from companies like McKinsey, Google, and Goldman Sachs
First Name
Last Name
Email
Password
I agree to all
Terms & Privacy Policy
Thank you! Your submission has been received!
Oops! Something went wrong while submitting the form.
Have an account?
Sign in
Column Chart
Heatmap
Chevron
Org Chart
Infographic
Callouts
Timeline
List
Graphic
Picture
Process Flow
Diagram
Paragraph
Map
Table
Framework
Subtitle
Takeaway Box
Icon
Other Chart
Radar Chart
Waterfall Chart
Mekko Chart
Pie Chart
Scatter Plot
Line Chart
Bar chart
Bullet points


![Exhibit 23 Retail NPL Sales Volume Expected Growth [TRY bn, 2010-23]](https://cdn.prod.website-files.com/654e70fb59937215cac87b19/6877e2161751f53f0c622983_BBai_k5b7CnS4pR6UgLlakGIJy5wz9d3QWqKrQsthSg.avif)