My Account
My Slides
Search by Category
Templates
Leave Feedback
Login
Logout
Get Started
Browse all Slides
Browse all Slides
Create a FREE Account
Instant access to 1,000+ real slides from top companies like McKinsey, BCG, Goldman Sachs, Google and many more!
First Name
Last Name
Email
Password
I agree to all
Terms & Privacy Policy
Thank you! Your submission has been received!
Oops! Something went wrong while submitting the form.
Have an account?
Sign in
Saved Slides
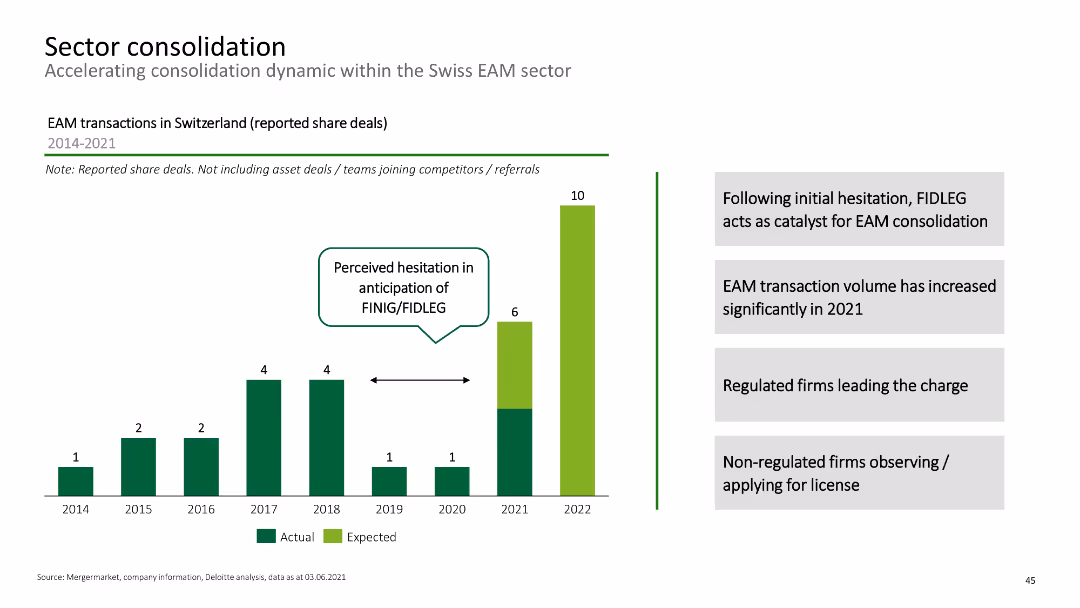
Column chart showing EAM transactions in Switzerland from 2014-2021, with annotations on consolidation catalysts.
Mergers and Acquisitions
Financial Services
This slide discusses the consolidation trends within the Swiss EAM sector, highlighting the impact of regulatory changes.
sector consolidation, EAM transactions, mergers, Swiss market, financial services
Mixed Chart
Deloitte
Saved
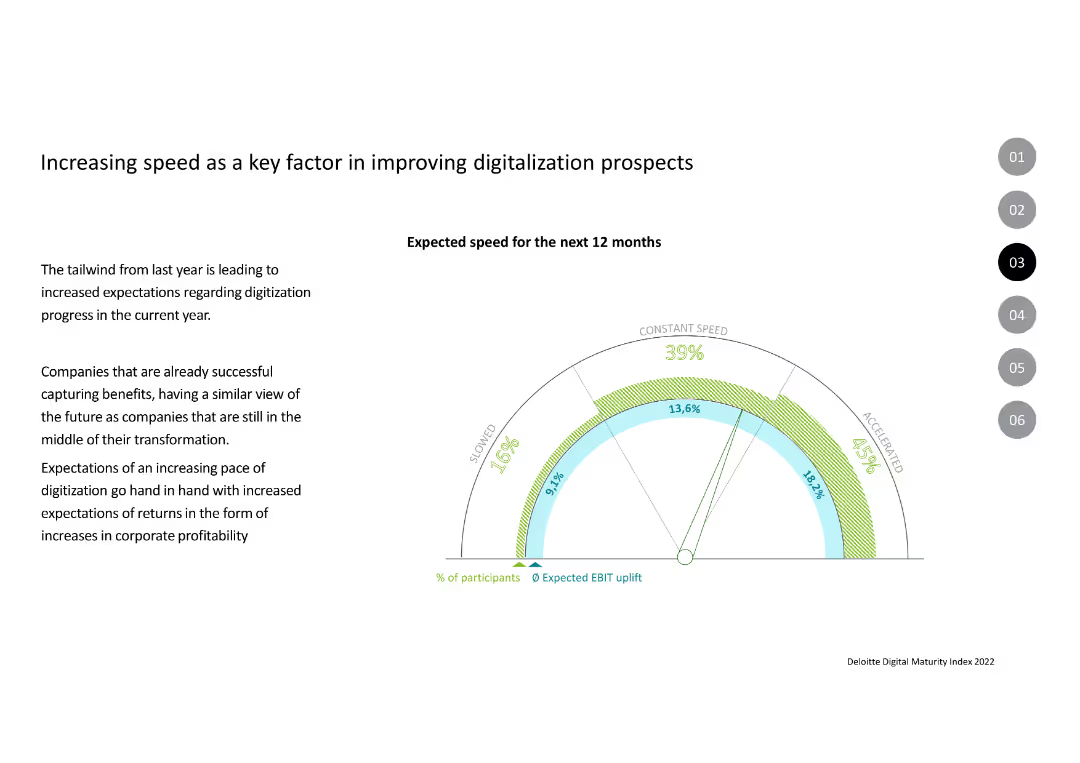
The slide includes a speedometer-style chart indicating expected speed for the next 12 months with segments for slowed, constant speed, and accelerated speeds.
Market Analysis and Trends
Technology & Software
The slide outlines the expectations of increased speed in digitization for the next year, correlating speed with expected EBIT uplift and profitability improvements.
Speed, Digitalization, EBIT, Profitability, Expectations, Transformation
Mixed Chart
Deloitte
Saved
Contains lists and categorizations of risks such as Product, Supply base, Manufacturing, etc., alongside icons illustrating different types of impact.
Risk Assessment and Management
Professional Services
Offers a detailed breakdown of various operations risks along with their potential impacts on revenue, cash, cost, and customer satisfaction.
Operations risk, Categories, Impact analysis, Revenue, Cash, Cost, Customer
Header Horizontal
Bain
Saved
This slide presents a simple graph with a horizontal continuum labeled from "Low Severity" to "Severely Adverse," with "Frequency" as the vertical axis. The graph is accompanied by a title and an explanatory subtitle.
Risk Assessment and Management
Financial Services
The slide focuses on managing across the risk continuum, with a visual representation of risk severity versus frequency. It can be used to discuss risk management strategies, particularly in preparing for varying degrees of financial risk scenarios.
risk appetite, cycle preparedness, frequency, severity, financial
Text Only
Goldman Sachs
Saved
Line graph depicting the growing percentage of OTT revenues within total TV revenues in Scandinavia from 2014 to 2023.
Market Analysis and Trends
Media & Entertainment
This slide illustrates the shift towards OTT platforms in Scandinavia, reflecting growing viewer preference for personalized entertainment.
OTT revenues, TV revenues, digital shift, Scandinavian market
Single Chart
PwC/Strategy&
Saved
Slide includes a column chart showing the evolution of Fed's supervision and regulation letters by topics, with a focus on process, technology, and other non-core topics over traditional reasons for bank failures.
Regulatory and Compliance
Financial Services
Discusses increased regulatory complexities faced by banks over recent years, focusing on how topics of supervision have shifted away from core financial risks to broader operational and technological aspects.
banking regulation, compliance burden, financial institutions, Fed supervision
Mixed Chart
Accenture
Saved
Slide is text-heavy, divided into several sections, detailing firmwide initiatives and KPIs with a complex structure, using a mixture of blue, teal, and black font colors.
Financial Performance
Financial Services
Detailing performance targets and KPI progress across various business divisions, this slide aims to communicate achievements and goals to stakeholders. It highlights strategic initiatives, efficiency ratios, and capital management metrics.
KPIs, targets, firmwide initiatives, performance, progress
Table
Goldman Sachs
Saved
The slide features a white background with text and a column chart showing company-level ESR ratios for Japan. It discusses Japan's transition to a new capital regime (ESR) by 2025, including changes to regulatory intervention points and the use of company-level data for initial calibration of the ESR scalar.
Regulatory and Compliance
Financial Services
This slide provides an example of a regime change in Japan, focusing on the move to an economic value-based capital regime (ESR) and the use of company-level data for calibration. It highlights the upward trend in ESR ratios and the expected analysis refresh in 2025.
Japan, regime change, ESR, capital regime, calibration
Mixed Chart
Oliver Wyman
Saved
The slide contains a map of Asia with highlighted countries and color-coded areas to depict various policies.
Market Analysis and Trends
Government & Public Sector
This slide explores ambitious policies in Indonesia, India, and Thailand aimed at growing their battery industries through strategic incentives.
emerging markets, policies, battery industry, Asia
Graphic
Accenture
Saved
A split slide with textual information on the left about job impact and an image of a worker on the right.
Human Resources and Talent Management
Transportation & Logistics
Analyzes the job creation impact of the F-Series across various sectors, with a focus on multiplier effects.
Ford, F-Series, job impact
Single Chart
BCG
Saved
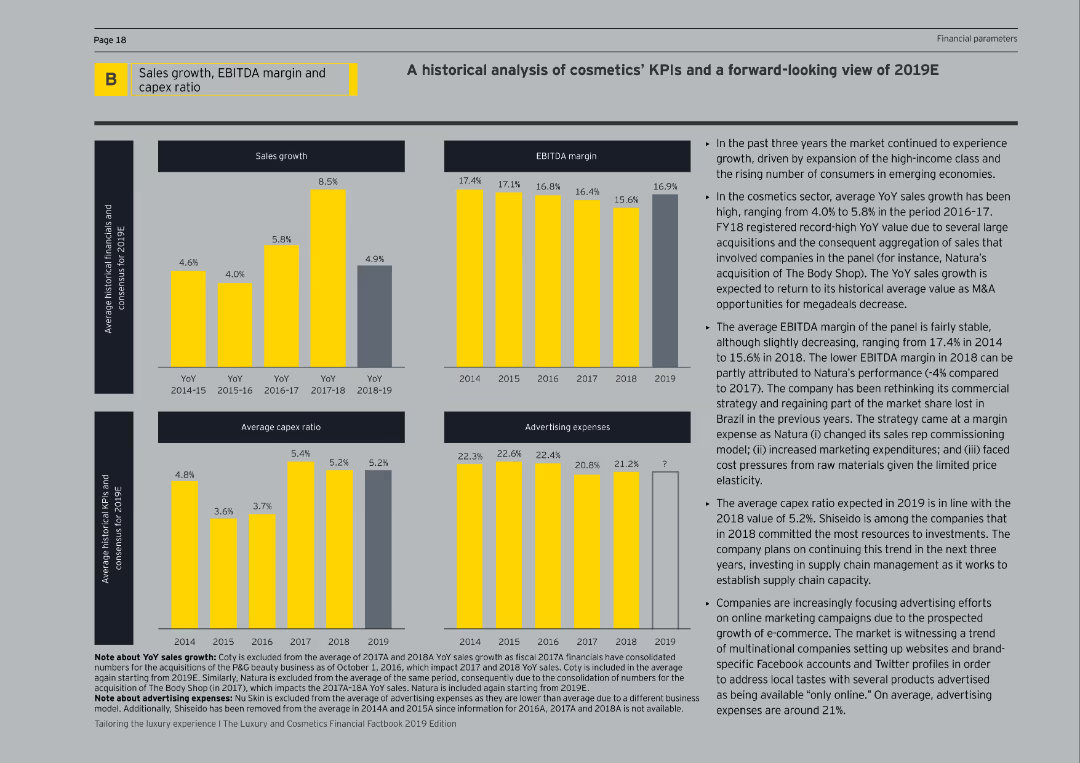
The slide includes multiple column charts detailing sales growth, EBITDA margin, average capex ratio, and advertising expenses over several years. The text description is on the right, explaining the trends and providing future expectations.
Market Analysis and Trends
Consumer Goods
This slide offers a historical analysis of key performance indicators (KPIs) in the cosmetics sector, focusing on sales growth, EBITDA margin, capex ratio, and advertising expenses. It also provides a forward-looking view for 2019, highlighting market drivers and expected performance.
Cosmetics, KPIs, Sales Growth, EBITDA, Capex
Multiple Chart
EY
Saved
Three consumer profiles are laid out side by side, with icons and a gradient scale indicating technology adoption levels, in a visually balanced manner.
Customer and Market Segmentation
Technology & Software
Segments Indonesian consumers into three categories based on digital habits, useful for tailoring digital marketing strategies.
consumer types, digital habits, Indonesia, technology adoption
Pillar
Kearney
Saved
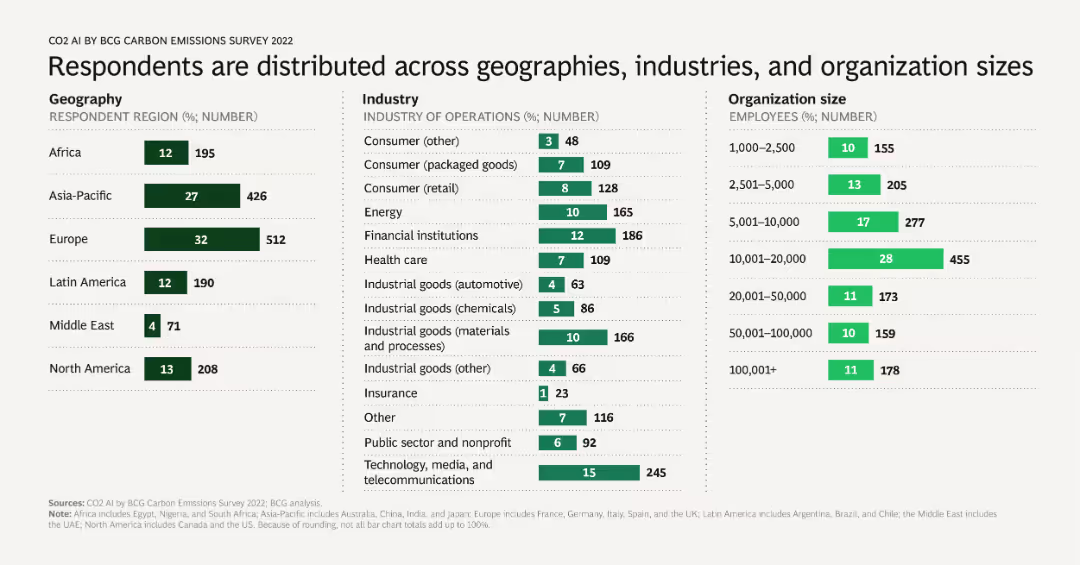
The slide includes a table that distributes respondents by geography, industry, and organization size.
Market Analysis and Trends
Professional Services
This slide provides a distribution of survey respondents across different geographies, industries, and organization sizes, offering a comprehensive view of the survey's coverage.
Respondents, distribution, geography, industry, organization size
Multiple Chart
BCG
Saved
A large column chart details the reasons why sustainability matters in luxury goods purchases.
Customer and Market Segmentation
Environmental Services & Sustainability
Analyzes consumer priorities regarding sustainability in the context of luxury goods.
sustainability, luxury goods, consumer priorities, environmental impact
Single Chart
BCG
Saved
Features a series of column charts representing SACU receipts over four fiscal years, showcasing trends and fluctuations in revenue.
Financial Performance
Government & Public Sector
This slide tracks the Southern African Customs Union (SACU) receipts from 2017 to 2020, providing insights into regional economic collaboration and financial trends affecting Namibia's budgetary considerations.
SACU, Revenue, Trends, Economic, Customs
Single Chart
PwC/Strategy&
Saved
A slide with two sections identifying industries that could be most affected by space technology trends, with icons for visual emphasis.
Technology and Digital Transformation
Telecommunications
Identifies telecommunications and aerospace and defense as key industries affected by space tech, and explores emerging use cases across various sectors.
telecommunications, aerospace, defense, industry impact, space technology use cases
Boxed
McKinsey
Saved
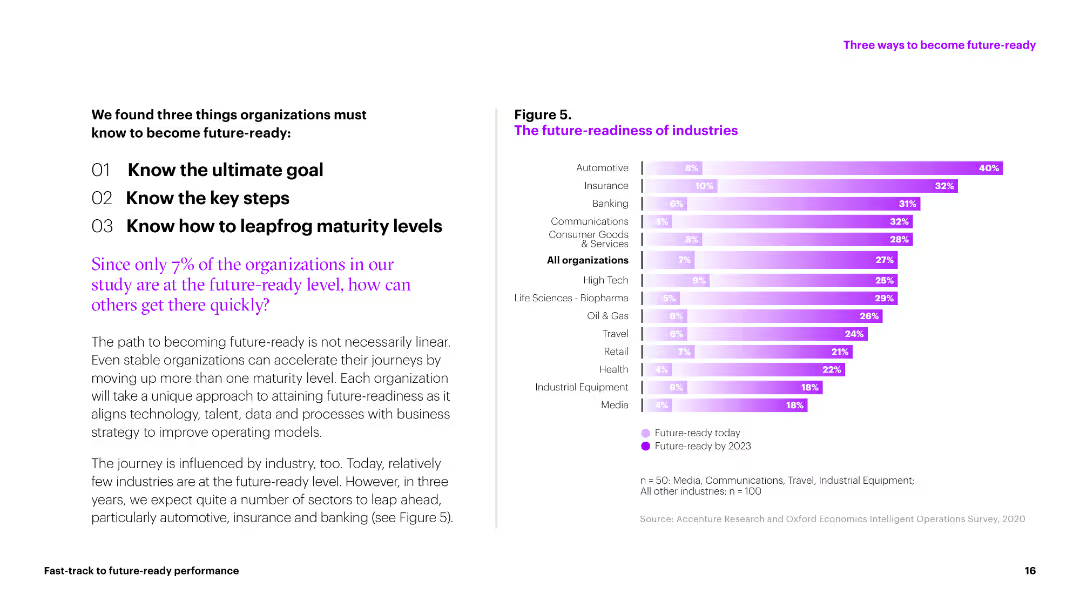
A bar chart displaying future-readiness levels across various industries. Bars represent readiness today and projected for 2023, with different colors indicating the timeline.
Market Analysis and Trends
Professional Services
This slide compares the future-readiness of different industries, showing current levels and projections for 2023. It highlights how sectors like automotive and insurance are expected to progress.
future-readiness, industries, projections, 2023, current levels
Mixed Chart
Accenture
Saved
This slide features three column charts comparing energy consumption costs in EUR/100 km for H2 ICE, FCEV, and BEV across PC, LCV, and HDT segments. Key assumptions are listed.
Market Analysis and Trends
Energy & Utilities
The slide analyzes energy consumption costs for different vehicle types, highlighting that FCEV is more competitive in heavy-duty trucks compared to BEV, with BEV being lower in LCV and PC.
Energy, Consumption, FCEV, BEV, H2 ICE
Multiple Chart
Roland Berger
Saved
Bar chart on the left, depicting online travel GMV (Gross Merchandise Value) across three segments with forecast for 2025. Right side text describing the online travel trends, recovery signs, and the growth of online penetration.
Market Analysis and Trends
Technology & Software
Details the financial impact of COVID-19 on the online travel industry and projects future growth. Useful for investors and businesses within the online travel sector for strategic planning and understanding the pace of market recovery.
Online travel, COVID-19 impact, Market recovery, Growth projection, GMV
Mixed Chart
Bain
Saved
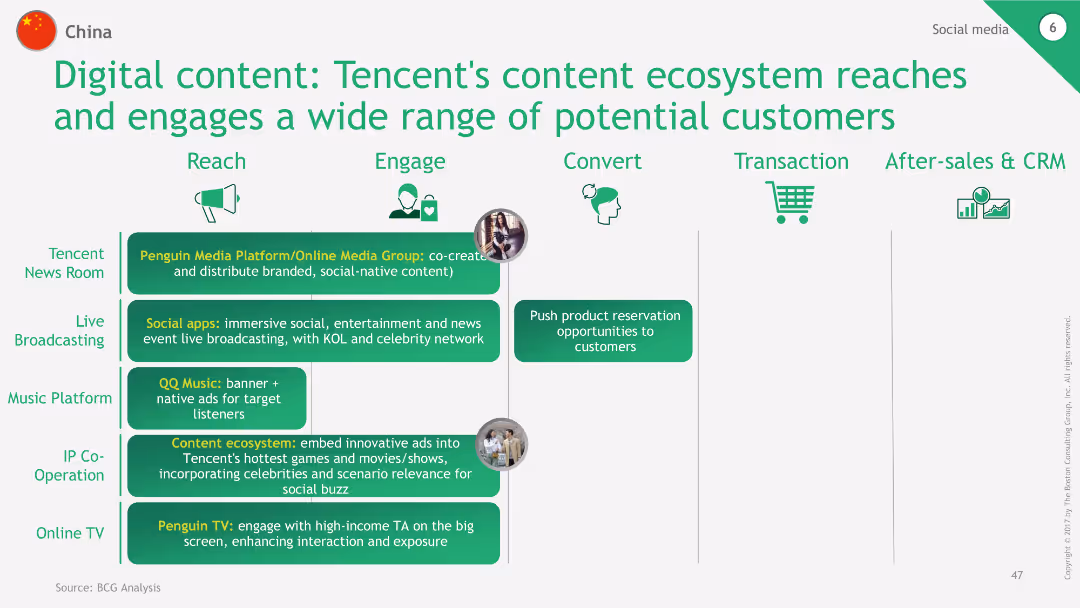
The slide uses a process flow diagram to show Tencent's content ecosystem, highlighting platforms like Penguin Media, Live Broadcasting, QQ Music, and Penguin TV. It demonstrates how these platforms reach, engage, and convert customers, ending with transaction and after-sales & CRM stages.
Technology and Digital Transformation
Consumer Goods
This slide demonstrates the wide reach and engagement of Tencent's content ecosystem, showing how various platforms and services interact with customers through different stages of the shopping journey, from reach to after-sales.
Tencent, content ecosystem, engagement, conversion, CRM
Table
BCG
Saved
A bar chart shows the importance of various aspects of public EV charging experiences and payment preferences, with sections color-coded for clarity.
Market Analysis and Trends
Transportation & Logistics
Evaluates consumer priorities for public EV charging, including charging speed and payment methods, informing service improvement and customer satisfaction strategies in the automotive sector.
electric vehicles, charging experience, fast charging, payment methods, consumer preferences, service improvement, automotive industry
Mixed Chart
Deloitte
Saved
Includes a bar chart comparing EV and ICE performance across temperatures.
Operational Efficiency
Transportation & Logistics
Discusses how different cell types and vehicle configurations impact EV performance.
EV, performance challenges, temperature, cell types, vehicle configuration
Mixed Chart
PwC/Strategy&
Saved
The slide features three line charts representing the US, Euro area, and UK with input and output PPI trends from 2017 to 2024.
Financial Performance
Financial Services
The slide explains how companies in the US, Euro area, and UK are passing input costs to consumers, highlighting margin erosion trends.
US, Euro area, UK, input PPI, output PPI, margin erosion, financial performance, cost pass-through
Multiple Chart
Accenture
Saved
Simplified organizational chart of planned legal entity changes
Organizational Structure and Change
Financial Services
Outlines planned legal entity changes within UBS Group AG
legal, entity, changes, UBS, structure
Diagram
UBS
Saved
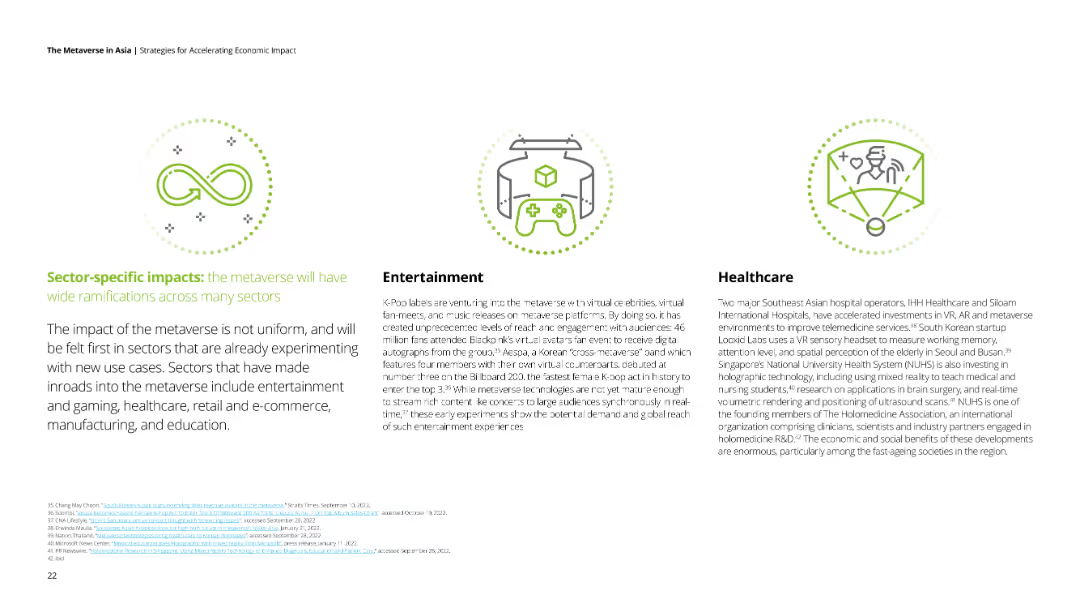
Three sections with icons representing infinity, a game controller, and a healthcare professional. Each section has text explaining impacts on different sectors.
Market Analysis and Trends
Technology & Software
The slide discusses the varying impacts of the metaverse on different sectors, highlighting entertainment and healthcare.
metaverse, sector impacts, entertainment, healthcare, technology
Pillar
Deloitte
Saved
Previous
Next
If nothing, comes up, please save your slides first
Create a FREE account to continue browsing
Receive Instant Access to 1,000+ slides from companies like McKinsey, Google, and Goldman Sachs
First Name
Last Name
Email
Password
I agree to all
Terms & Privacy Policy
Thank you! Your submission has been received!
Oops! Something went wrong while submitting the form.
Have an account?
Sign in
Column Chart
Heatmap
Chevron
Org Chart
Infographic
Callouts
Timeline
List
Graphic
Picture
Process Flow
Diagram
Paragraph
Map
Table
Framework
Subtitle
Takeaway Box
Icon
Other Chart
Radar Chart
Waterfall Chart
Mekko Chart
Pie Chart
Scatter Plot
Line Chart
Bar chart
Bullet points