My Account
My Slides
Search by Category
Templates
Leave Feedback
Login
Logout
Get Started
Browse all Slides
Browse all Slides
Create a FREE Account
Instant access to 1,000+ real slides from top companies like McKinsey, BCG, Goldman Sachs, Google and many more!
First Name
Last Name
Email
Password
I agree to all
Terms & Privacy Policy
Thank you! Your submission has been received!
Oops! Something went wrong while submitting the form.
Have an account?
Sign in
Saved Slides
Slide split in two columns, one for quantitative data with pie charts, one for qualitative insights with logos.
Customer and Market Segmentation
Professional Services
Methodology of a consumer survey, and business insights from Southeast Asian leaders on digital economy impact.
digital economy, Southeast Asia, consumer behavior, methodology, business insights
Multiple Chart
Bain
Saved
Slide features column charts depicting adjustments in operating profits across several business units. It includes green, red, and blue bars, some with growth indicators, and integrates real-world imagery of a building's balcony.
Financial Performance
Real Estate & Construction
Analyzes adjusted operating profit by business segment for Q1 2020 compared to Q1 2021, highlighting changes and trends in the real estate and construction industry.
Business premises, operating profit, real estate, financial analysis, construction
Single Chart
Goldman Sachs
Saved
The slide includes two pie charts showing percentages and timelines representing early mover advantage in technology. It uses a minimalistic design with a black background and white and red text.
Market Analysis and Trends
Technology & Software
This slide presents data on how AI influences competition in business, emphasizing the advantages of being an early adopter in technological advancements.
AI, competition, technology, early adoption, business models
Multiple Chart
Bain
Saved
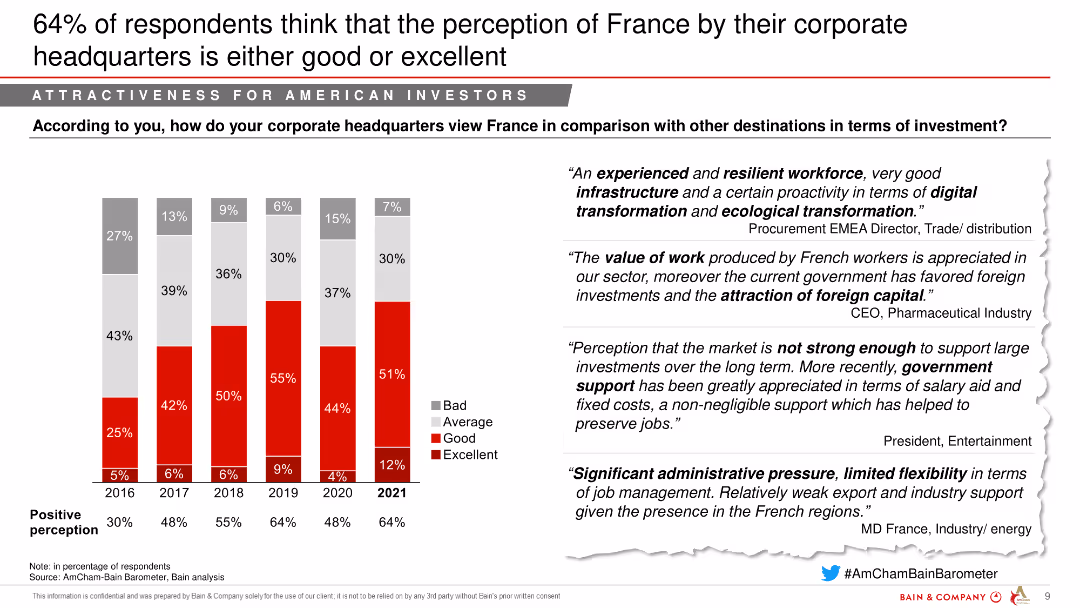
The slide includes a column chart showing the perception of France's investment attractiveness from 2016 to 2021, segmented into bad, average, good, and excellent. Quotes from industry leaders are on the right.
Market Analysis and Trends
Financial Services
The slide shows an improving perception of France by corporate headquarters, indicating good or excellent ratings from a majority of respondents.
Perception, Investment attractiveness, Corporate headquarters, Financial services
Mixed Chart
Bain
Saved
The slide features two sections, one showing a column chart for the top two investment categories in Indonesia (Fintech and Healthcare) with their respective percentages, and the other providing qualitative insights into these categories.
Market Analysis and Trends
Financial Services
This slide identifies Fintech and Healthcare as the top investment categories in Indonesia, with 67% and 25% of responses respectively, highlighting the growing demand for tech-enabled consumer services in these sectors.
top investment categories, Indonesia, fintech, healthcare, investment, 2017, tech-enabled services
Pillar
Kearney
Saved
The slide contains a considerable amount of text in two columns, accented by two images in the top corners. The design utilizes bullet points and bolding to emphasize key messages.
Customer and Market Segmentation
Financial Services
Describing the bank's client-focused strategies, the slide elaborates on the methods used to enhance client experiences, including feedback mechanisms and human-centered design principles. It aims to demonstrate the bank's commitment to improving customer service and resolving issues.
client experience, feedback, human-centered design, customer service, improvement, strategy
Header Vertical
Morgan Stanley
Saved
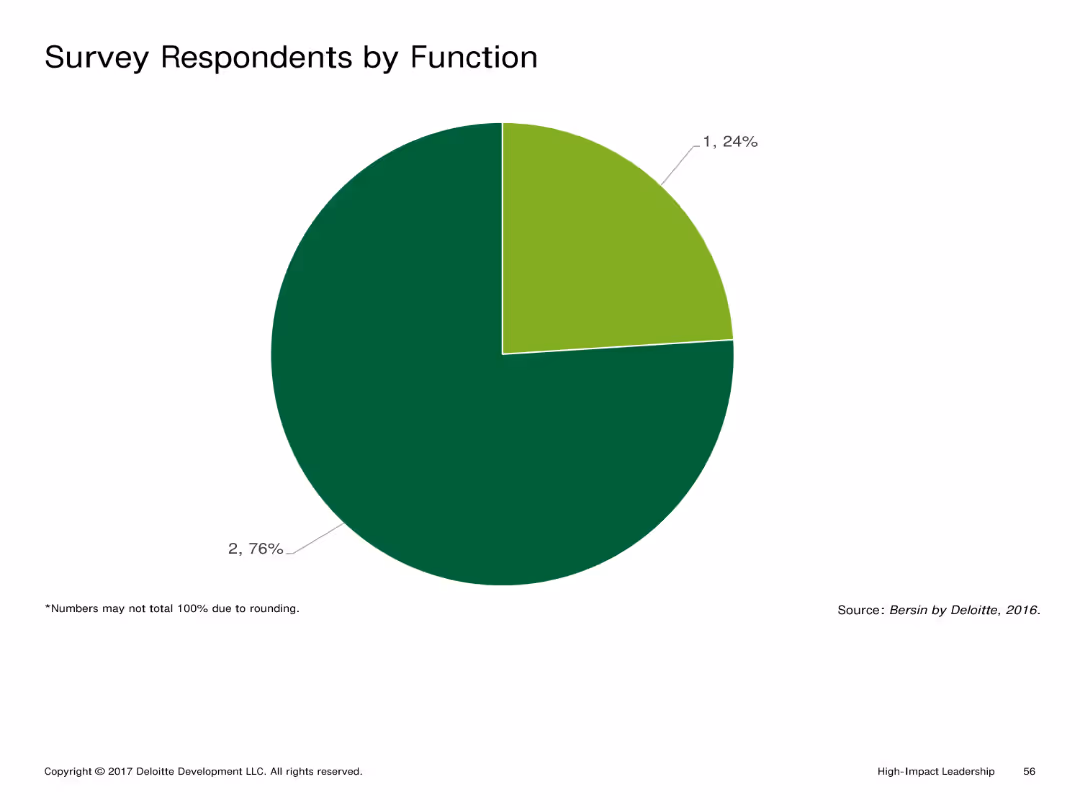
Pie chart indicating the percentage distribution of survey respondents by function. The chart is simple with two main colors differentiating the segments.
Market Analysis and Trends
Professional Services
Shows the breakdown of survey respondents by their functional roles within their organizations, aiding in understanding their professional backgrounds.
Pie chart, survey, function, distribution, roles
Single Chart
Deloitte
Saved
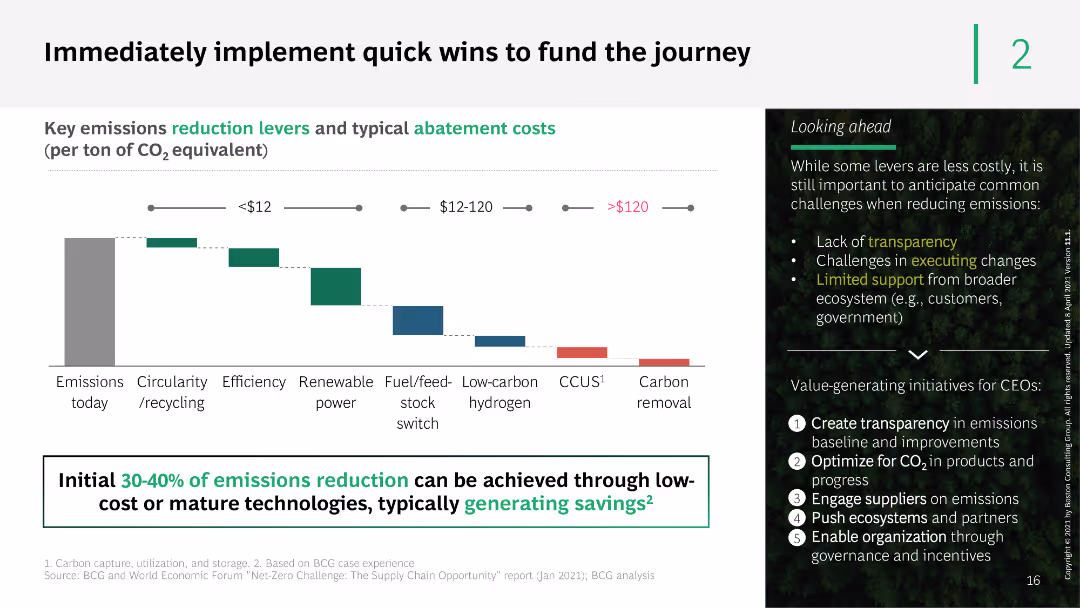
This slide contains a column chart showing key emission reduction levers and their abatement costs. It uses a gradient color scheme and detailed annotations to describe different abatement strategies and their potential impact.
Operational Efficiency
Energy & Utilities
The slide identifies key emissions reduction levers and typical abatement costs, suggesting that 30-40% of emissions reduction can be achieved through low-cost or mature technologies. It includes recommendations for CEOs on value-generating initiatives.
emissions reduction, abatement costs, strategies, low-cost technologies, CEO recommendations
Mixed Chart
BCG
Saved
A column chart for Great Britain showing actions believed to reduce greenhouse gas emissions, ranked by perceived impact and CO2 saved. Bars are in varying shades of green.
Market Analysis and Trends
Environmental Services & Sustainability
This slide shows the ranking and perceived effectiveness of actions to reduce greenhouse gas emissions in Great Britain, emphasizing the gap between public perception and the actual CO2 savings potential.
greenhouse gas, emissions, public perception, Great Britain, impactful actions, CO2 savings, environmental impact
Mixed Chart
IPSOS
Saved
This slide features four circular diagrams with titles and supporting text, evenly spaced on a dark background.
Strategic Planning
Professional Services
The slide suggests strategies for businesses to enhance capabilities to thrive in new realities, such as developing resilience and scaling digital experiences.
resilience, demand-sensing, omnichannel, future scenarios, strategy
Pillar
BCG
Saved
The slide presents a timeline from 1991 to 2018, showing key milestones in renewable and heavy lifting sectors, accompanied by icons like wind turbines and gears, which add context to each entry.
Industry Overview
Energy & Utilities
The slide outlines the company's history and growth in the renewables sector, highlighting major projects and acquisitions, aiming to establish credibility and experience in the industry.
renewables, timeline, growth, projects, acquisitions
Linear Flow
Barclays
Saved
A bar chart showing real GDP growth in selected economies for 2024 under baseline and higher-for-longer scenarios, with detailed text analysis on inflation, central bank policies, and economic conditions.
Risk Assessment and Management
Financial Services
This slide analyzes a higher-for-longer scenario where delayed easing by central banks amid sticky inflation trends could lead to recessionary conditions in key advanced economies.
higher-for-longer, GDP growth, inflation, central banks, economic conditions, 2024
Mixed Chart
EY
Saved
Moderate complexity with bullet points, icons, and text
Market Analysis and Trends
Environmental Services & Sustainability
This slide predicts the long-term effects of technology trends on different industries. It is useful for strategic planning and forecasting future market developments. It discusses the anticipated changes and how industries can adapt to these trends for sustainable growth.
Forecasting, Long-Term Impact, Adaptation, Market Development, Sustainability
Header Vertical
McKinsey
Saved
A text-heavy slide divided into four sections, each with an icon, describing key themes in the crop market. The blue color scheme is consistent with the rest of the presentation.
Strategic Planning
Agriculture & Food Production
Four key themes are outlined related to crop market investments, including fundamental industry trends and questions for strategic considerations.
crop market, investment themes, industry issues, strategic planning, agriculture, fundamental trends
Pillar
EY
Saved
This slide features multiple bar graphs comparing the Manufacturing PMI across several countries (US, Germany, Italy, Sweden, China, South Korea, Japan) before, during, and after the crisis. Each country's graph shows monthly PMI values from January to July, with bars color-coded to indicate different levels of manufacturing activity (negative growth, neutral, positive growth). The graphs are aligned horizontally for easy comparison, with annotations indicating significant events like lockdowns, providing a clear timeline of economic activity.
Operational Efficiency
Industrial & Manufacturing
The slide compares global manufacturing performance using PMI as an indicator, making it valuable for assessing the impact of COVID-19 on the manufacturing sector. It helps stakeholders understand which regions are experiencing recovery and which are still struggling, facilitating targeted strategic decisions in supply chain management and production planning. The visual representation of PMI trends provides a quick overview of economic resilience and recovery patterns, essential for operational planning and investment decisions in the manufacturing sector.
PMI, manufacturing, COVID-19, economic recovery, global comparison, operational planning, supply chain management
Multiple Chart
BCG
Saved
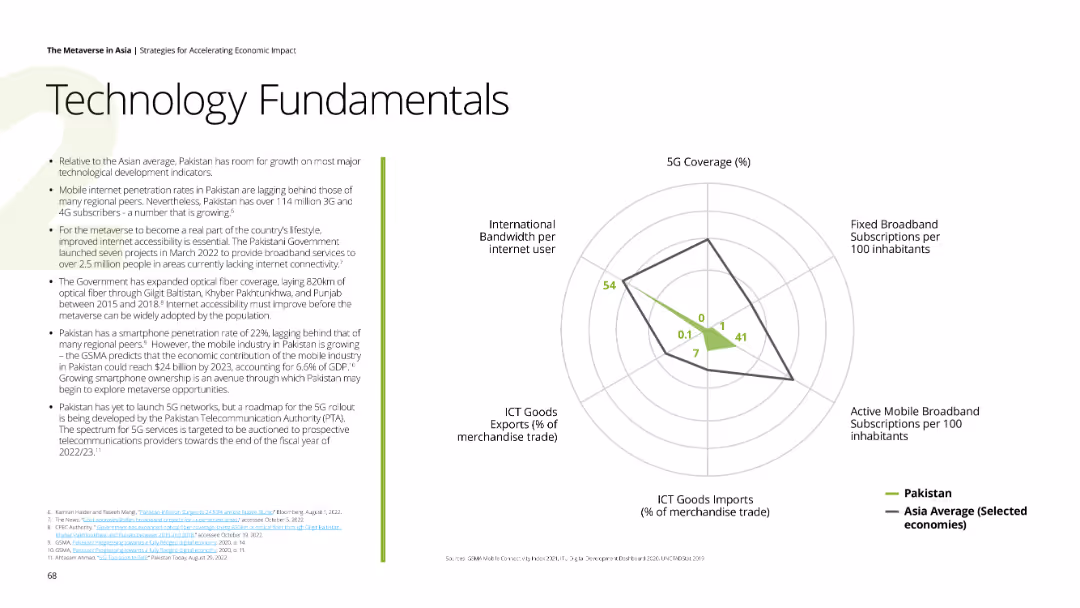
Contains a spider chart comparing Pakistan's 5G coverage, broadband subscriptions, mobile broadband subscriptions, ICT goods imports, and international bandwidth per internet user with Asia average. The background is white, and accents are green.
Technology and Digital Transformation
Technology & Software
Reviews Pakistan's ICT development indicators, highlighting the growth in mobile and broadband subscriptions, and the impact of government initiatives on digital infrastructure.
Pakistan, technology, 5G, broadband, digital infrastructure
Mixed Chart
Deloitte
Saved
Slide displays a line graph illustrating the global Big Data Analytics market forecast. The layout includes bulleted text and a highlighted callout box, making it easy to follow.
Market Analysis and Trends
Environmental Services & Sustainability
Analyzes the integration of Earth Observation data within the Big Data context, forecasting significant growth in EO Big Data revenues. This slide is instrumental for discussions on market opportunities and strategic planning.
Big Data, Earth Observation, market forecast, revenue growth, analytics
Mixed Chart
PwC/Strategy&
Saved
The slide presents a composite of bar charts and a list, comparing data between the years 2023 and 2024 in terms of business leaders' expectations for revenue, profits, and headcount. It also shows business planning priorities in a vertical list layout. The graphical elements are well organized, using color differentiation for each year.
Strategic Planning
Financial Services
This analytical slide illustrates the optimistic projections for 2024 by business leaders, with a focus on revenue, profits, headcount, and strategic planning. It provides valuable insights for companies preparing for the year ahead and serves as a tool for strategic business planning, indicating areas of expected growth and potential changes in operational focus.
Business Outlook, Revenue Growth, Profit Expectations, Strategic Planning, Operational Focus
Multiple Chart
JP Morgan
Saved
The slide shows a stacked column chart from 2018 to 2022 representing the composition of Mainland China's e-commerce platform advertising revenue by type. The chart uses multiple shades to differentiate between types of advertising such as live, embedded, and display advertising.
Market Analysis and Trends
Retail & E-commerce
Analyzes the composition of e-commerce advertising revenue in China from 2018 to 2022, focusing on the rise of live video and e-commerce streaming. Highlights the increasing share of live advertising in the total e-commerce advertising revenue.
e-commerce, China, live video, advertising revenue, market trends
Mixed Chart
PwC/Strategy&
Saved
Slide displays bar charts reflecting investor priorities in different financial aspects with a focus on growth and resilience. Notable changes from a prior survey are indicated.
Strategic Planning
Financial Services
Discusses investor expectations for companies to focus on growth and financial resilience, particularly relevant for corporate strategy and financial planning.
growth, financial resilience, investor expectations, corporate strategy, financial planning
Single Chart
BCG
Saved
Features a bar chart showing the frequency of reviews for healthcare professional speakers. The layout is straightforward, using varying shades of green to represent different frequencies, which aids in distinguishing the data points clearly.
Regulatory and Compliance
Healthcare & Pharmaceuticals
Surveys the frequency at which healthcare organizations review their speaker rosters and contract statuses. It aims to provide insights into how often healthcare professionals are engaged and reassess their roles, contributing to better management and compliance in healthcare engagements.
speaker review, healthcare, engagement frequency, compliance, survey results
Single Chart
Deloitte
Saved
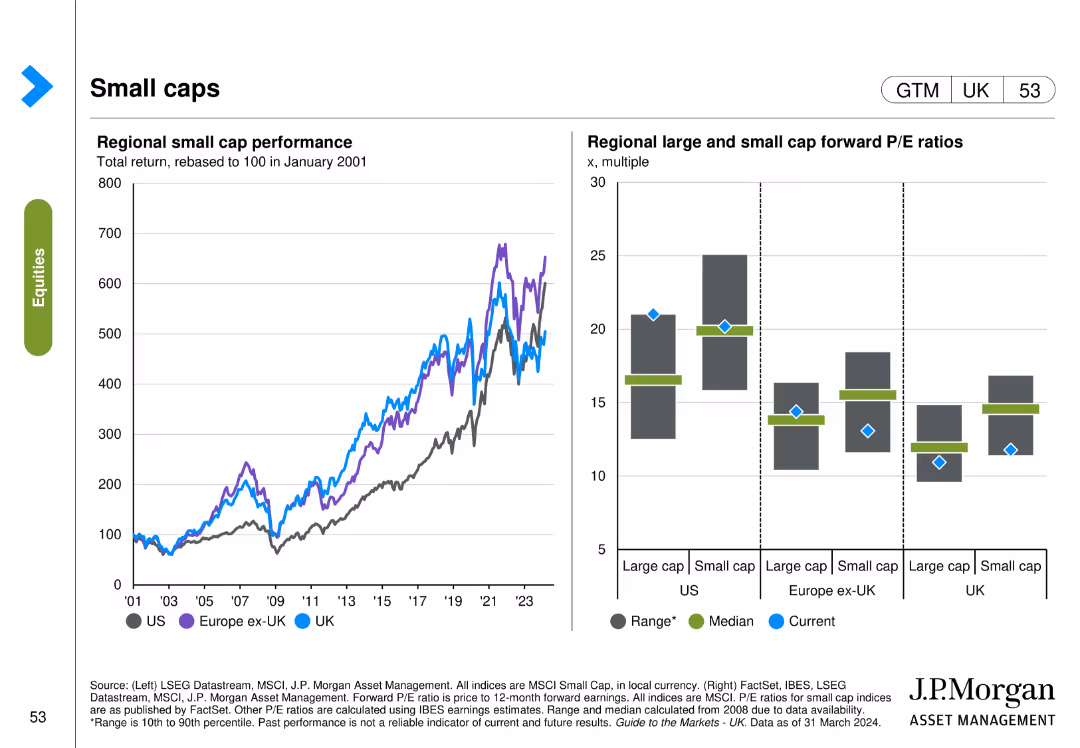
The slide features two visual elements: a line chart on the left showing regional small cap performance and a column chart on the right comparing forward P/E ratios of large and small caps across regions.
Investment Analysis
Financial Services
The slide evaluates small cap stocks by comparing their performance across regions and examining their forward P/E ratios relative to large cap stocks.
small caps, large caps, performance, P/E ratios, regional comparison, investment analysis
Multiple Chart
JP Morgan
Saved
A title slide with a large, blue numeral '7' on the right side. The slide's background is white, transitioning to a light blue gradient behind the number. Titles are in bold, sans-serif font.
Industry Overview
Financial Services
This introductory slide presents the title for a market insights report, likely used to preface a detailed financial analysis covering market trends, updates, and strategies relevant as of June 2023. It introduces the chief market strategist who will be discussing the insights.
Market, Insights, Financial, Guide, Trends, Analysis, 2023, EMEA, Strategy
Title
JP Morgan
Saved
The slide features a header, a text block on the left, and a column chart on the right. The column chart presents survey data on racial factors in patient experience, comparing agreement levels on respectful treatment, comfort in disclosing personal information, and the impact of provider's race on patient comfort, using multiple colors.
Strategic Planning
Healthcare & Pharmaceuticals
Discusses the importance of better research in reducing healthcare inequities. The column chart shows survey results on how race impacts patient experience, highlighting areas for improvement in respectful treatment, comfort in disclosing information, and patient comfort with racially concordant providers.
Healthcare, research, inequity, race, patient experience
Mixed Chart
IPSOS
Saved
Featuring a variety of visual elements, including icons, small graphs, and percentage changes. Each section of the slide is clearly delineated and it contains an awards section with associated logos.
Financial Performance
Financial Services
The slide provides a comprehensive overview of the banking and financial services offered, highlighting net profit contribution and client numbers. It includes recent awards to underscore reputation and market position, combined with quantitative data to inform on performance metrics.
banking, financial services, awards, performance, net profit, clients, growth
Mixed Chart
Morgan Stanley
Saved
Previous
Next
If nothing, comes up, please save your slides first
Create a FREE account to continue browsing
Receive Instant Access to 1,000+ slides from companies like McKinsey, Google, and Goldman Sachs
First Name
Last Name
Email
Password
I agree to all
Terms & Privacy Policy
Thank you! Your submission has been received!
Oops! Something went wrong while submitting the form.
Have an account?
Sign in
Column Chart
Heatmap
Chevron
Org Chart
Infographic
Callouts
Timeline
List
Graphic
Picture
Process Flow
Diagram
Paragraph
Map
Table
Framework
Subtitle
Takeaway Box
Icon
Other Chart
Radar Chart
Waterfall Chart
Mekko Chart
Pie Chart
Scatter Plot
Line Chart
Bar chart
Bullet points