My Account
My Slides
Search by Category
Templates
Leave Feedback
Login
Logout
Get Started
Browse all Slides
Browse all Slides
Create a FREE Account
Instant access to 1,000+ real slides from top companies like McKinsey, BCG, Goldman Sachs, Google and many more!
First Name
Last Name
Email
Password
I agree to all
Terms & Privacy Policy
Thank you! Your submission has been received!
Oops! Something went wrong while submitting the form.
Have an account?
Sign in
Saved Slides
Line chart comparing the trends in purchasing new versus resale homes from Fall 2015 to Fall 2020, with two lines representing each category.
Market Analysis and Trends
Real Estate & Construction
The slide analyzes the preferences between new and resale homes over several years, showing a shift in consumer preferences.
new homes, resale homes, purchase trends, Fall 2015-2020, consumer preferences
Single Chart
IPSOS
Saved
Slide contains a bar chart showing hydrogen production costs over time comparing grey, blue, and green hydrogen.
Investment Analysis
Energy & Utilities
Analyzes cost trends in hydrogen production, emphasizing the economic shift towards green hydrogen as a viable future investment in energy.
hydrogen, green energy, cost trends, investment analysis, energy sector
Linear Flow
McKinsey
Saved
The slide includes a scatter plot with orange dots representing different jobs, highlighting 'File clerks' and 'Landscaping workers'. It has a dual-axis showing hourly wage against the percentage of automation potential.
Risk Assessment and Management
Technology & Software
The slide analyzes the relationship between wages and automation potential across various occupations, emphasizing how both high-wage and low-wage jobs are subject to automation. It's useful for discussions on the future of work, labor economics, or presentations on technological impacts on employment.
automation, jobs, wages, scatter plot, future of work, labor economics, technology
Single Chart
McKinsey
Saved
This slide presents a comparison of IRB and standardized models through column charts, focusing on RWA and net receivables.
Risk Assessment and Management
Financial Services
Analyzes the impact of migrating US Cards portfolio to IRB models on RWAs, comparing historical data and future expectations.
IRB, US Cards, RWA, risk management, migration
Multiple Chart
Barclays
Saved
The slide includes a combination of a line chart showing gas prices and a column chart comparing TCO of Opel Corsa ICE vs. BEV. It has text in two columns with analysis and explanations.
Market Analysis and Trends
Energy & Utilities
The slide discusses the potential threat to the total cost of ownership (TCO) advantage of BEVs in Germany due to waning government incentives and rising electricity prices. It uses Opel Corsa as a case study for analysis.
BEV, TCO, Germany, Opel Corsa, incentives, analysis
Multiple Chart
PwC/Strategy&
Saved
The slide features two text sections on the left, discussing the firm’s work in creating inclusive STEM pathways in DC, and on the right, it presents a photo with a focus on technology and education. The design is professional, with a clear separation between text and imagery, and a teal accent color. A page number '27' is found on the bottom right.
Strategic Planning
Professional Services
It delves into the company’s foundation efforts in supporting underrepresented individuals in STEM fields, in partnership with several nonprofits in Washington, D.C. The slide presents how these partnerships work to break barriers and create educational and professional opportunities, with an emphasis on diversity and inclusion. It serves to illustrate the company’s broader commitment to corporate social responsibility and the impact of its foundation’s work.
STEM, inclusion, nonprofit, education, diversity, partnership
Text Only
Booz Allen Hamilton
Saved
The slide features a mix of text boxes and images. It outlines the steps and modules of the EY IPO readiness assessment program. The layout is structured with numbered sections and highlighted key points.
Strategic Planning
Professional Services
This slide explains the EY IPO readiness assessment, detailing the steps and modules involved in preparing companies for an IPO. It includes strategic planning, structure, taxes, financial preparation, and more, providing a comprehensive guide for businesses looking to go public.
IPO readiness, professional services, strategic planning, assessment program, preparation steps, EY, business planning, public listing
Header Vertical
EY
Saved
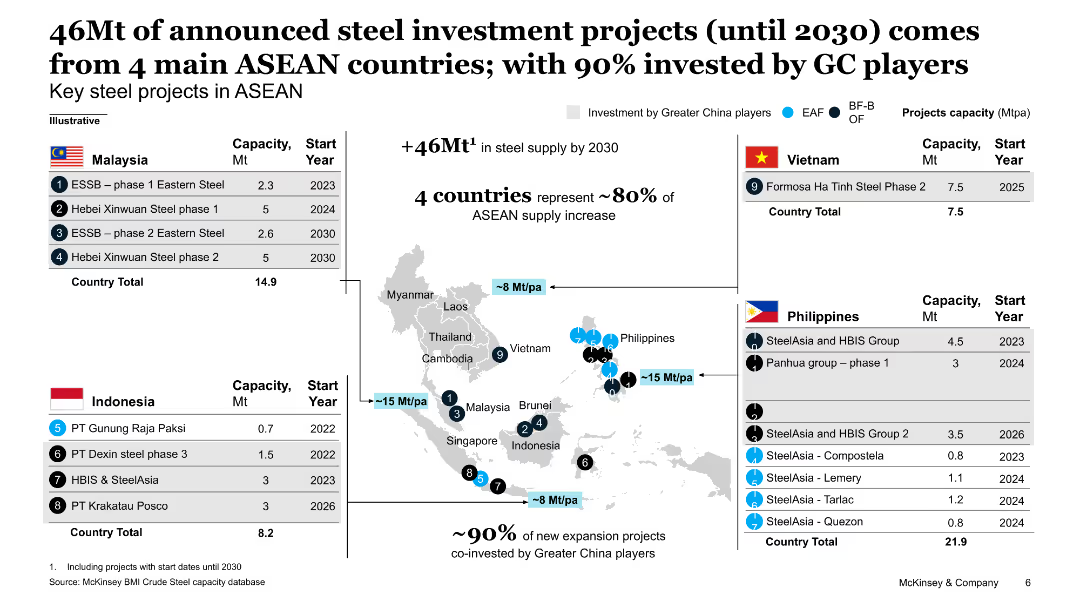
The slide includes a map highlighting key steel projects in ASEAN countries, with accompanying tables listing project capacities and start years.
Investment Analysis
Industrial & Manufacturing
This slide details 46Mt of announced steel investment projects in ASEAN countries, with specific projects listed by country, showing capacities and start years, emphasizing Chinese investment.
steel investment, ASEAN, projects, capacity, Chinese investment
Graphic
McKinsey
Saved
The slide features multiple column charts detailing quarterly performance, income distribution, and income by business with annotations and percentage changes.
Financial Performance
Financial Services
This slide presents quarterly financial performance and income breakdown of different business units within the company, showing trends and changes over the quarters.
financials, quarterly, trends, performance, income
Multiple Chart
Barclays
Saved
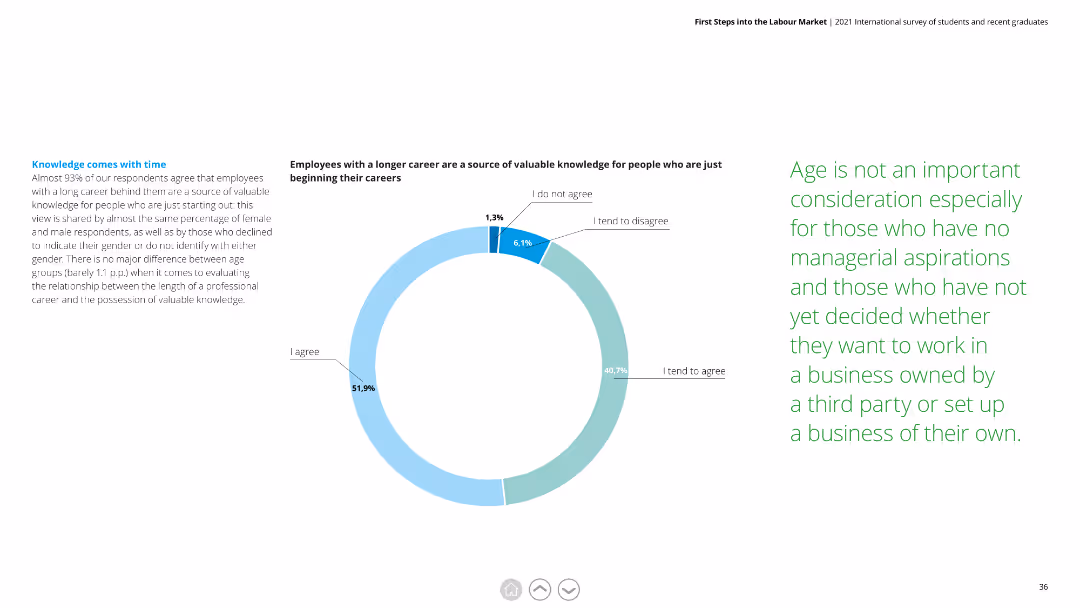
The slide features a pie chart with multiple segments. The text is organized into three distinct columns, with clear headings and subheadings. The chart uses shades of blue and green.
Market Analysis and Trends
Education & Training
Highlights that 93% of respondents agree that employees with a longer career are a valuable knowledge source. It explores the impact of career length on knowledge sharing, including gender and age differences.
knowledge, career, valuable, respondents, gender, age, knowledge sharing
Mixed Chart
Deloitte
Saved
Contains column chart and detailed financial metrics, focusing on banking and wealth management sectors.
Financial Performance
Financial Services
Evaluates financial performance in personal banking and wealth management, focusing on net income and revenues.
personal banking, wealth management, financial performance
Mixed Chart
Citigroup
Saved
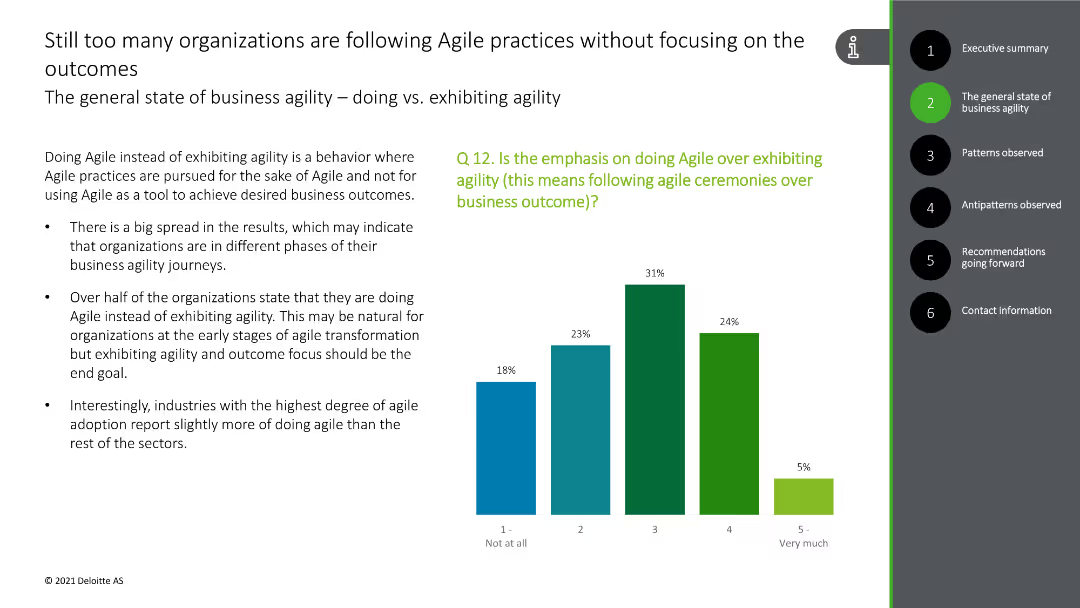
This slide contains a column chart showing the emphasis on following Agile ceremonies over outcomes, with green and blue bars.
Strategic Planning
Technology & Software
The slide discusses the focus on Agile practices rather than outcomes in many organizations, with survey data supporting this observation.
Agile practices, outcomes, focus, survey data, organizational behavior
Mixed Chart
Deloitte
Saved
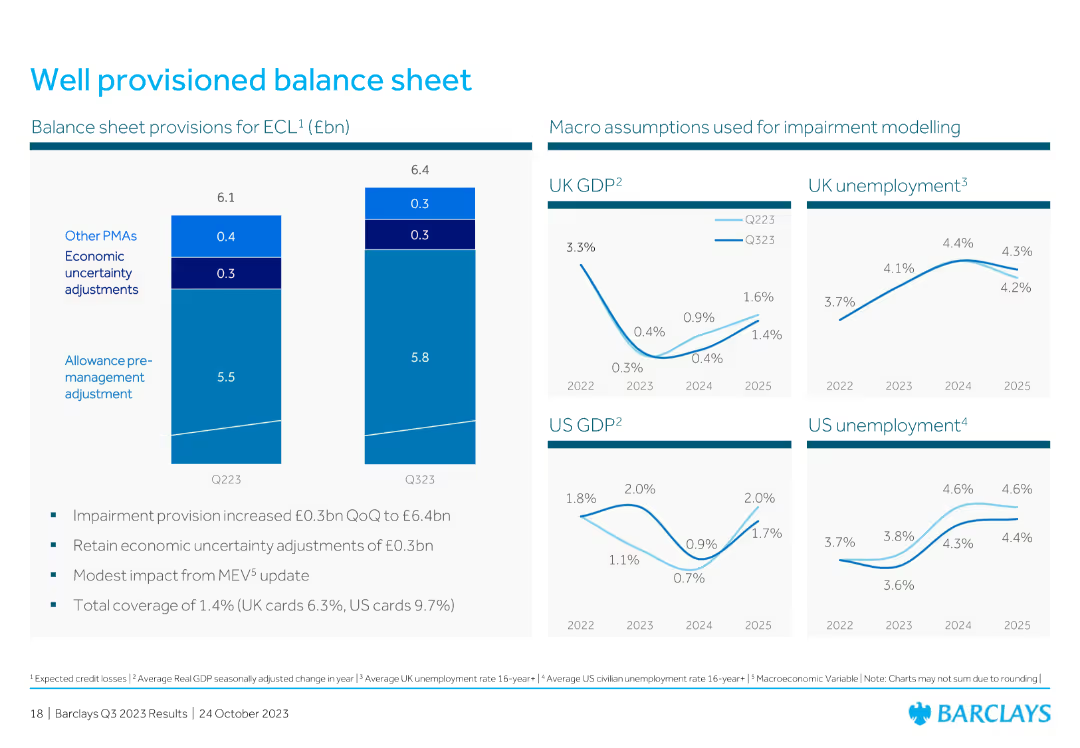
This slide features two vertical column charts and four line charts, all displaying financial data. The layout is clean and organized, with a focus on data visualization.
Financial Performance
Financial Services
The slide provides an overview of the balance sheet provisions for ECL and macro assumptions used for impairment modeling. Key metrics include UK and US GDP, and unemployment rates.
balance sheet, GDP, unemployment, provisions, financial data, impairment, macro assumptions, charts, modeling
Multiple Chart
Barclays
Saved
A detailed diagram illustrating the process of whitelisting wallets for tokenized assets, including steps like KYC/AML checks, engagement with regulators, and the role of tokenization providers, custodians, and exchanges.
Regulatory and Compliance
Financial Services
Describes an interim solution for enhancing secondary market liquidity by whitelisting wallets, detailing the process and regulatory compliance required to ensure secure and efficient trading of tokenized assets.
whitelisting, wallets, tokenization, KYC/AML, secondary market
Diagram
EY
Saved
Comparative bar charts displaying GDP growth forecasts against baseline for 2020 and 2021, offering a global perspective with specific focus on major economies.
Financial Performance
Financial Services
Offers insights into the projected global economic downturn in 2020 and recovery prospects for 2021, based on GDP growth forecasts from various sources.
GDP growth, economic forecasts, 2020 downturn, 2021 recovery, global economy, financial analysis, investment planning
Multiple Chart
BCG
Saved
Visualizes a before and after process flow for consumer goods operations, using purple and white color themes with circles and arrows connecting different stages.
Operational Efficiency
Technology & Software
Highlights the transformation in consumer goods operations due to AI implementation, focusing on efficiency and customer engagement enhancements.
consumer goods, AI integration, process transformation, efficiency, customer engagement, workflow optimization, automation, technology impact, operational improvement
Diagram
Accenture
Saved
Features a dark background and multiple horizontal bars in a gradient of warm colors representing various industries. The arrangement allows for an immediate visual comparison of data.
Product and Service Analysis
Consumer Goods
Illustrates industry-specific projections for ethically driven consumer purchases by 2026. This slide is pertinent for analyzing product and service impact in the context of ethical consumerism within different sectors.
Ethical Consumerism, Industry Analysis, 2026 Forecast, Product Impact, Service Analysis
Single Chart
Kearney
Saved
The slide includes two vertical column charts comparing survey responses from 2013 and 2022 in Japan, Sweden, GB, and South Africa.
Market Analysis and Trends
Technology & Software
The slide analyzes the increase in public concerns about technology over time in different countries.
Public disquiet, technology, survey, public opinion, technology growth
Multiple Chart
IPSOS
Saved
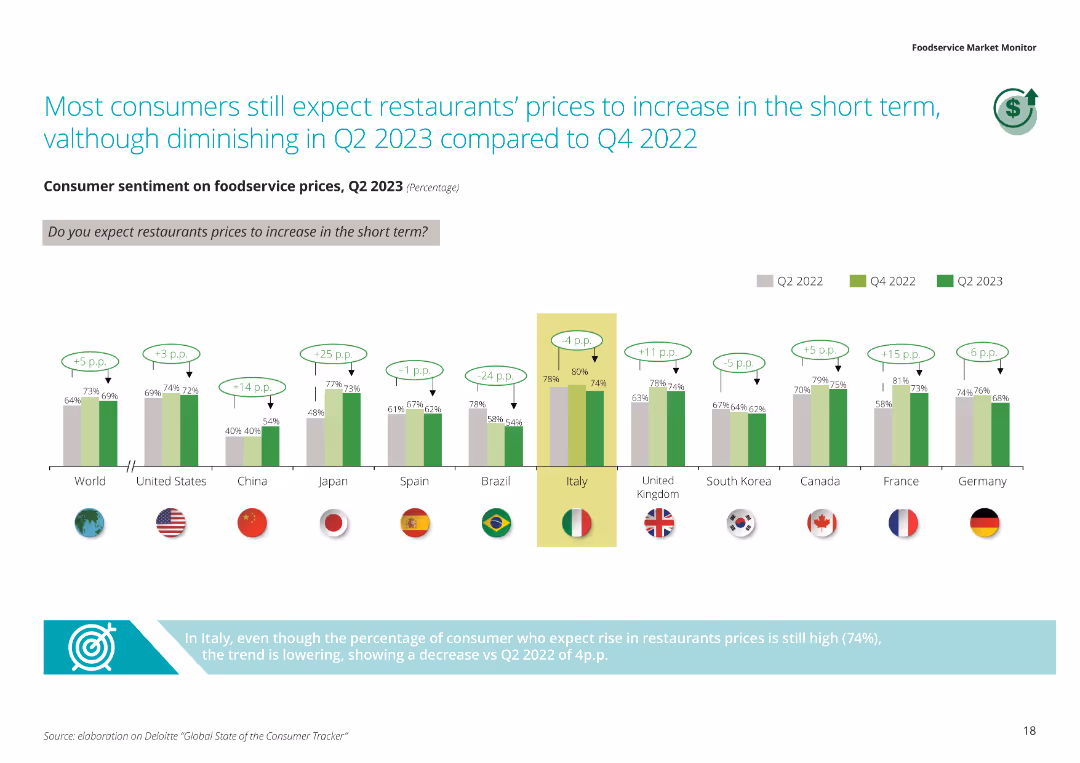
The slide features a column chart comparing consumer sentiment on foodservice prices in Q2 2023 with previous quarters, highlighting the expectations of price increases by country.
Market Analysis and Trends
Hospitality & Tourism
This slide discusses consumer expectations regarding restaurant price increases in the short term, showing a comparative analysis of sentiment across various countries and highlighting Italy's decreasing trend.
Consumer sentiment, foodservice prices, price increase, short term, country comparison
Single Chart
Deloitte
Saved
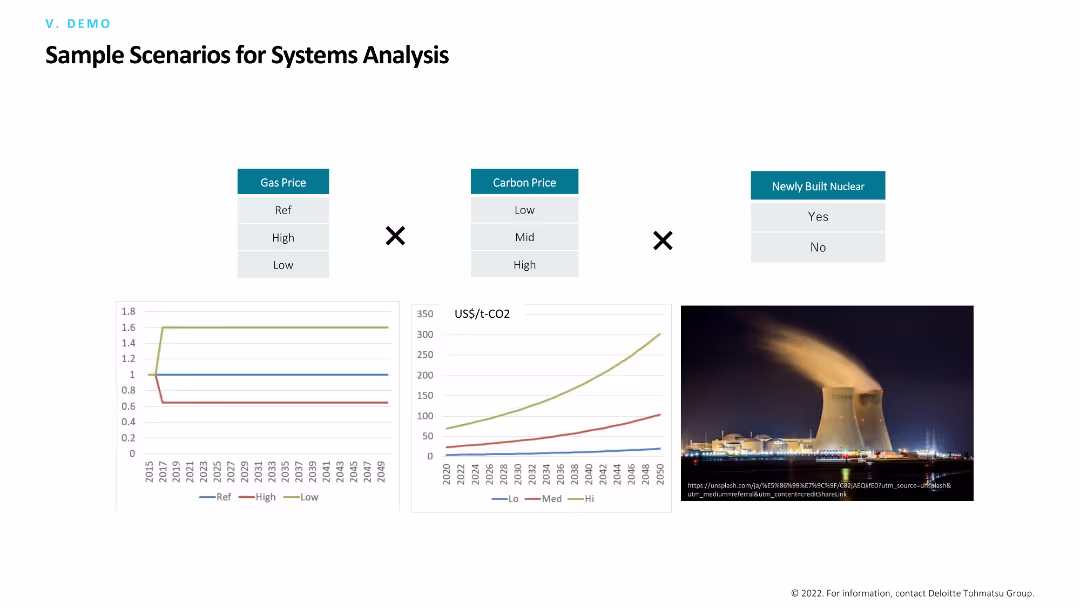
The slide compares various scenarios for systems analysis, including gas prices, carbon prices, and newly built nuclear. It features a mix of comparative tables, line charts, and an image of a nuclear power plant.
Risk Assessment and Management
Industrial & Manufacturing
The slide presents different scenarios for analyzing systems in the energy sector, focusing on how variables like gas and carbon prices, as well as nuclear infrastructure, impact overall performance and risks.
Systems analysis, scenarios, gas prices, carbon prices, nuclear
Multiple Chart
Deloitte
Saved
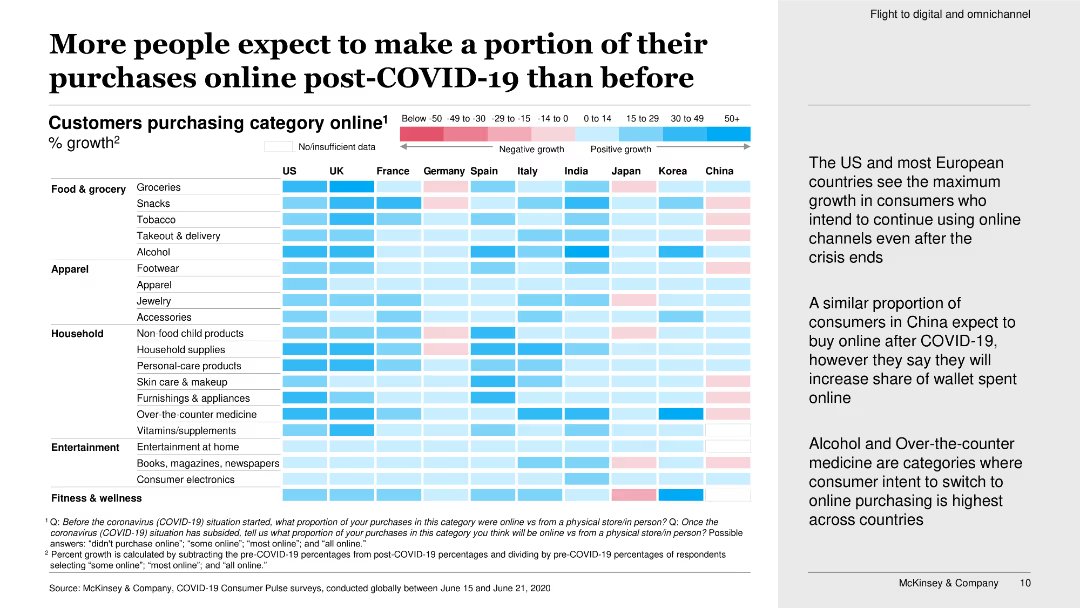
This slide features a heatmap chart showing the percentage growth of customers purchasing online in various categories post-COVID-19.
Market Analysis and Trends
Retail & E-commerce
The slide presents data on the expected increase in online purchases post-COVID-19, highlighting significant growth in online consumer behavior across multiple categories.
online purchases, post-COVID-19, growth, consumer behavior, heatmap, purchasing categories, survey, increase
Boxed
McKinsey
Saved
Timeline with icons and dates marking significant investments in battery manufacturing.
Investment Analysis
Industrial & Manufacturing
Showcases recent investments and future projections for battery manufacturing in India.
battery manufacturing, investments, India, lithium-ion, timeline
Linear Flow
PwC/Strategy&
Saved
High contrast text overlay on a dynamic office imagery background with accent highlights.
Market Analysis and Trends
Technology & Software
This slide, styled as a summary of key points, addresses misconceptions about the impact of economic downturns on real estate decisions, emphasizing complexity and evolving employer-employee dynamics. It's applicable in discussions about market analysis, real estate trends, and strategic planning within the real estate and technology sectors.
Economic Downturn, Real Estate, Market Analysis, Employer-Employee Dynamics, Trends, Strategic Planning, Misconceptions, Complexity
Agenda
EY
Saved
The slide uses multiple small images and graphics to discuss trends in food production and its environmental impacts, including charts on GHG emissions.
Market Analysis and Trends
Agriculture & Food Production
Explores significant trends in the food industry, focusing on environmental impacts and market changes, emphasizing the need for sustainable practices.
food industry, environmental impact, market trends, sustainability, GHG emissions
Boxed
Deutsche Bank
Saved
Features a strategy map outlining executive priorities.
Strategic Planning
Financial Services
Outlines the strategic priorities of C-suite executives heading into 2024, focusing on cost management, growth through price management, and expansion.
strategic priorities, cost management, growth, C-suite, expansion
Vertical Flow
BCG
Saved
Previous
Next
If nothing, comes up, please save your slides first
Create a FREE account to continue browsing
Receive Instant Access to 1,000+ slides from companies like McKinsey, Google, and Goldman Sachs
First Name
Last Name
Email
Password
I agree to all
Terms & Privacy Policy
Thank you! Your submission has been received!
Oops! Something went wrong while submitting the form.
Have an account?
Sign in
Column Chart
Heatmap
Chevron
Org Chart
Infographic
Callouts
Timeline
List
Graphic
Picture
Process Flow
Diagram
Paragraph
Map
Table
Framework
Subtitle
Takeaway Box
Icon
Other Chart
Radar Chart
Waterfall Chart
Mekko Chart
Pie Chart
Scatter Plot
Line Chart
Bar chart
Bullet points