My Account
My Slides
Search by Category
Templates
Leave Feedback
Login
Logout
Get Started
Browse all Slides
Browse all Slides
Create a FREE Account
Instant access to 1,000+ real slides from top companies like McKinsey, BCG, Goldman Sachs, Google and many more!
First Name
Last Name
Email
Password
I agree to all
Terms & Privacy Policy
Thank you! Your submission has been received!
Oops! Something went wrong while submitting the form.
Have an account?
Sign in
Saved Slides
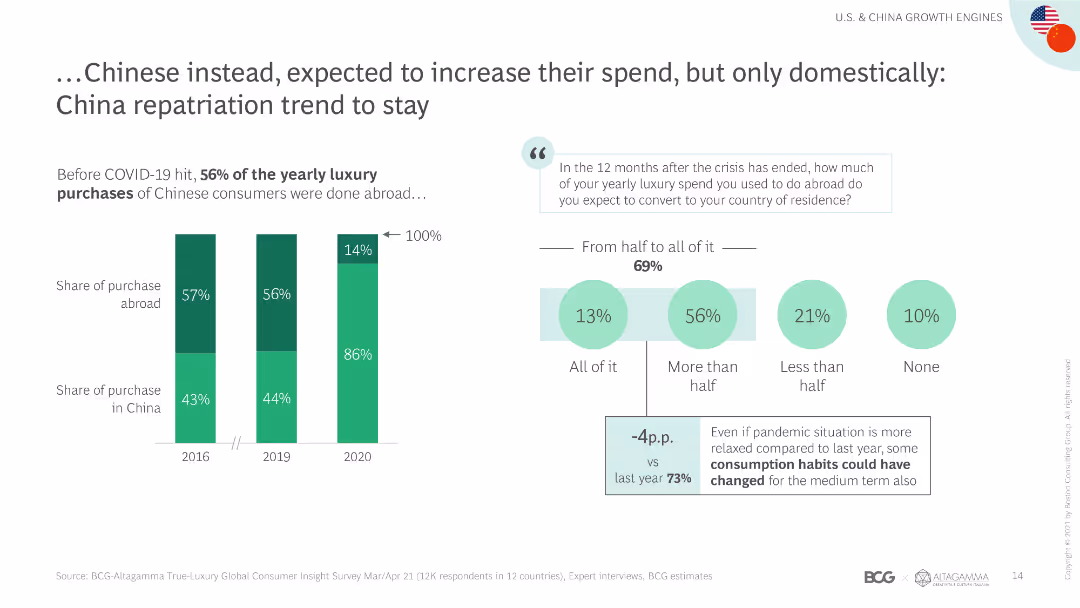
The slide includes a column chart showing the shift in luxury spending by Chinese consumers from abroad to domestic markets, with accompanying text explaining the trend.
Market Analysis and Trends
Retail & E-commerce
The slide highlights the trend of Chinese consumers increasing their luxury spending domestically, driven by repatriation and changing consumption habits post-COVID-19.
Chinese consumers, domestic spending, repatriation, luxury market, spending shift, consumption habits, market trends, COVID-19 impact, spending patterns
Mixed Chart
BCG
Saved
The slide includes two line charts, one showing nominal house prices indexed to 2015 for various countries and another showing household debt as a percentage of GDP.
Market Analysis and Trends
Financial Services
This slide presents data on house price trends and household debt levels, providing insights into consumer balance sheets and potential economic vulnerabilities.
House prices, household debt, consumer balance sheets, economic trends, GDP
Multiple Chart
JP Morgan
Saved
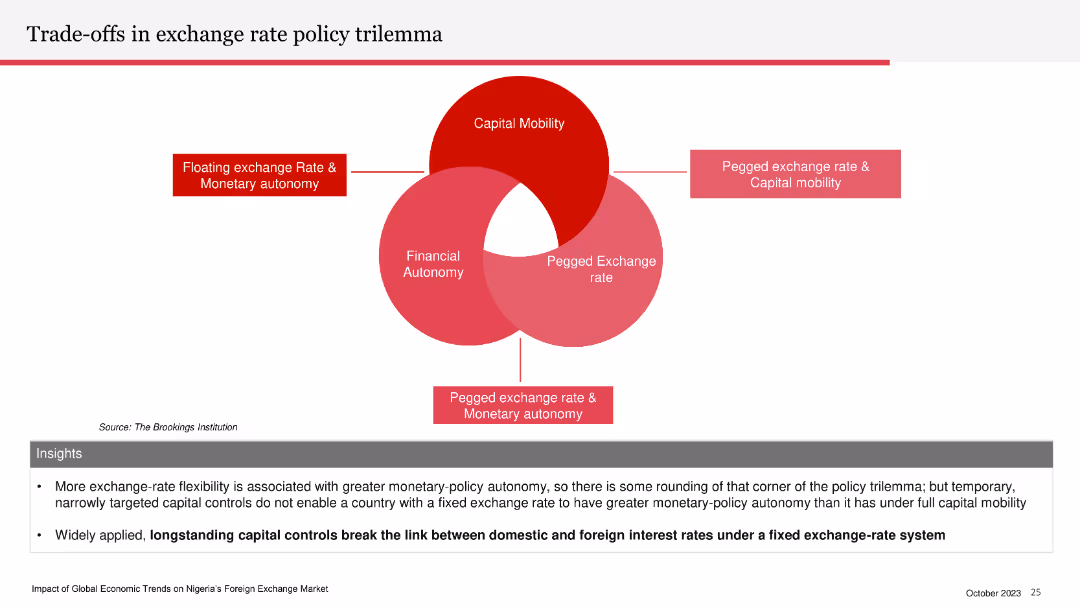
Venn diagram illustrating the exchange rate policy trilemma: capital mobility, financial autonomy, and pegged exchange rate. Insights section below.
Strategic Planning
Financial Services
The slide explains the trade-offs involved in exchange rate policy, emphasizing the limitations of having a fixed exchange rate, capital mobility, and monetary autonomy simultaneously. It highlights the impact of capital controls on interest rates.
exchange rate, policy trilemma, capital mobility, financial autonomy, pegged rate
Diagram
PwC/Strategy&
Saved
Contains multiple column charts for different digital financial service sectors, highlighting growth rates and future projections.
Market Analysis and Trends
Financial Services
Offers an overview of the flourishing digital financial services sector, with a special focus on the exponential growth in digital lending. It serves as a vital tool for financial service providers and investors to understand market trends and identify investment opportunities.
Digital Services, Lending, Growth
Multiple Chart
Bain
Saved
Slide presents bar charts showing PE/VC investment distribution in sectors like alternative proteins and mobility, with detailed annotations.
Investment Analysis
Financial Services
Explores PE/VC investment trends, focusing on alternative proteins and mobility as key investment themes.
private equity, venture capital, investment trends, startups, mobility
Mixed Chart
Bain
Saved
The slide includes column charts showing the significance of talent risk to banks, with data on various aspects like talent being one of the most significant long-term risks.
Human Resources and Talent Management
Financial Services
This slide highlights the significance of talent risk in the banking industry, emphasizing the challenges in attracting and retaining talent, and the critical role of talent in operational resilience.
talent risk, banking, column charts, long-term risks
Mixed Chart
EY
Saved
Stacked bar graphs displaying levels of employee commitment against how informed, connected, and heard they feel.
Strategic Planning
Professional Services
Analyzes the correlation between employee information, connection, and acknowledgment with their commitment to change initiatives.
commitment, employees, change, information
Multiple Chart
Bain
Saved
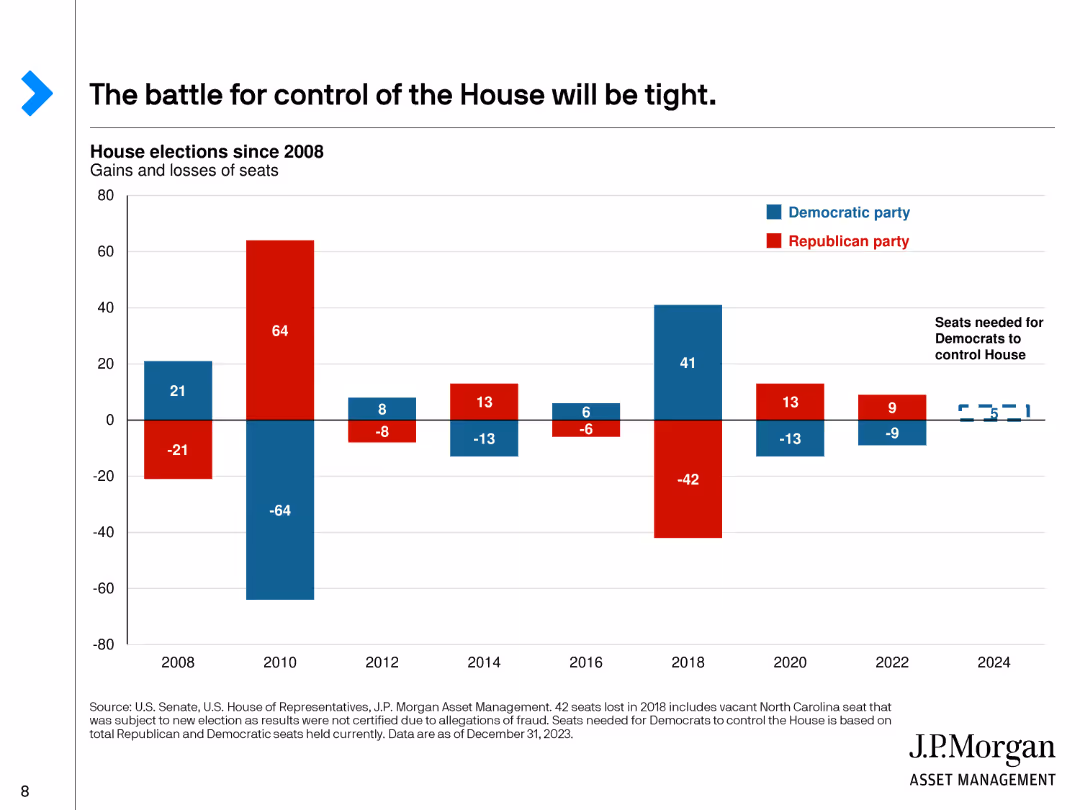
This slide features a bar chart showing the gains and losses of seats in the House of Representatives by party since 2008, with red for Republicans and blue for Democrats.
Market Analysis and Trends
Government & Public Sector
Discusses the competitive nature of the House of Representatives elections, showing historical gains and losses for each party and the current balance of power.
House, Representatives, Elections, Gains, Losses
Single Chart
JP Morgan
Saved
Diagrams and icons illustrating changes in management behavior and career path strategies within agile frameworks.
Strategic Planning
Professional Services
Outlines the extensive changes required at individual and organizational levels to adopt agile, including new roles and learning paths, essential for strategic transformation initiatives.
agile transformation, management change, professional services, strategic planning, career paths, learning development, organizational change
Header Horizontal
BCG
Saved
Includes a detailed diagram categorizing H2 production technologies by primary source and conversion technology, along with associated hydrogen categories.
Technology and Digital Transformation
Energy & Utilities
Outlines different hydrogen production technologies, categorized into thermochemical, electrolysis, microbial, and photolytic methods, and their respective applications.
Hydrogen, conversion technologies, thermochemical, electrolysis, production methods
Diagram
Kearney
Saved
Depicts execution rates of expenditure over three fiscal years using vertical thermometers, showing percentages to illustrate fiscal discipline or lack thereof.
Financial Performance
Government & Public Sector
Evaluates the effectiveness of Namibia's government expenditure over three fiscal years, highlighting trends in budget utilization and fiscal management. Useful for assessing government efficiency and fiscal health.
Expenditure, Budget, Fiscal, Efficiency
Single Chart
PwC/Strategy&
Saved
Displays bar charts and segmented columns to show potential cost savings through procurement optimization, with percentage values.
Operational Efficiency
Financial Services
Highlights potential annual cost savings through various procurement optimization strategies, with detailed cost breakdowns.
procurement, cost savings, optimization, financial impact, bar charts, column charts, percentages, strategies, savings
Multiple Chart
Kearney
Saved
Introductory slide with text and small image thumbnails representing reports. Basic complexity.
Industry Overview
Professional Services
Introduction to a thought-leadership series about consumer trends in Southeast Asia by Meta and Bain & Co.
Southeast Asia, consumer trends, Meta, Bain
Pillar
Bain
Saved
Includes three separate column charts showing forecasts for subsea equipment, services, and SURF from 2014 to 2023, with projected growth trends indicated by arrows.
Market Analysis and Trends
Energy & Utilities
Analyzes trends in offshore oil and gas investments, focusing on equipment, services, and SURF sectors, with forecasts showing growth, which could inform strategic decisions in these areas.
offshore, oil and gas, forecast, trends, investments
Multiple Chart
Barclays
Saved
Displays bullet points and column charts tracking revenue, loans, and deposits over time. The slide is dense with data and employs a range of colors to distinguish between different financial measures and periods.
Client Case Studies
Financial Services
Discusses the performance of Citi's retail banking segment, focusing on the growth of Citigold accounts and priority banking services, showcasing their impact on loans and deposits.
retail banking, Citigold, Citi, banking services, revenue growth, deposits, loans, priority banking
Multiple Chart
Citigroup
Saved
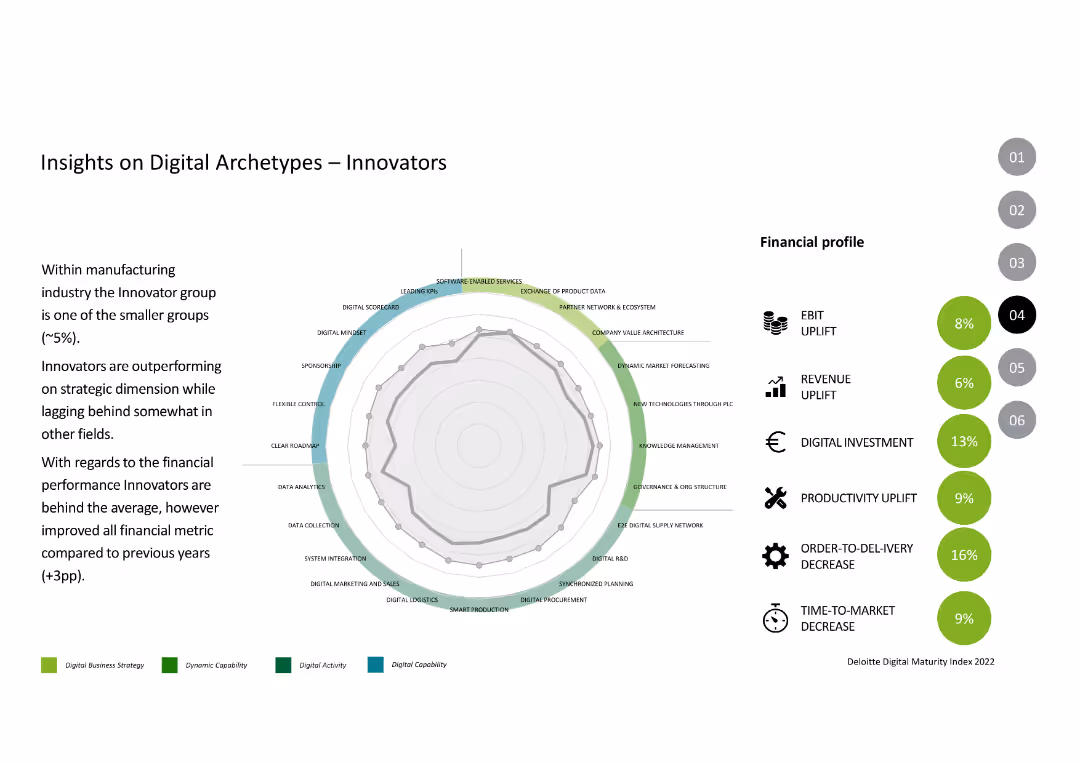
The slide features a radar chart with various parameters like digital mindset and software-enabled services, along with financial metrics such as EBIT and revenue uplift.
Competitive Landscape
Industrial & Manufacturing
This slide describes the "Innovators" archetype, focusing on their strengths in strategic dimensions and improvements in financial performance compared to previous years.
Digital Archetypes, Innovators, Performance, Digital Capabilities, Financial Metrics
Mixed Chart
Deloitte
Saved
Includes a map displaying state-wise social return on investment and family impact numbers from the NCHP.
Strategic Planning
Government & Public Sector
Evaluates the regional impact of the National Community Hubs Program, showing differences in social returns and outreach by state.
NCHP, regional impact, social return, state comparison, family outreach
Graphic
Deloitte
Saved
The slide includes a column chart tracking the historical average deposit growth across various sectors over several years.
Financial Performance
Financial Services
This slide illustrates the historical deposit growth trends, highlighting the compound annual growth rates (CAGR) for total and service deposits.
Historical, Deposit, Growth, Average, CAGR, Sectors, Financial, Trends, Performance, Analysis
Single Chart
Citigroup
Saved
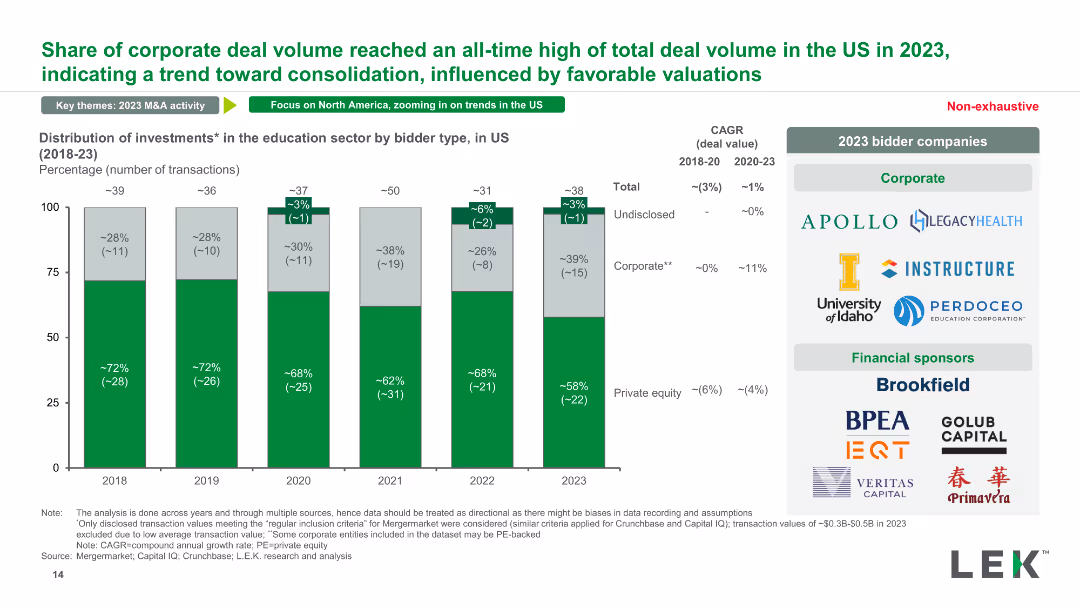
A stacked column chart illustrating the distribution of investments in the US education sector by bidder type (corporate, private equity, undisclosed) from 2018 to 2023.
Market Analysis and Trends
Education & Training
This slide categorizes investments in the US education sector by bidder type, showing trends in corporate versus private equity participation and their respective transaction volumes.
investments, US education, bidder type, corporate, private equity
Mixed Chart
LEK
Saved
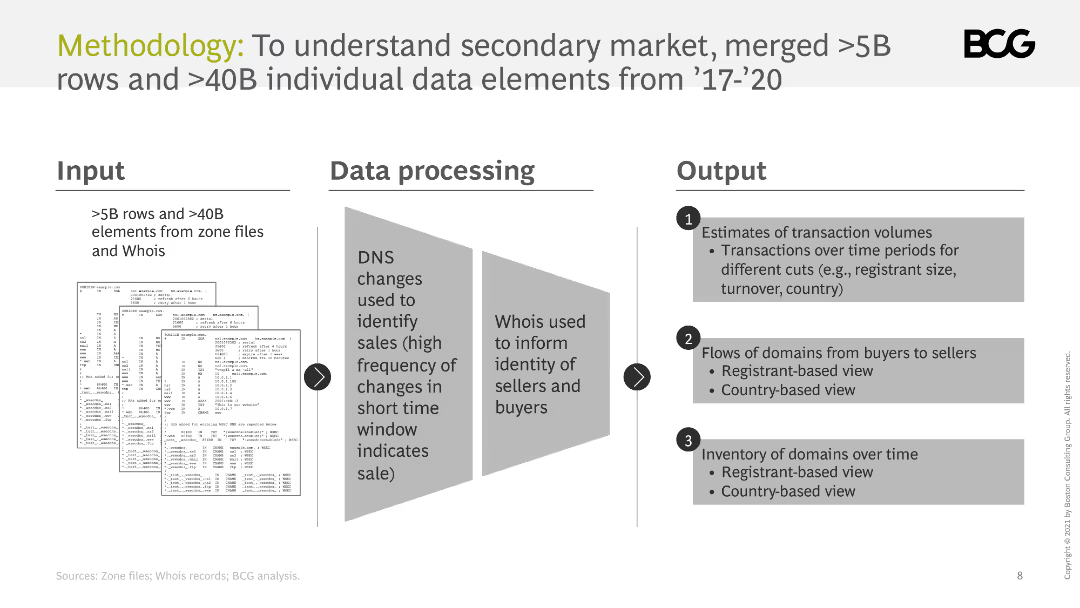
The slide outlines the methodology for understanding the secondary market, including inputs, data processing, and outputs. It uses diagrams to illustrate the process.
Technology and Digital Transformation
Professional Services
It describes the methodology used to analyze the secondary market, including data sources, processing techniques, and the types of outputs generated.
methodology, data processing, secondary market, analysis, inputs, outputs
Linear Flow
BCG
Saved
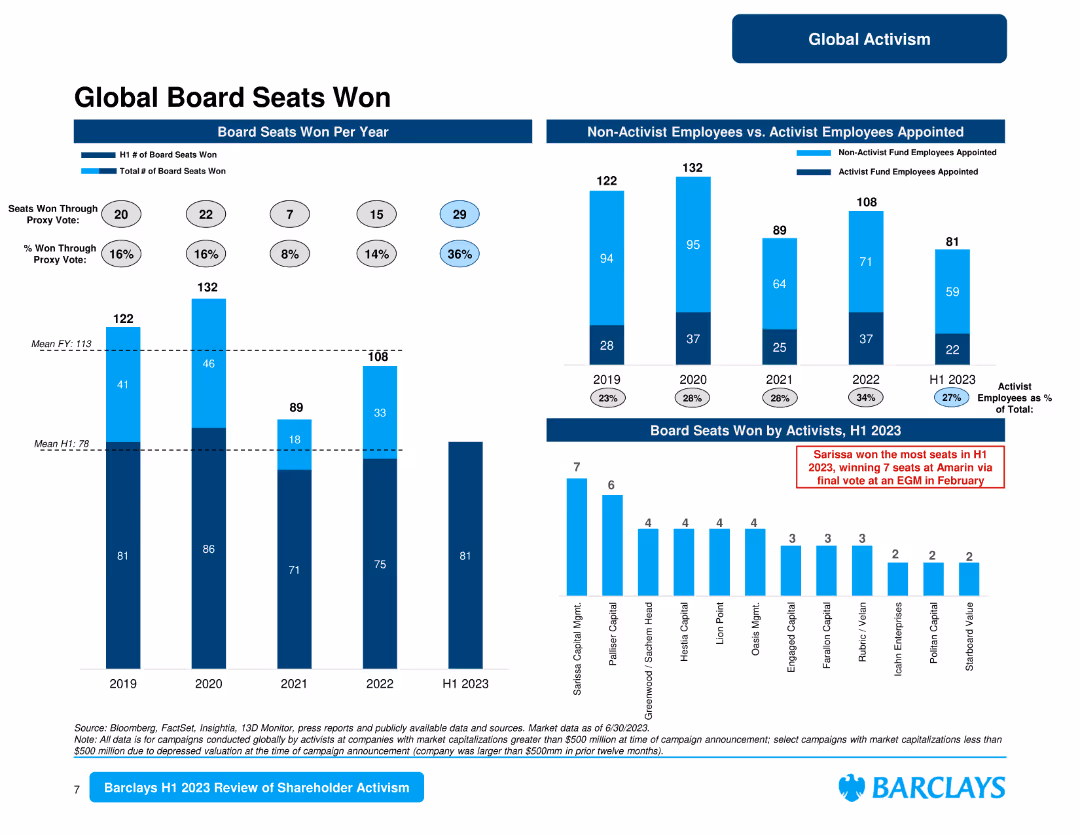
The slide contains multiple column charts depicting the number of board seats won by activists and non-activist employees appointed. It provides a clear visual comparison of board seat activities over the years.
Competitive Landscape
Financial Services
Highlights the board seats won by activist investors, providing a comparison of annual data and focusing on the most successful activists and their influence on corporate boards.
board seats, activists, annual comparison, corporate boards, successful activists
Multiple Chart
Barclays
Saved
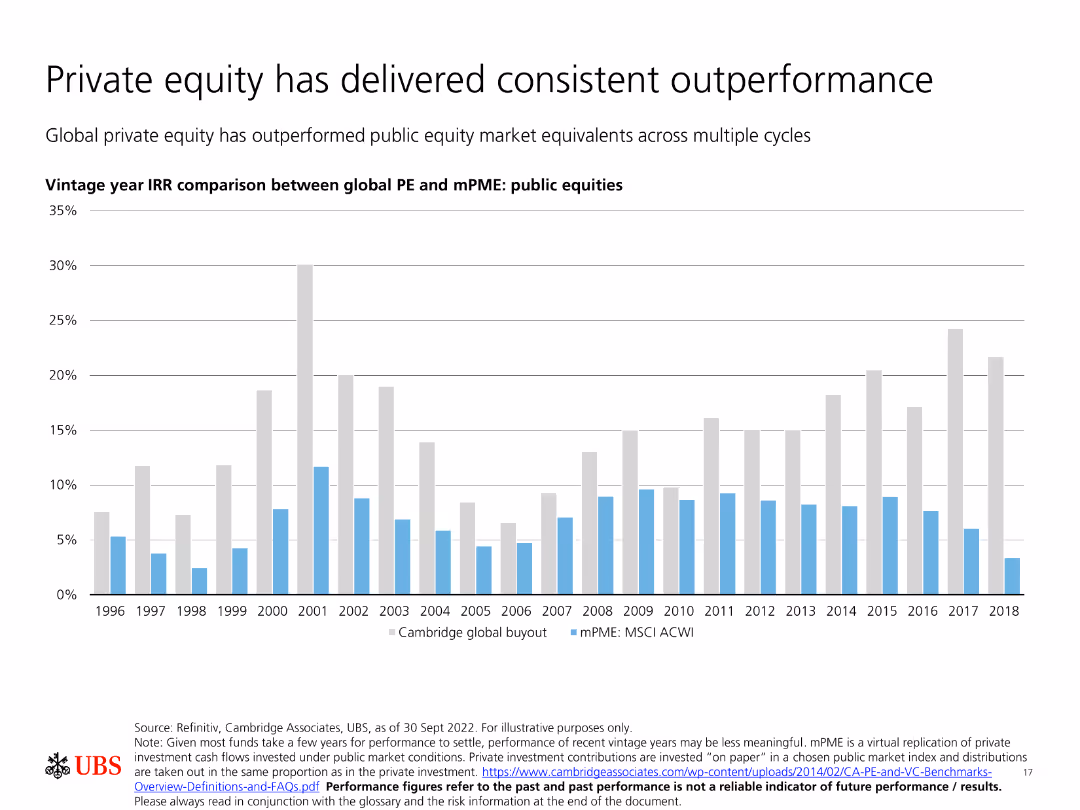
Contains a bar chart comparing vintage year IRR between global PE and mPME public equities, emphasizing private equity’s consistent outperformance.
Investment Analysis
Financial Services
Shows that private equity has consistently outperformed public equity market equivalents across multiple cycles, as demonstrated by vintage year IRR comparisons.
Private equity, outperformance, vintage year IRR, public equities, investment cycles
Single Chart
UBS
Saved
Showcases quotes from global leaders on globalization, arranged in two columns for proponents and opponents.
Organizational Structure and Change
Professional Services
Presents contrasting viewpoints on globalization from world leaders, highlighting their perspectives on economic and social impacts.
globalization, world leaders, economic impact, social impact, global policy
Mixed Chart
Roland Berger
Saved
Comprises a large pie chart detailing loan compositions across various sectors, color-coded for clarity. Key highlights provide insights into risk management and sector allocation.
Risk Assessment and Management
Financial Services
Provides an overview of the loan distribution by sector, highlighting the diversity and risk associated with different segments. It offers insights into risk management practices and strategic loan portfolio diversification within a financial institution.
loans, risk management, financial, diversification, sectors
Mixed Chart
Deutsche Bank
Saved
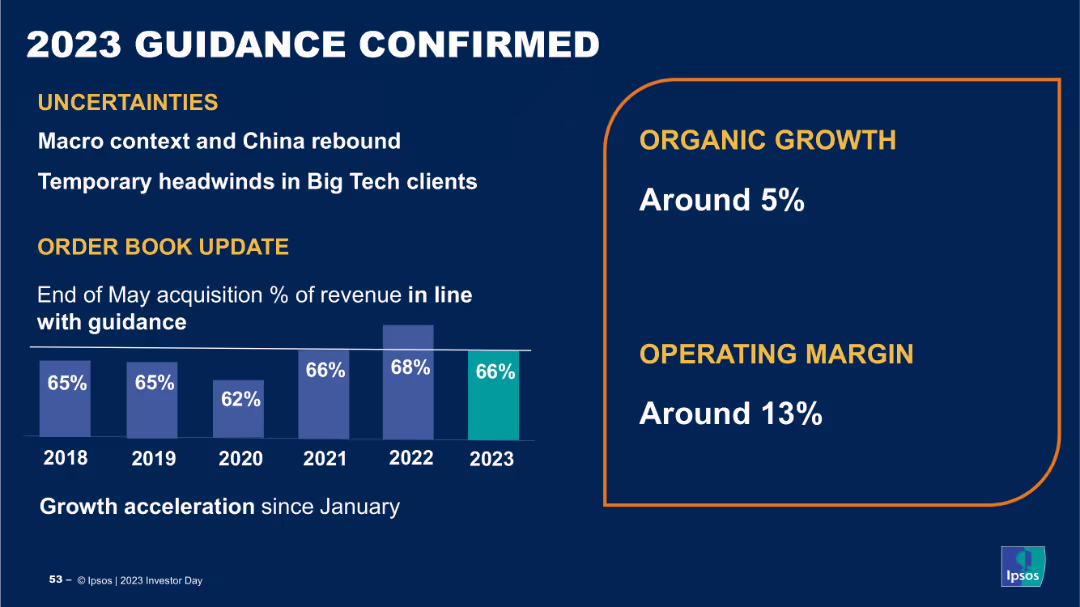
The slide contains a column chart showing percentage of revenue over years from 2018 to 2023, and a section with growth and operating margin percentages. The layout is structured and uses clear data visualizations.
Strategic Planning
Financial Services
The slide confirms Ipsos' 2023 guidance, highlighting uncertainties, organic growth, and operating margin targets, providing an update on order book and revenue projections, indicating stability and future growth prospects.
guidance, revenue, growth, operating margin, projections
Mixed Chart
IPSOS
Saved
Previous
Next
If nothing, comes up, please save your slides first
Create a FREE account to continue browsing
Receive Instant Access to 1,000+ slides from companies like McKinsey, Google, and Goldman Sachs
First Name
Last Name
Email
Password
I agree to all
Terms & Privacy Policy
Thank you! Your submission has been received!
Oops! Something went wrong while submitting the form.
Have an account?
Sign in
Column Chart
Heatmap
Chevron
Org Chart
Infographic
Callouts
Timeline
List
Graphic
Picture
Process Flow
Diagram
Paragraph
Map
Table
Framework
Subtitle
Takeaway Box
Icon
Other Chart
Radar Chart
Waterfall Chart
Mekko Chart
Pie Chart
Scatter Plot
Line Chart
Bar chart
Bullet points