My Account
My Slides
Search by Category
Templates
Leave Feedback
Login
Logout
Get Started
Browse all Slides
Browse all Slides
Create a FREE Account
Instant access to 1,000+ real slides from top companies like McKinsey, BCG, Goldman Sachs, Google and many more!
First Name
Last Name
Email
Password
I agree to all
Terms & Privacy Policy
Thank you! Your submission has been received!
Oops! Something went wrong while submitting the form.
Have an account?
Sign in
Saved Slides
Column charts comparing the number of aircraft purchases and sales over several years.
Financial Performance
Transportation & Logistics
Showcases Aircastle's aircraft management strategy, highlighting buying and selling trends to optimize portfolio.
aircraft, management, strategy, sales, purchases, financial performance
Mixed Chart
Deutsche Bank
Saved
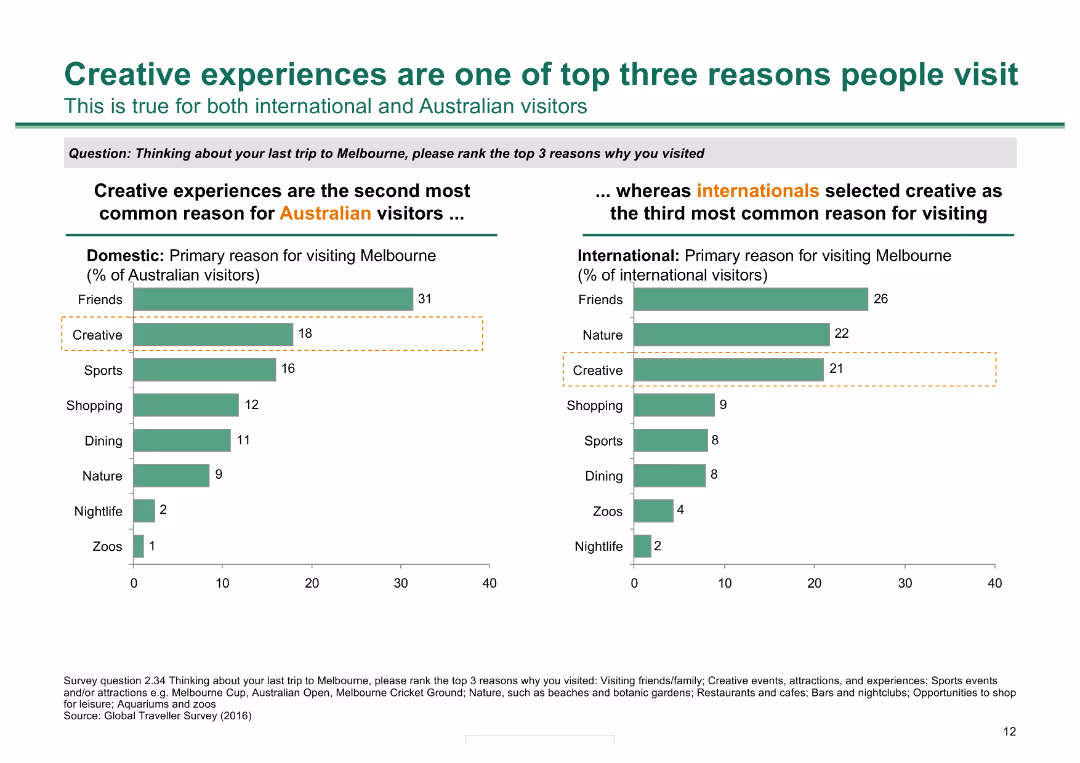
Two column charts: one showing reasons for visiting Melbourne for Australian visitors and the other for international visitors, highlighting creative experiences as a key reason.
Market Analysis and Trends
Hospitality & Tourism
The slide examines the top reasons for visiting Melbourne among domestic and international visitors, emphasizing the significance of creative experiences for both groups.
creative experiences, Melbourne, visitors, reasons, domestic, international, tourism, market analysis, trends
Multiple Chart
BCG
Saved
A line graph showing the frequency of strategy topics in earnings calls over time. Text discusses the evolution of strategic focus among CEOs and senior leadership teams.
Strategic Planning
Technology & Software
This slide highlights the renewed focus on strategy among CEOs, with a line graph illustrating the increasing mention of strategy topics in earnings calls.
Strategy, Leadership, Earnings Calls, Evolution, Strategic Focus
Mixed Chart
Accenture
Saved
Diagram plotting the likelihood and impact of selected technological innovations in health and medicine by 2050, such as the end of cancer, bionic eyes, and gene editing.
Technology and Digital Transformation
Healthcare & Pharmaceuticals
The slide highlights the potential for technological innovations to advance medical progress and improve human health by 2050. It plots various medical breakthroughs in terms of their likelihood and impact, emphasizing the transformative effects these innovations could have on eradicating diseases and enhancing the quality of life.
Medical Progress, Health Innovations, 2050
Mixed Chart
Roland Berger
Saved
Lists modular offerings with a column chart showing market penetration.
Market Analysis and Trends
Financial Services
Highlights comprehensive digital solutions for small businesses, focusing on modular and personalized offerings.
small businesses, digital solutions, market penetration, modular offerings, efficiency
Mixed Chart
UBS
Saved
The slide contains multiple column charts, each with three groups (Detractors, Passives, Promoters) depicting percentages from 2014 to 2018, reflecting reluctance or recommendation for US businesses expanding in France. Red highlights and quotes complement the data.
Market Analysis and Trends
Professional Services
This slide provides a yearly breakdown of American investor sentiments towards business expansion in France, using Net Promoter Scores to highlight varying levels of enthusiasm or reluctance over five years.
investment, France, business expansion, NPS, American investors
Mixed Chart
Bain
Saved
The slide has a white background with blue circles and lines outlining three triggers for regime changes: new solvency framework, new regulatory intervention level, and significant revisions to the existing framework. Each trigger is described with a brief explanation in blue text.
Regulatory and Compliance
Financial Services
This slide outlines the triggers for regime changes in the financial sector, including new solvency frameworks, regulatory intervention levels, and revisions to existing frameworks, providing a structured approach to understanding these changes.
regime change, triggers, solvency, regulatory, compliance
Framework
Oliver Wyman
Saved
Contains line graphs representing the value-at-risk and stressed value-at-risk metrics over multiple quarters, with comparative data.
Risk Assessment and Management
Financial Services
Analyzes the bank's financial risk metrics, specifically value-at-risk and stressed value-at-risk, to gauge risk management effectiveness over time.
risk, VaR, sVaR, banking, metrics, management, analysis, financial
Multiple Chart
Deutsche Bank
Saved
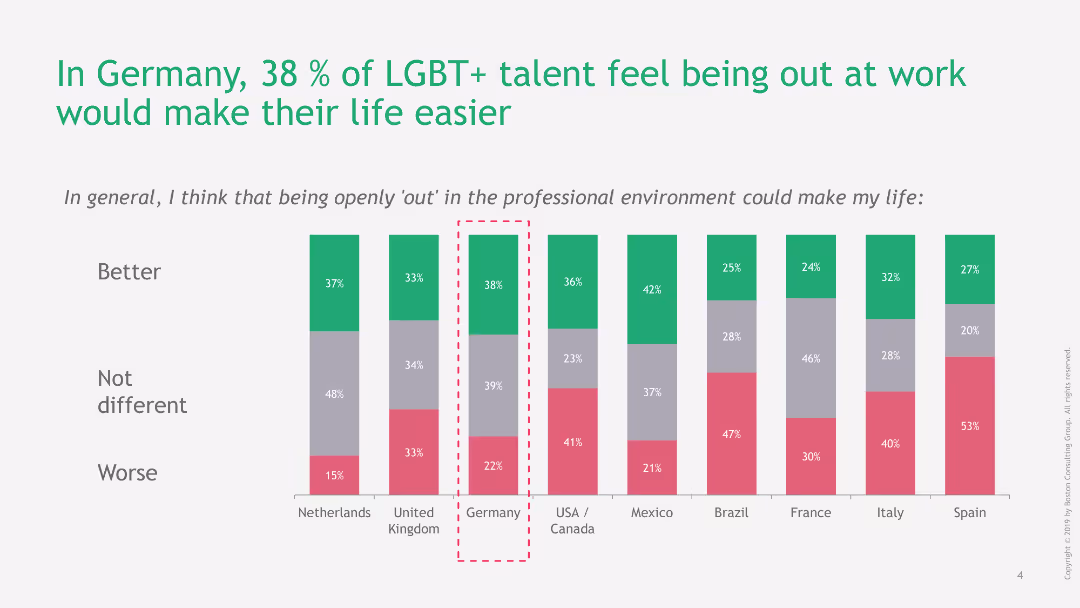
Column chart showing percentages of LGBT+ talents' opinions on how being out would affect their work life. Green, gray, and red bars represent different impacts.
Regulatory and Compliance
Professional Services
The slide presents data on the perceived impact of being openly out at work among LGBT+ talents, with a focus on Germany where 38% feel it would improve their life.
LGBT+, Germany, workplace, diversity, life impact
Single Chart
BCG
Saved
A line chart displaying trends in GDP per capita from 2011 to 2016 for several US metro areas, each represented by a different colored line, with highlighted points for areas like San Francisco and Washington DC.
Financial Performance
Transportation & Logistics
Analyzes economic growth in U.S. metropolitan areas through GDP per capita over time, highlighting regions with significant changes. Useful for economic planning and assessment.
GDP, economic growth, metro areas, US, trends, financial analysis
Single Chart
BCG
Saved
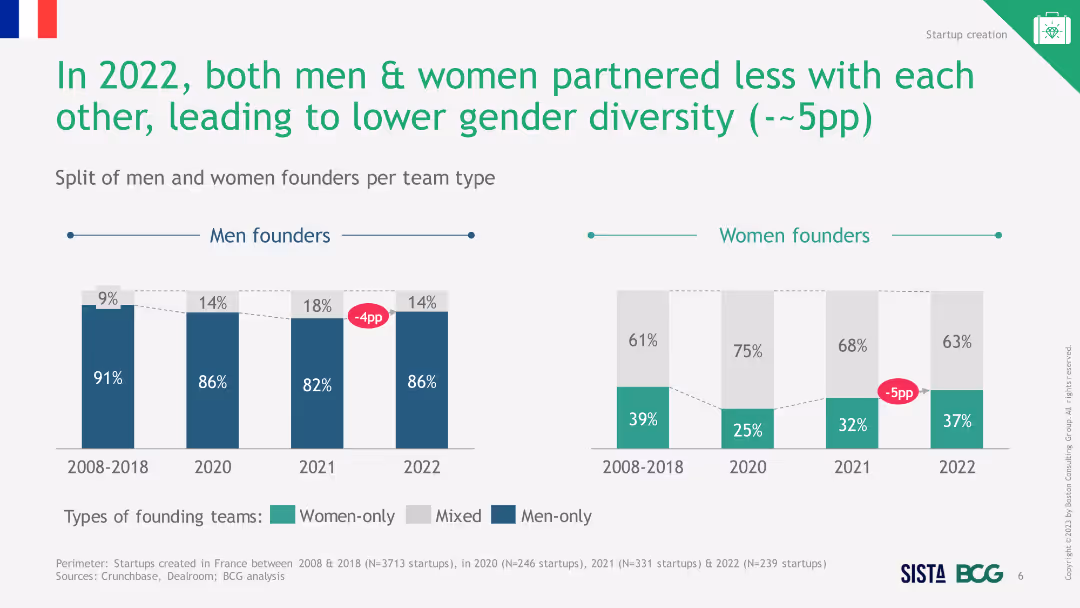
Text and column chart showing the distribution of team types for startups by gender in 2022, highlighting solo and group startups for men and women.
Market Analysis and Trends
Professional Services
The slide indicates that fewer women start businesses solo compared to men and highlights the disparity in partnership types by gender.
women entrepreneurs, solo business, gender disparity
Multiple Chart
BCG
Saved
Includes a line chart detailing the historical and projected demand drivers for iron ore, marked against steel and scrap consumption.
Market Analysis and Trends
Industrial & Manufacturing
The slide analyzes the past and future challenges of the iron ore industry, highlighting the influence of steel demand and scrap consumption on iron ore demand.
iron ore, challenges, steel demand, scrap consumption, line chart
Multiple Chart
McKinsey
Saved
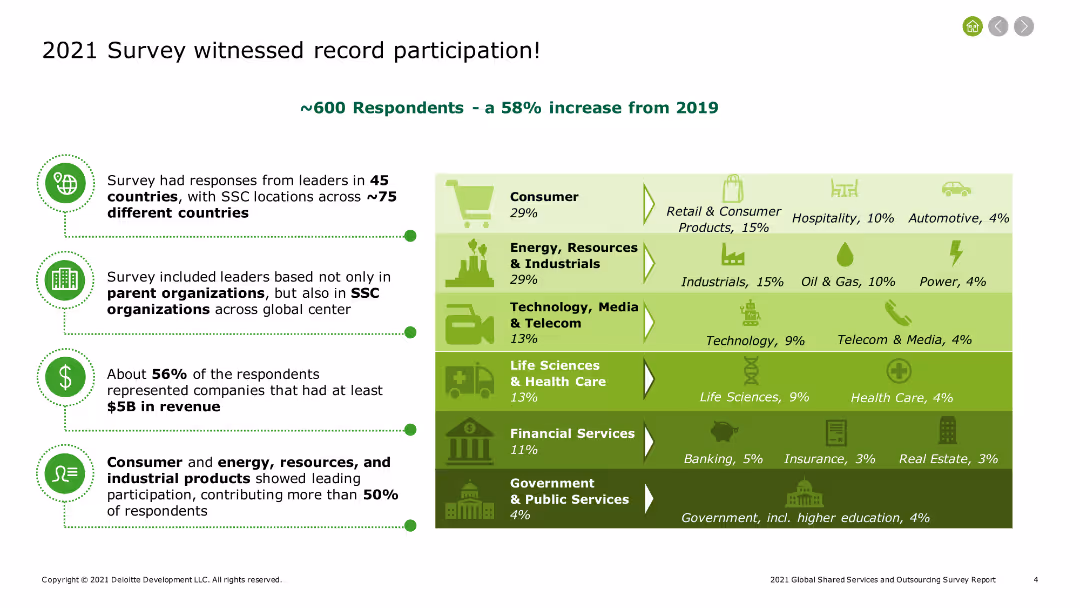
The slide includes a summary of survey participation, with key points highlighted in bullet form on the left and a stacked bar chart on the right showing the distribution of respondents across various industries such as consumer products, energy, and technology.
Industry Overview
Professional Services
The slide summarizes the 2021 survey participation, noting a 58% increase from 2019. It highlights the diverse representation from different industries and companies with substantial revenue, providing a broad overview of the survey demographics and industry engagement.
Survey participation, industry overview, respondent distribution, 2021 survey, consumer products, energy, technology, revenue analysis, survey demographics
Table
Deloitte
Saved
A highlighted map of Europe with key strategy points listed to the left, and a descriptive heading at the top. Neat layout with icons and colored text boxes.
Strategic Planning
Financial Services
Focuses on the growth and strategic positioning within the developed European markets, outlining opportunities and initiatives to strengthen the company's presence.
Strategy, Europe, market growth, development, positioning
Table
Goldman Sachs
Saved
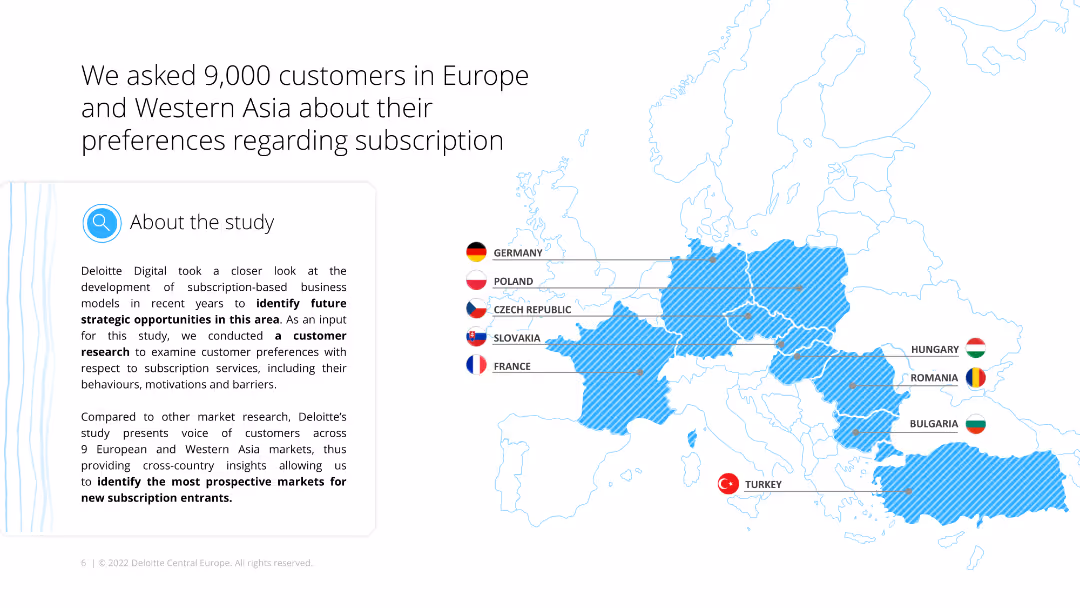
The slide has a map of Europe and Western Asia with country names and flags, indicating regions where the survey was conducted. A text box provides an overview of the study's purpose and methodology.
Customer and Market Segmentation
Consumer Goods
The slide provides an overview of a study conducted with 9,000 customers across Europe and Western Asia, focusing on their preferences regarding subscription services.
study overview, Europe, Western Asia, subscription, preferences
Graphic
Deloitte
Saved
This slide includes a column chart depicting debt underwriting net revenues over time, with specific figures for selected years. Beneath, a league table ranking is provided for different types of debt.
Financial Performance
Financial Services
The slide highlights the growth in debt underwriting net revenues, demonstrating the company's successful execution of strategic focus and improved competitive position. League table rankings in various debt categories are shown to depict market standing.
Debt, Underwriting, Growth, Revenue, Competitive, Rankings, Strategy
Single Chart
Goldman Sachs
Saved
This slide presents graphical representations of RWA density and the impact of IRB on Barclays' strategy. It uses color contrasts to highlight different years and projected outcomes, with a clear, organized layout that facilitates comprehension of complex regulatory impacts.
Regulatory and Compliance
Financial Services
Outlines Barclays' strategic responses to regulatory requirements, focusing on how the bank plans to manage and mitigate the impact of increased risk-weighted assets due to IRB regulations.
regulatory impact, IRB, risk management, strategic response
Mixed Chart
Barclays
Saved
This slide features a column chart breaking down the global foodservice market by ownership and geography for 2022. Different colors represent chains and independent establishments, with a yellow highlight on Italy.
Market Analysis and Trends
Hospitality & Tourism
This slide discusses the market share and growth of chain restaurants globally, emphasizing the significant growth driven by North America. It provides a geographical breakdown of market share for chains vs. independent establishments.
Chains, market share, growth, foodservice, geographical breakdown
Mixed Chart
Deloitte
Saved
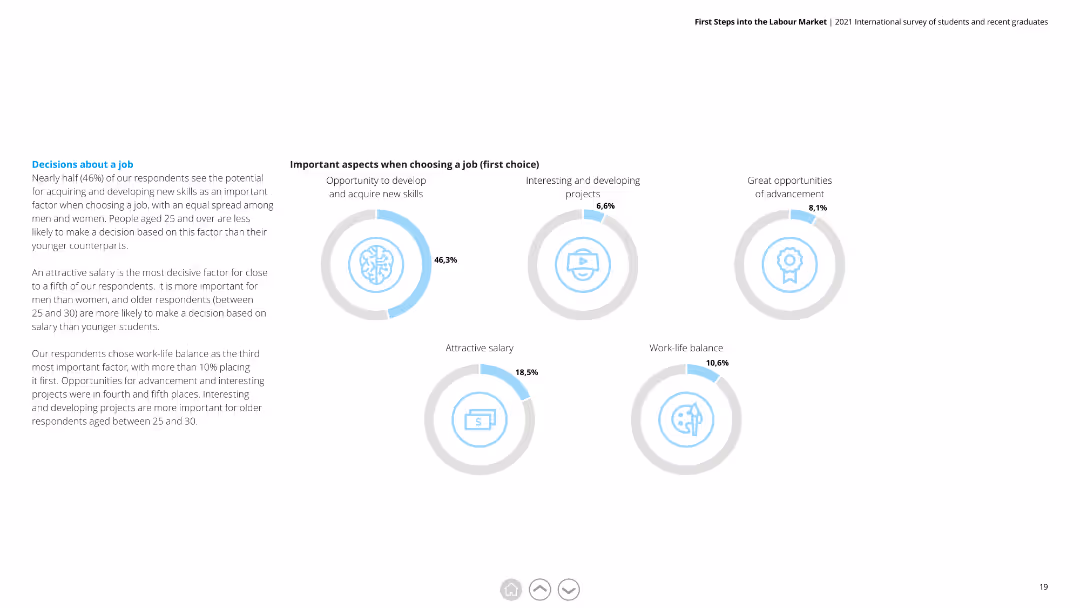
Circular diagrams showing percentages for various factors when choosing a job, including skill development and salary.
Market Analysis and Trends
Professional Services
Highlights key considerations for job selection among respondents, with a focus on skill acquisition, interesting projects, and salary.
Job Selection, Factors, Skill Development, Salary, Projects, Considerations
Multiple Chart
Deloitte
Saved
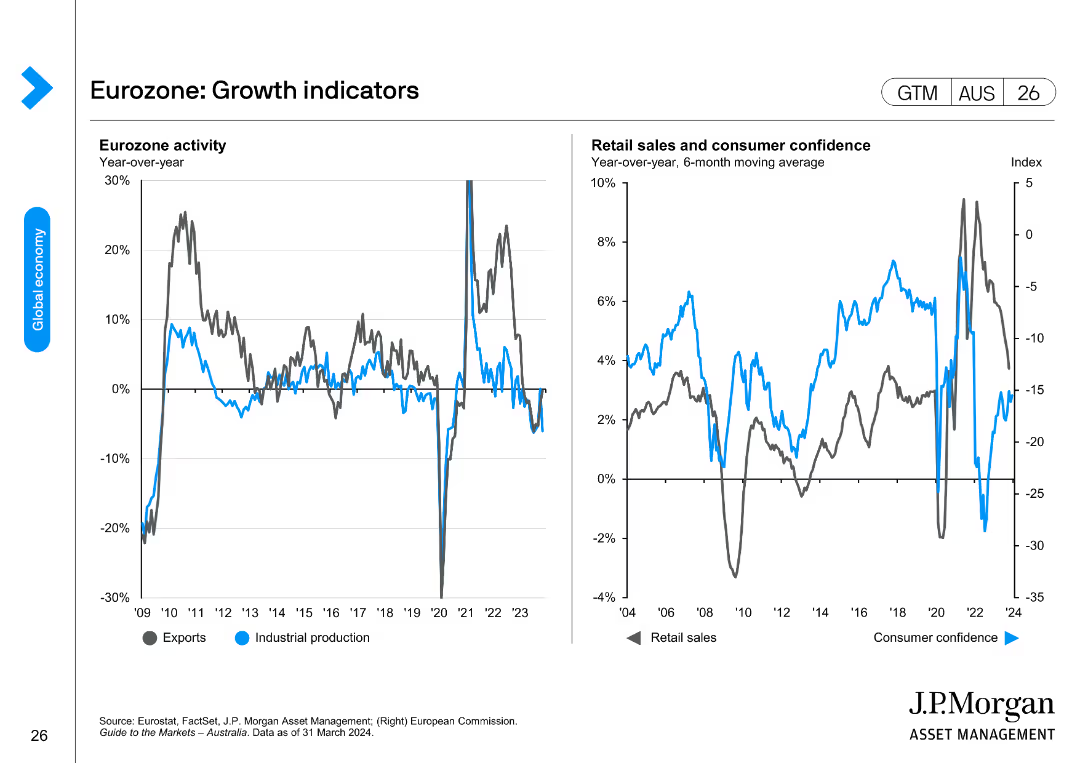
Two line charts depicting Eurozone activity through exports and industrial production, and retail sales and consumer confidence trends.
Market Analysis and Trends
Financial Services
This slide provides insights into the Eurozone's economic activity and growth indicators, focusing on exports, industrial production, retail sales, and consumer confidence.
Eurozone, growth indicators, exports, industrial production, retail sales, consumer confidence
Multiple Chart
JP Morgan
Saved
This slide features line charts showing U.S. goods imports by country, a bar chart showing global manufacturing wages, and a column chart displaying inward foreign direct investment by country.
Market Analysis and Trends
Financial Services
The slide examines global supply chain dynamics, including U.S. import sources, manufacturing wages, and foreign direct investment patterns, providing insights into global trade and economic reorganization.
global supply chain, U.S. imports, manufacturing wages, foreign direct investment, global trade, economic reorganization
Multiple Chart
JP Morgan
Saved
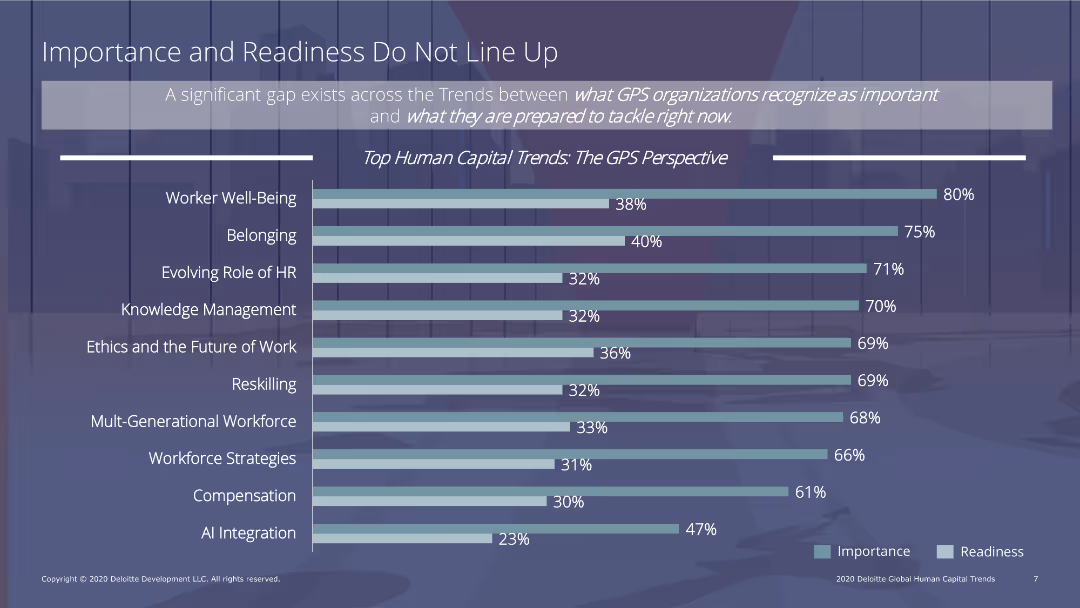
The slide features a column chart comparing the importance and readiness of various human capital trends, such as worker well-being, belonging, and reskilling. Text sections provide context and analysis.
Human Resources and Talent Management
Professional Services
The slide addresses the gap between the importance and readiness of human capital trends in GPS organizations, with a column chart illustrating disparities in areas like worker well-being, belonging, and reskilling.
human capital, readiness, importance, GPS organizations, trends
Single Chart
Deloitte
Saved
The slide features several pie charts on loan distribution by type and geography and a comprehensive table summarizing the loan portfolio.
Risk Assessment and Management
Financial Services
Delivers a snapshot of the credit risk associated with the loan portfolio, showing loan sizes, security, and sectoral and geographical spread. Used in risk management to evaluate and discuss loan distributions and associated credit risks.
Credit Risk, Loan Portfolio, Corporate, Wealth Management, Real Estate, Consumer, Geographic Distribution, Loan Security, Key Metrics, Total Loans
Multiple Chart
Goldman Sachs
Saved
This slide features a pie chart and a column chart detailing the segmentation of EO optical high-resolution market by industry. The layout is structured, containing explanatory texts and data labels.
Market Analysis and Trends
Environmental Services & Sustainability
The slide presents a detailed analysis of the EO downstream market shift towards higher resolution data and its implications on various industries. It’s useful for understanding market segmentation and potential data service opportunities.
high-resolution data, market shift, industry segmentation, data services, open data
Multiple Chart
PwC/Strategy&
Saved
World map with colored countries indicating different growth rates in entertainment and media expenditures from 2019 to 2023.
Market Analysis and Trends
Media & Entertainment
Predicts the growth rates in entertainment and media expenditures globally, with a focus on BRIC and mature markets.
Global, Growth Rate, Entertainment, Media, Expenditures, 2019-2023, BRIC, Mature Markets
Graphic
PwC/Strategy&
Saved
Previous
Next
If nothing, comes up, please save your slides first
Create a FREE account to continue browsing
Receive Instant Access to 1,000+ slides from companies like McKinsey, Google, and Goldman Sachs
First Name
Last Name
Email
Password
I agree to all
Terms & Privacy Policy
Thank you! Your submission has been received!
Oops! Something went wrong while submitting the form.
Have an account?
Sign in
Column Chart
Heatmap
Chevron
Org Chart
Infographic
Callouts
Timeline
List
Graphic
Picture
Process Flow
Diagram
Paragraph
Map
Table
Framework
Subtitle
Takeaway Box
Icon
Other Chart
Radar Chart
Waterfall Chart
Mekko Chart
Pie Chart
Scatter Plot
Line Chart
Bar chart
Bullet points