My Account
My Slides
Search by Category
Templates
Leave Feedback
Login
Logout
Get Started
Browse all Slides
Browse all Slides
Create a FREE Account
Instant access to 1,000+ real slides from top companies like McKinsey, BCG, Goldman Sachs, Google and many more!
First Name
Last Name
Email
Password
I agree to all
Terms & Privacy Policy
Thank you! Your submission has been received!
Oops! Something went wrong while submitting the form.
Have an account?
Sign in
Saved Slides
Scatter plot showing income per customer for 2023 against growth rate from 2018-2023 for various European countries. Countries are plotted and color-coded for clarity.
Market Analysis and Trends
Financial Services
Discusses the relationship between income per customer and growth rates across European countries, indicating which countries are growing or shrinking.
income per customer, growth rate, Europe, scatter plot
Single Chart
Kearney
Saved
The slide contains multiple icons and data points organized around a central IT icon, surrounded by other business functions and contract values.
Sales and Business Development
Technology & Software
This slide showcases Gartner’s Global Technology Sales, highlighting sales forces, contract values, and enterprise engagement.
Sales, Technology, Contract Value, Gartner, Enterprises
Diagram
Gartner
Saved
Conveys the prospective impact of space technology on the space economy and human spaceflight, with future-oriented illustrations.
Market Analysis and Trends
Technology & Software
Discusses future disruptions enabled by space technology, including space mining, in-orbit construction, and human spaceflight scalability.
space economy, human spaceflight, space mining, in-orbit construction, power generation
Pillar
McKinsey
Saved
The slide includes a column chart showing the percentage of upstream emissions by geographic source for various countries. It is visually straightforward.
Market Analysis and Trends
Environmental Services & Sustainability
This slide analyzes the geographic source of upstream emissions across different countries, emphasizing the impact of local versus global suppliers.
Upstream emissions, geographic source, country, analysis, environmental impact, sustainability, emissions percentage, data visualization, local suppliers
Mixed Chart
Accenture
Saved
The slide includes three column charts showing Assets Under Custody and corresponding revenue and operating margins from 2016 to 2018, emphasizing significant changes and growth.
Operational Efficiency
Financial Services
Targeted at operations managers and financial analysts, the slide discusses the transformation in Securities Services, illustrating how new business wins and operational model improvements have led to notable financial achievements.
securities services, transformation, assets, revenue, operating margins, financial results, growth, efficiency
Multiple Chart
JP Morgan
Saved
The slide features a text box with a quote and a circular diagram showing the stakeholder consultation process, with various industry icons.
Strategic Planning
Environmental Services & Sustainability
The slide discusses the company's commitment to Science Based Targets and the recurring themes from stakeholder consultations on fashion returns.
Science Based Targets, sustainability, stakeholder, consultation, themes
Diagram
Roland Berger
Saved
Uses icons and lists to illustrate five key growth drivers, presented in a clean, structured layout.
Investment Analysis
Financial Services
Showcases JPMorgan's focus on key growth drivers such as scaling asset management and expanding global presence, providing an at-a-glance view of their strategic direction and achievements in the context of investment and market expansion.
growth drivers, asset management, global, JPMorgan, strategy
Pillar
JP Morgan
Saved
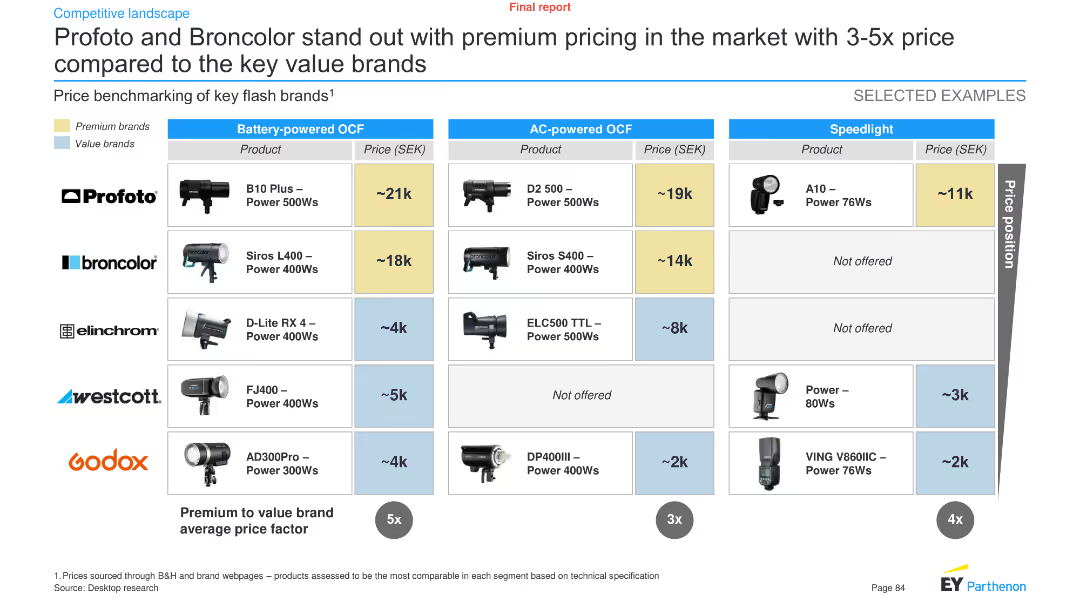
The slide features a comparative chart showing the price benchmarking of key flash brands' products in three categories: battery-powered OCF, AC-powered OCF, and speedlight.
Pricing Strategies
Technology & Software
It highlights the premium pricing of Profoto and Broncolor compared to value brands, showing price differences across various product categories.
Price benchmarking, flash brands, Profoto, Broncolor, premium pricing, technology, analysis, pricing strategies, comparison
Table
EY
Saved
A split-slide; one side discusses China/Asia's reopening with a line graph, and the other focuses on ESG rates of change driving alpha, supported by a bar graph. Analyst credits and report links are provided.
Market Analysis and Trends
Financial Services
It outlines the economic outlook for China/Asia as they reopen and discusses the impact of ESG rate changes on investment alpha, signaling strategic considerations for investors.
China, Asia, market opening, ESG, investment alpha, economic outlook, strategic investment, market analysis, policy changes, investor interest
Multiple Chart
Morgan Stanley
Saved
The slide features a multi-column table comparing performance metrics across Europe, North America, and South America, with each region highlighted in a different color. There are metrics like RoTE and efficiency ratios with 2019 data and mid-term goals. Icons representing each region add a visual element. The slide uses a combination of red, pink, and light blue, with the Santander logo in the corner and a watermark of the company logo in the background.
Operational Efficiency
Financial Services
This slide compares the bank's operational performance metrics by region and outlines goals for improvement. It's suited for internal strategic discussions or investor presentations to demonstrate operational efficiency and targets in different markets.
Regional Performance, RoTE, Efficiency, Santander, Banking Metrics, Performance Goals, Operational Analysis, Financial Targets
Table
Morgan Stanley
Saved
Contains icons and descriptive text segments analyzing luxury market performance in sectors like Cars, Yachts, and Fine Dining. Each segment is clearly defined with associated performance indicators.
Market Analysis and Trends
Consumer Goods
This slide delves into various luxury market segments in 2020, detailing the impact of COVID-19 on sectors like automotive, yachts, fine dining, and hospitality. It examines the nuances of market resilience or decline across these categories, highlighting specific challenges and consumer behavior trends.
luxury sectors, market analysis, COVID-19 impact, consumer behavior, sector performance
Pillar
Bain
Saved
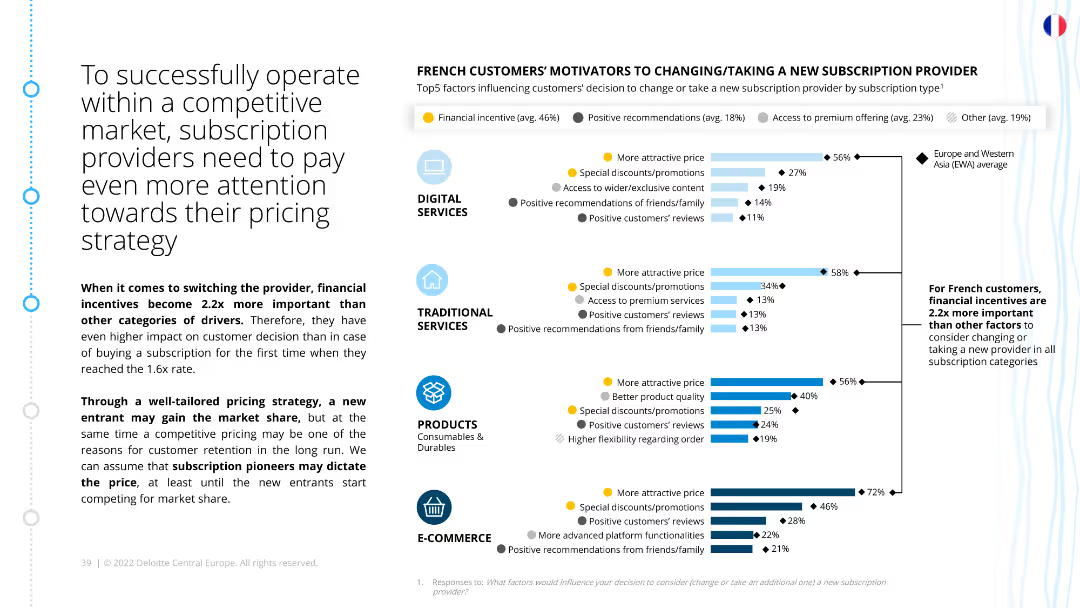
The slide contains a column chart displaying the top factors influencing French customers to change or take new subscription providers. The chart includes categories such as financial incentives, special discounts, access to premium services, and customer reviews.
Strategic Planning
Consumer Goods
The slide emphasizes the importance of pricing strategy for subscription providers in a competitive market. It highlights financial incentives as a key driver for customer decision-making and details other motivators like discounts and premium access.
Pricing strategy, competitive market, financial incentives, subscription motivators, customer decision-making, strategic planning, French market
Multiple Chart
Deloitte
Saved
This slide displays three sets of column charts showing trends over fiscal years for net profit contribution, base fees, and assets under management (AUM). The design is clean with a focus on data presentation, using contrasting greens to differentiate data points. The layout is simple and effective.
Financial Performance
Financial Services
The slide is a financial performance review for Macquarie Asset Management, tracking net profit, fees, and AUM over several years. It is typically used for financial analysis, showcasing growth and financial health to stakeholders, and supporting discussions on strategic financial decisions.
financial review, Macquarie Asset Management, net profit, fees, assets under management, growth trends, strategic planning, financial health
Multiple Chart
Morgan Stanley
Saved
The slide uses a dark background with a large yellow title on the left. On the right, a column chart with yellow bars indicates different concerns for BCM CEOs.
Risk Assessment and Management
Financial Services
This slide shows the top concerns for BCM CEOs, including over-regulation, cyber threats, uncertain economic growth, speed of technological change, and policy concerns.
BCM, CEOs, risks, concerns, cybersecurity, regulation, growth, technology, policy
Mixed Chart
PwC/Strategy&
Saved
Slide contains three main visual elements: two column charts showing 'Container port traffic in the European Union (in million TEU)' and 'Total fisheries production in the European Union (in metric tons)', and various text blocks including a large title and bulleted list.
Industry Overview
Environmental Services & Sustainability
The slide discusses various activities and economic impacts of coastal and marine exploitation and preservation, highlighting data from Earth observation and related EU directives. Emphasis on fisheries management and maritime protection.
Marine, Fisheries, Conservation, EU, Management
Multiple Chart
PwC/Strategy&
Saved
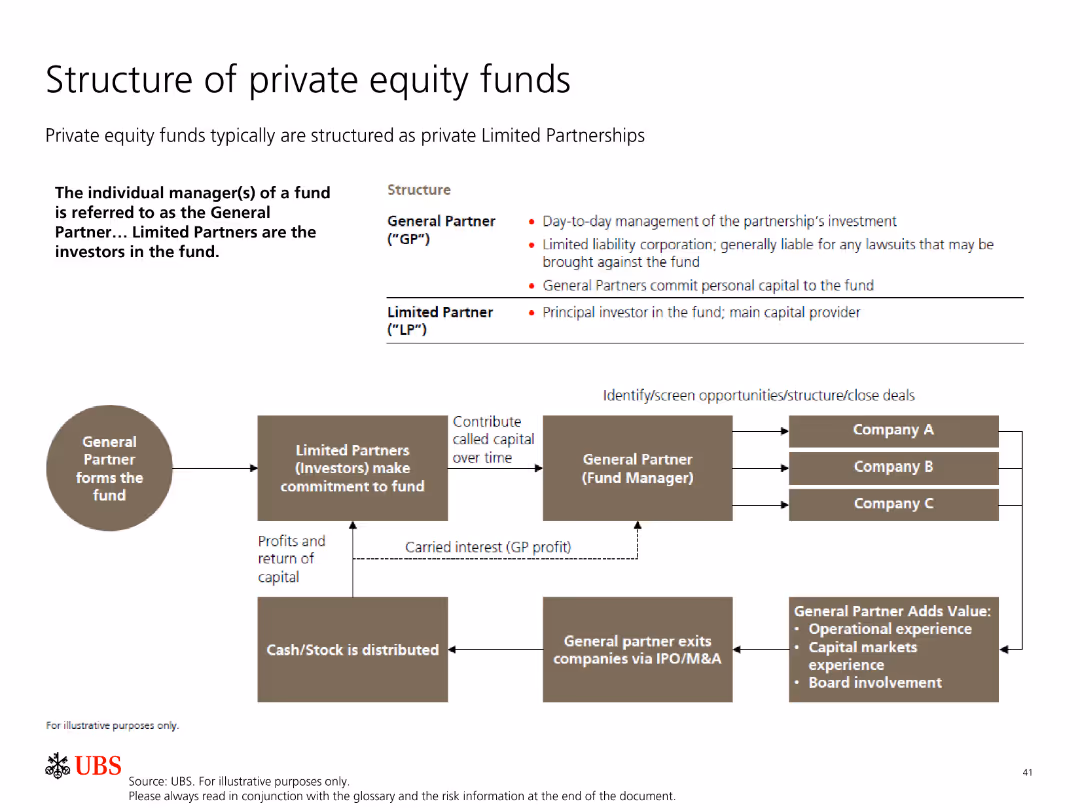
The slide includes a flowchart detailing the structure of private equity funds, showing relationships between general and limited partners.
Organizational Structure and Change
Financial Services
This slide explains the structure of private equity funds, focusing on the roles and responsibilities of general partners and limited partners.
private equity, fund structure, general partner, limited partner, investment
Diagram
UBS
Saved
Column chart comparing alignment over time with insights on factors influencing alignment in different sectors.
Strategic Planning
Professional Services
Highlights improvements in alignment between marketing and finance, discussing implications for strategic and financial planning.
alignment, marketing, finance, strategic planning, sector influence
Mixed Chart
Deloitte
Saved
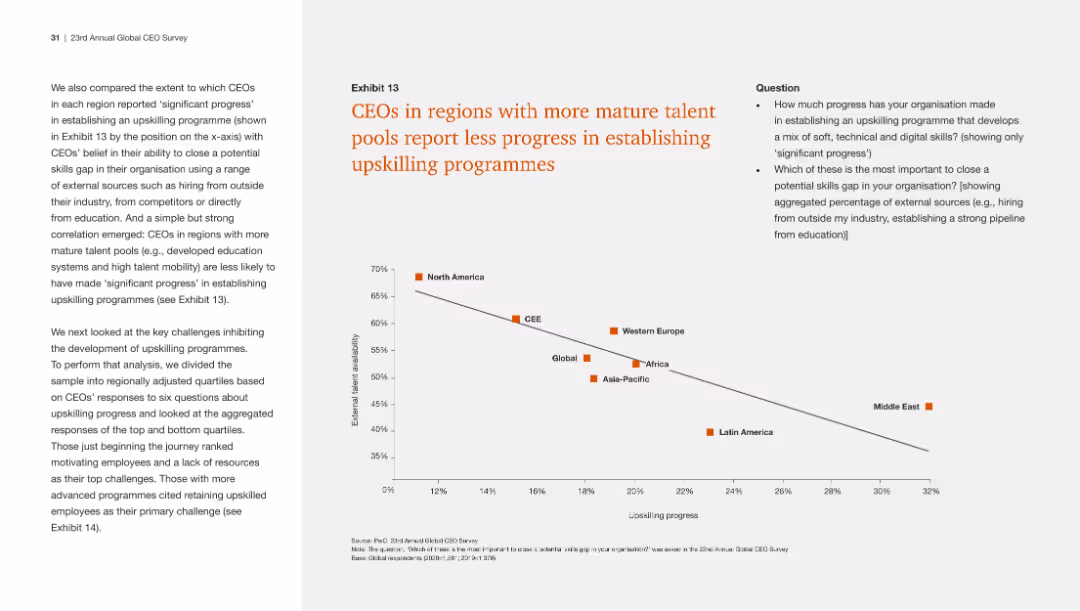
The slide contains a scatter plot showing the correlation between talent pool maturity and progress in upskilling programs across different regions.
Human Resources and Talent Management
Professional Services
The slide reveals that regions with more developed talent pools see less progress in upskilling initiatives, indicating a potential complacency or other barriers.
Upskilling, talent pools, regional comparison, scatter plot, progress
Mixed Chart
PwC/Strategy&
Saved
This slide has a text-heavy format with five sections, each including a header, percentage, description, and associated icon, with a footnote at the bottom.
Market Analysis and Trends
Technology & Software
Details the systemic changes driving the growth of ecommerce in SEA, focusing on demographics, internet infrastructure, GDP growth, payment ecosystems, and retail infrastructure, indicating substantial opportunities for market expansion.
Systemic changes, ecommerce growth, SEA, demographics, internet infrastructure
Header Vertical
Bain
Saved
Displays a bar chart on weekly active usage by paying users across different media types, segmented by user demographics. The chart uses different shades to differentiate segments.
Customer and Market Segmentation
Media & Entertainment
Analyzes weekly usage rates of paid online entertainment services among various demographic segments, highlighting trends among affluent users and young digital natives.
online entertainment, user demographics, music, video, gaming, paid services, affluent users, digital natives
Single Chart
Bain
Saved
Continuation of the previous slide, with value levers on the left and impact potential within 1 year on the right.
Technology and Digital Transformation
Technology & Software
Discusses the impact of industrializing ML across all industries by detailing specific value levers and expected impact within a year.
ML, impact, value, performance, risk, productivity
Header Vertical
McKinsey
Saved
Slide with text and images comparing Canada and Ukraine to Australia in terms of wheat production and export, highlighting similarities in supply chains and efficiency.
Competitive Landscape
Agriculture & Food Production
The slide compares Australia's wheat supply chain to Canada and Ukraine, using these countries as benchmarks for efficiency and export market similarities.
benchmarking, wheat supply chain, Canada, Ukraine, Australia
Graphic
LEK
Saved
The slide features a bar charts with percentage labels, a map highlighting geographic regions, and text blocks. It visually contrasts broadband impact across different socioeconomic areas.
Market Analysis and Trends
Telecommunications
The slide discusses how increased broadband speeds have lifted GDP in lower socioeconomic areas, with a focus on Greater Melbourne, showing that faster broadband access can drive economic growth.
Broadband, GDP, Socioeconomic, Melbourne, Impact
Multiple Chart
Accenture
Saved
The slide features three sections each with a circular icon, title, and bulleted lists. Icons are colored blue, green, and teal. The layout is clean with distinct sections.
Industry Overview
Financial Services
The slide presents three market topics: Growth in Equities, Impact of Electronification, and Performance of Client Franchise with details on each.
markets, equities, electronification, performance, finance
Table
JP Morgan
Saved
Features a bar chart showing the top macro risk factors for investors, like 'Interest rates and US Federal Reserve policy', with color indicators showing changes from a previous survey. Green and teal color scheme.
Risk Assessment and Management
Financial Services
Assesses investor perceptions of macroeconomic risks impacting their strategies, with emphasis on the importance of Federal Reserve policies and geopolitical risks in shaping investment decisions.
macroeconomic risks, Federal Reserve, investment risk, geopolitical
Single Chart
BCG
Saved
Previous
Next
If nothing, comes up, please save your slides first
Create a FREE account to continue browsing
Receive Instant Access to 1,000+ slides from companies like McKinsey, Google, and Goldman Sachs
First Name
Last Name
Email
Password
I agree to all
Terms & Privacy Policy
Thank you! Your submission has been received!
Oops! Something went wrong while submitting the form.
Have an account?
Sign in
Column Chart
Heatmap
Chevron
Org Chart
Infographic
Callouts
Timeline
List
Graphic
Picture
Process Flow
Diagram
Paragraph
Map
Table
Framework
Subtitle
Takeaway Box
Icon
Other Chart
Radar Chart
Waterfall Chart
Mekko Chart
Pie Chart
Scatter Plot
Line Chart
Bar chart
Bullet points