My Account
My Slides
Search by Category
Templates
Leave Feedback
Login
Logout
Get Started
Browse all Slides
Browse all Slides
Create a FREE Account
Instant access to 1,000+ real slides from top companies like McKinsey, BCG, Goldman Sachs, Google and many more!
First Name
Last Name
Email
Password
I agree to all
Terms & Privacy Policy
Thank you! Your submission has been received!
Oops! Something went wrong while submitting the form.
Have an account?
Sign in
Saved Slides
The slide presents several pie charts and a column chart detailing the types of CRE loans in the US by city and the quarterly changes in CLPs. It includes annotations for risk management strategies and impacts.
Risk Assessment and Management
Real Estate & Construction
Explores the dynamics of the U.S. CRE market, focusing on loan modifications, risk management practices, and recent trends in CLPs. Supports strategic decision-making in managing real estate portfolios, especially in understanding geographic and sector-specific risks.
CRE, US market, loan modifications, risk management, geographic risks, sector-specific risks, CLPs
Multiple Chart
Deutsche Bank
Saved
World map with regions highlighted and metrics on AuM, AuM growth, and PTI growth for different market segments.
Customer and Market Segmentation
Financial Services
Focuses on client proximity strategies to capture regional wealth pools, detailing growth metrics for various emerging and mature markets.
Regional wealth, client proximity, AuM growth, PTI growth, market segments
Table
Credit Suisse
Saved
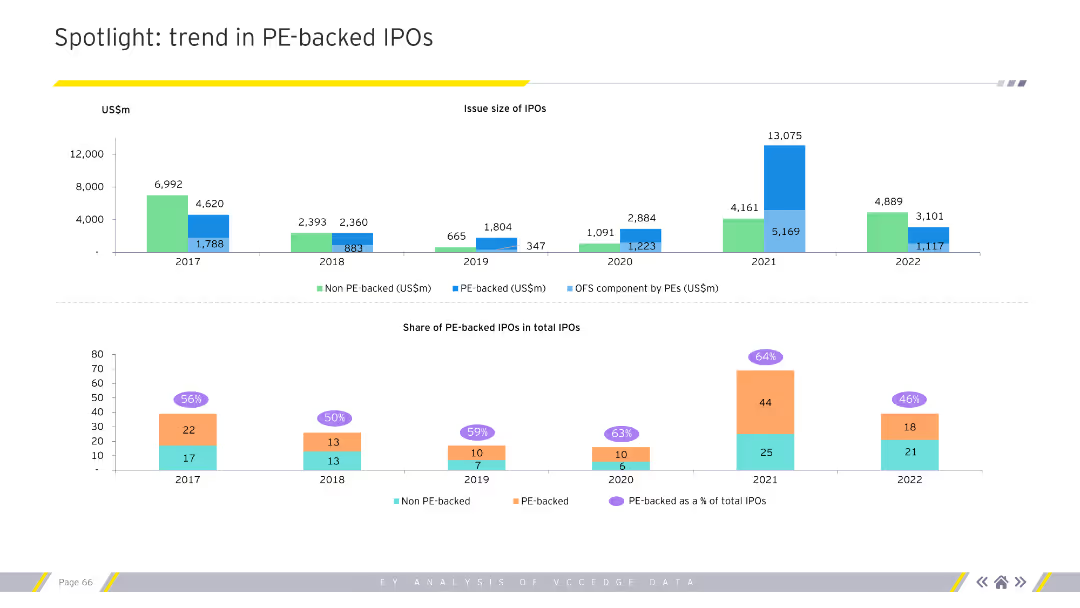
The slide features two charts. The top chart is a column chart showing the issue size of IPOs over several years. The bottom chart shows the share of PE-backed IPOs in total IPOs.
Market Analysis and Trends
Financial Services
This slide highlights trends in PE-backed IPOs, showing issue sizes and shares of total IPOs over multiple years.
PE, IPO, trends, issue size, share, financial services
Multiple Chart
EY
Saved
The slide has a dark background with a yellow-highlighted quote on the left and a comparative bar chart on the right, displaying top consumer preferences with percentages.
Customer and Market Segmentation
Healthcare & Pharmaceuticals
The slide highlights what English consumers value most in the healthcare system, such as access to care, relief from pain and anxiety, and a healthier society.
Consumer values, healthcare, access to care, pain relief, England
Mixed Chart
EY
Saved
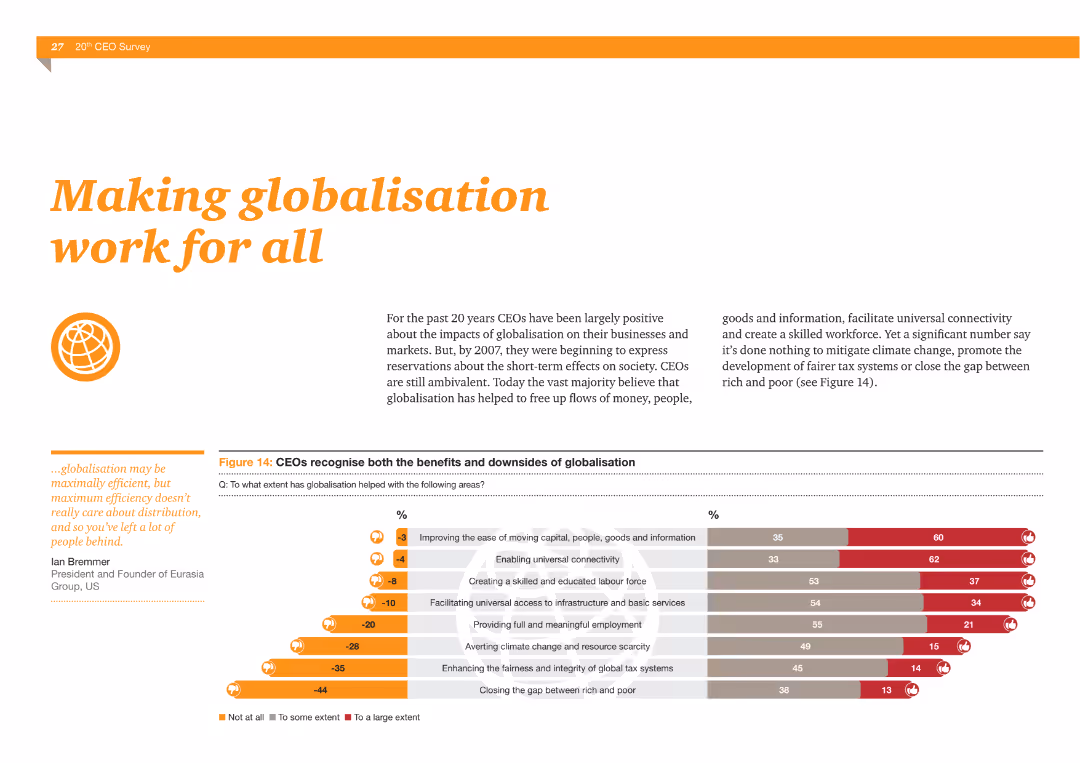
The slide features a column chart showing CEOs' views on the benefits and downsides of globalization, such as improving connectivity and creating a skilled workforce versus failing to address climate change and tax fairness.
Market Analysis and Trends
Financial Services
This slide illustrates CEOs' perspectives on globalization, highlighting both positive impacts like improved connectivity and negative aspects such as failing to address climate change and creating fair tax systems.
Globalization, benefits, downsides, connectivity, skilled workforce, climate change, tax fairness
Multiple Chart
PwC/Strategy&
Saved
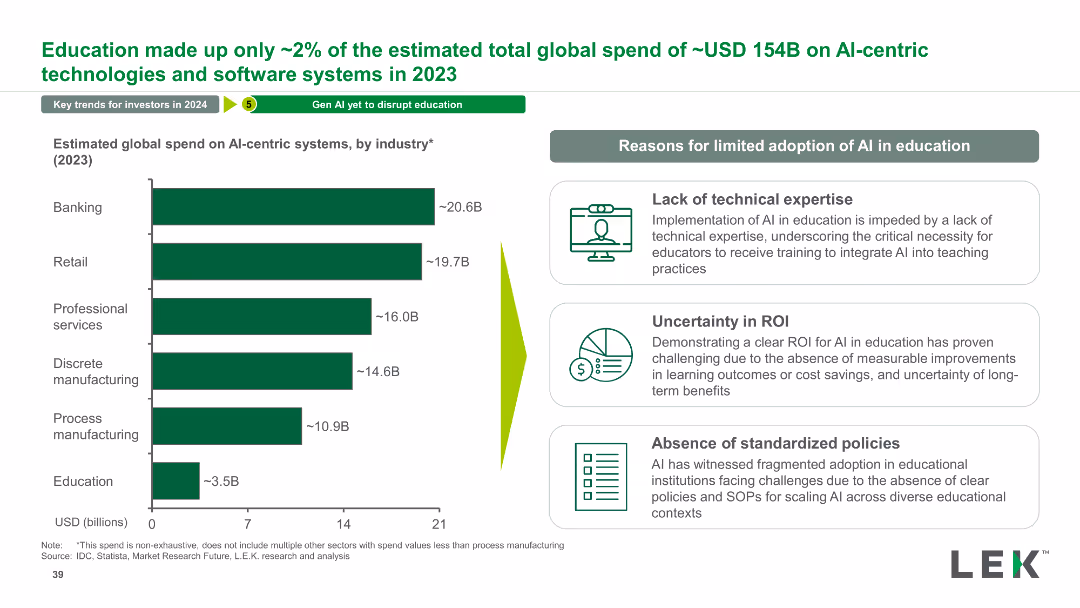
The slide features a column chart showing the estimated global spend on AI-centric systems by various industries in 2023, alongside a list of reasons for limited adoption of AI in education.
Market Analysis and Trends
Technology & Software
This slide provides an overview of global spending on AI systems across industries, emphasizing the limited adoption of AI in education and explaining the reasons behind it.
AI, Spending, Industry, Technology, Education, Analysis, Trends, Global, Market, Adoption
Mixed Chart
LEK
Saved
Features a timeline with overlapping circles and a balanced mix of colors to denote different phases from submission to decision, accompanied by minimal textual content.
Operational Efficiency
Professional Services
Details the annual review process for corporate reporting awards, highlighting critical timelines, staff involvement, and decision phases, ideal for understanding organizational workflows.
corporate reporting, review process, timelines, awards, decision making
Linear Flow
PwC/Strategy&
Saved
This slide emphasizes expansion strategy with bullet points detailing market attractiveness, cross-LOB customers, omni-channel strategy, and smart footprint, alongside a column chart showing an increase in U.S. customer footprint from 69% to 93%. The layout is clean, with the chart on the right and the bullet points arranged on the left for easy comparison and reference.
Market Analysis and Trends
Financial Services
It explains the bank's strategic approach to market expansion and its effective implementation, as evidenced by growth in U.S. customer reach. It may be used to discuss market development strategies and the rationale behind successful expansions.
market expansion, customer base, strategy, omni-channel
Mixed Chart
JP Morgan
Saved
This slide presents a global map highlighting Seadrill’s operational and office locations worldwide. Each location is marked with icons representing different types of rigs or offices, color-coded for clarity. The map is accompanied by bullet points summarizing key statistics, such as the total number of employees and office locations. The layout is spacious and well-organized, making it easy to identify key information quickly.
Strategic Planning
Energy & Utilities
The slide illustrates Seadrill's global operational footprint, emphasizing its extensive reach and strategic positioning in 24 countries. This would be particularly relevant in discussions about market expansion, investor presentations, or internal strategy meetings, showcasing Seadrill’s strength and capability in global operations. It provides a visual representation of the company's scale and the geographical diversity of its assets and personnel, underscoring its role as a major player in the global energy sector.
global presence, Seadrill, operations, map, employees, offices, rigs, international, strategic positioning, energy sector
Graphic
Barclays
Saved
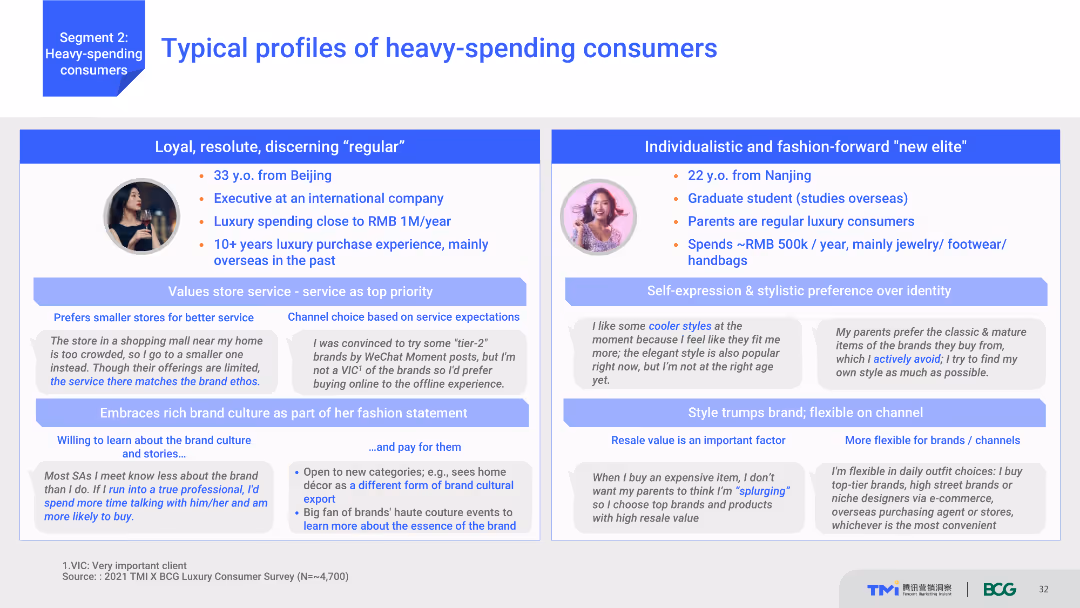
Comparative layout showing two profiles of heavy-spending consumers with detailed descriptions of their demographics, spending habits, and brand preferences. Each profile includes text and supporting graphics.
Market Analysis and Trends
Consumer Goods
Describes typical profiles of heavy-spending consumers, highlighting differences in demographics and spending habits. One profile is a loyal regular consumer, and the other is a fashion-forward new elite.
Consumer profiles, spending habits, demographics, brand preferences, heavy spenders
Boxed
BCG
Saved
Features bar charts, pie charts, and maps, providing a complex overview of geopolitical shifts and resource distribution.
Risk Assessment and Management
Financial Services
Discusses the changing geopolitical landscape and its impact on resource allocation, crucial for strategic planning and geopolitical risk assessment.
Geopolitics, Resource Management, Strategic Planning, Global Shifts, Risk Assessment
Multiple Chart
PwC/Strategy&
Saved
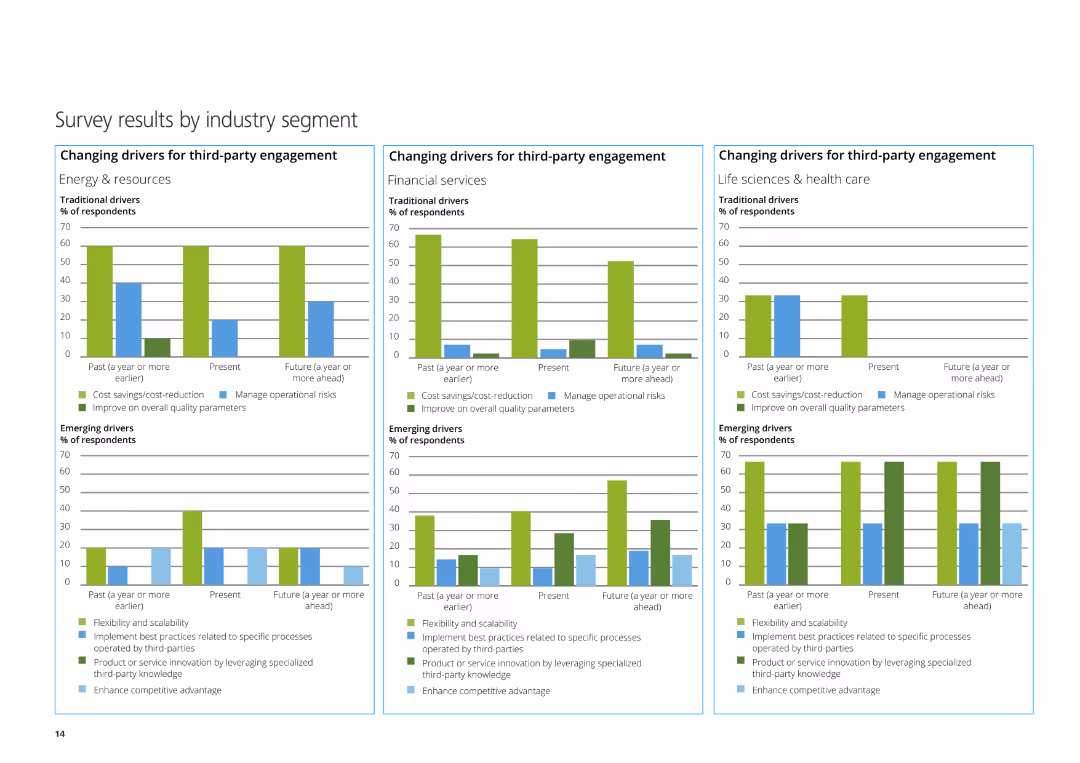
The slide features three column charts depicting the changing drivers for third-party engagement in Energy & Resources, Financial Services, and Life Sciences & Healthcare.
Market Analysis and Trends
Professional Services
This slide presents survey results by industry segment, focusing on traditional and emerging drivers for third-party engagement in various sectors.
Energy & Resources, Financial Services, Life Sciences, third-party engagement, survey
Multiple Chart
Deloitte
Saved
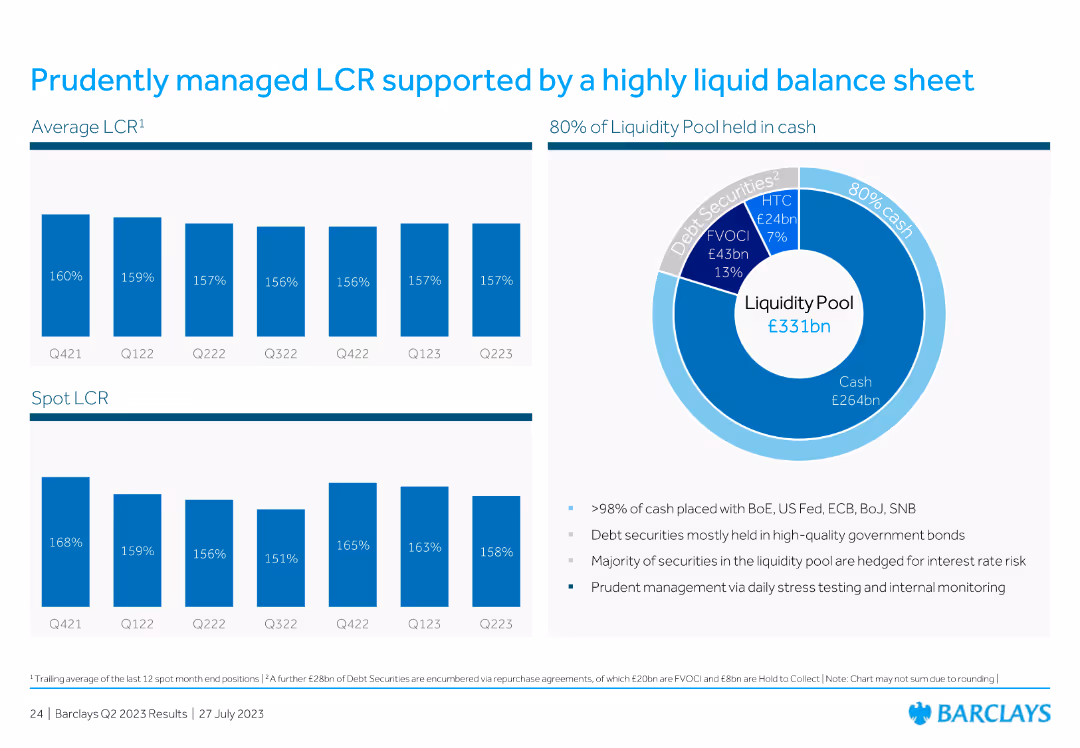
Includes bar charts and a pie chart showing liquidity coverage ratio (LCR) and the composition of the liquidity pool.
Financial Performance
Financial Services
Discusses prudent management of LCR with a highly liquid balance sheet, detailing the liquidity pool composition.
LCR, liquidity, management, balance sheet, pool
Multiple Chart
Barclays
Saved
Three pie charts showing the composition change of the MSCI Emerging Markets Index over time, from 2004 to 2024.
Market Analysis and Trends
Financial Services
Displays the changes in the composition of the MSCI Emerging Markets Index, illustrating shifts in regional market shares over 20 years.
emerging markets, index composition, MSCI, pie charts, market analysis, regional shifts, historical data, projections
Multiple Chart
JP Morgan
Saved
The slide features two doughnut charts detailing the number of deals and investment value distribution across different stages in Indonesia for 2017.
Market Analysis and Trends
Financial Services
Discusses the stages of investment in Indonesia, highlighting the predominance of seed and early-stage investments generating most of the value.
Indonesia, Investment Stages, Seed, Trends
Mixed Chart
Kearney
Saved
Filled with pie charts and graphs, depicts salary expectations and job satisfaction levels across various sectors.
Human Resources and Talent Management
Professional Services
Discusses evolving workforce expectations regarding pay, crucial for financial planning and HR strategies in businesses.
Workforce Trends, Pay Dynamics, Salary Expectations, Job Satisfaction, HR Strategy
Multiple Chart
PwC/Strategy&
Saved
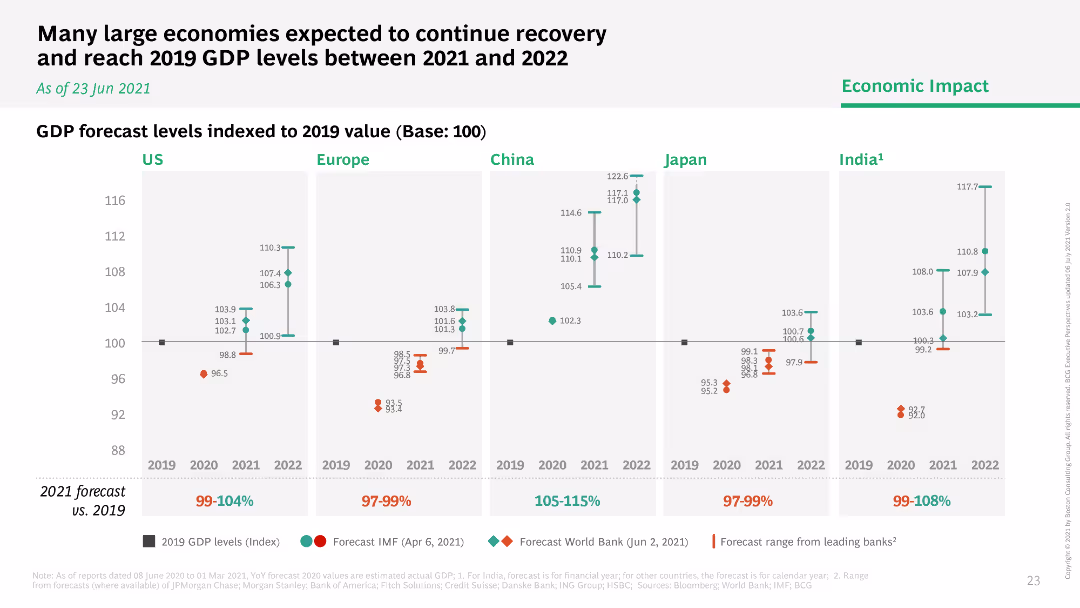
Column charts showing GDP forecast levels indexed to 2019 for the US, Europe, China, Japan, and India, with forecast ranges.
Market Analysis and Trends
Financial Services
Forecasts GDP recovery to 2019 levels for major economies, showing projected economic recovery trends post-COVID-19 pandemic.
GDP, forecast, recovery, economies, 2021-2022
Single Chart
BCG
Saved
Features bar graphs contrasting vaccine and treatment trials, accompanied by quotes, on a clinical color scheme.
Regulatory and Compliance
Healthcare & Pharmaceuticals
Highlights the rapid pace of vaccine and treatment development, with data points and quotes from health officials.
vaccines, treatments, clinical trials, COVID-19, healthcare, development pace
Multiple Chart
BCG
Saved
This slide shows column charts with incremental changes and text boxes with bullet points. Visual hierarchy is used to guide the viewer through the content.
Risk Assessment and Management
Financial Services
Analyzes improvements in card marketing productivity and acquisition gains. Likely to be used in risk management and strategic investment discussions.
card marketing, productivity, acquisition gains, risk management
Multiple Chart
JP Morgan
Saved
This slide features a vertical column chart illustrating the drawn SNB liquidity facilities over various dates. On the left, there is text highlighting key liquidity ratios (LCR and NSFR) and repayment details.
Financial Performance
Financial Services
The slide presents UBS's management of liquidity and funding, highlighting key ratios like LCR and NSFR, and showing the repayment of SNB facilities over time. It is used to show financial stability and management effectiveness.
Liquidity, funding, SNB facilities, LCR, NSFR
Mixed Chart
UBS
Saved
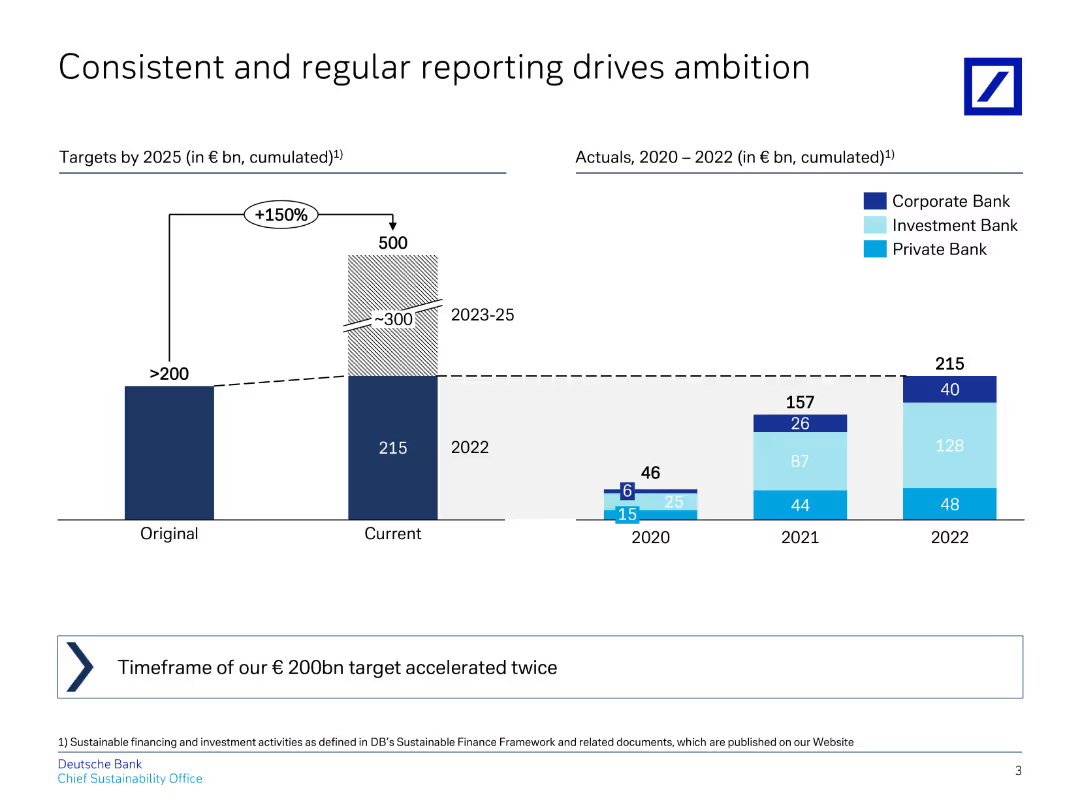
The slide includes a column chart showing target vs. actual financial metrics for Deutsche Bank, highlighting the importance of consistent and regular reporting.
Strategic Planning
Financial Services
It emphasizes the importance of regular reporting in achieving financial targets, showing past targets and actual achievements to stress the importance of reporting.
reporting, targets, actuals, financial metrics, Deutsche Bank
Multiple Chart
Deutsche Bank
Saved
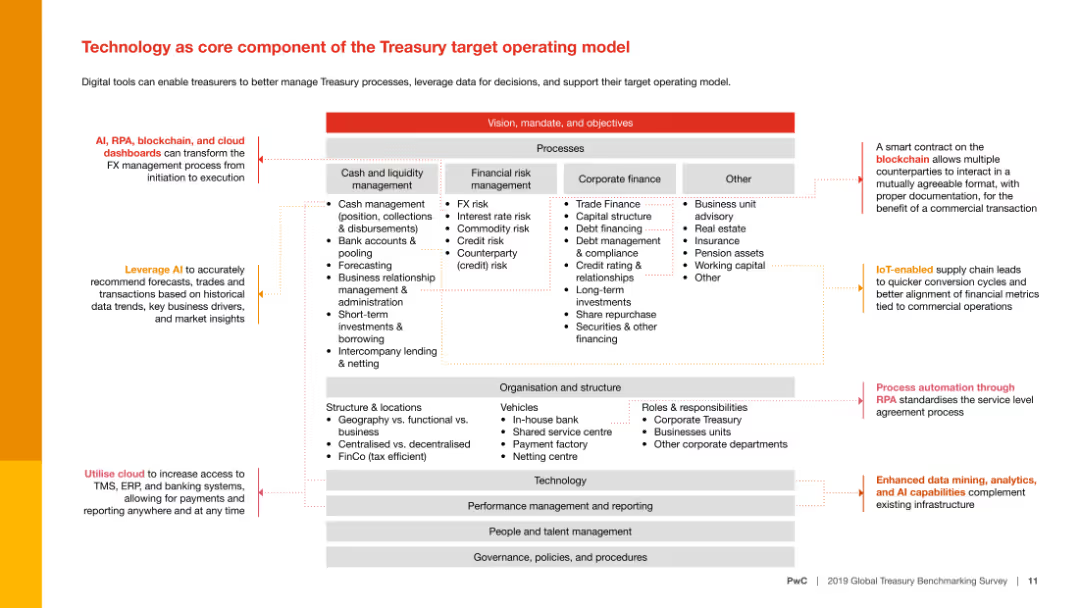
A complex slide with a diagram displaying different processes within the Treasury target operating model. It includes various elements such as arrows and text blocks.
Technology and Digital Transformation
Financial Services
This slide discusses how technology, including AI, RPA, blockchain, and cloud dashboards, can enhance Treasury processes and support decision-making.
Technology, AI, RPA, blockchain, cloud, Treasury
Diagram
PwC/Strategy&
Saved
Features a column chart comparing the relative sales ROI performance across digital average, SFVC, and LFVC, with LFVC showing double the performance.
Performance Metrics and KPIs
Media & Entertainment
Highlights the unexpectedly low media spend on LFVC despite its high performance, suggesting a misalignment in investment priorities.
LFVC, media spend, ROI, performance analysis, investment misalignment
Single Chart
Accenture
Saved
Line chart showing Trade Services Vacancy Rate from FY18 to FY21 for blended, full-time, and part-time positions. A table comparing these rates across the years. Findings in text boxes.
Market Analysis and Trends
Government & Public Sector
Addresses the rise in trade services vacancy rates post-COVID, detailing the impact on service costs and operational capacity. Highlights the need for improved management and transformation.
trade services, vacancy rates, COVID-19 impact, operational capacity, service costs, management, transformation
Mixed Chart
Alvarez & Marsal
Saved
Utilizes icons and color-coded risk categories to explain the EU's proposed AI regulations. It includes detailed descriptions of risk categories and compliance implications.
Regulatory and Compliance
Government & Public Sector
Discusses the proposed EU regulations for AI, detailing risk categories, compliance requirements, and the impact on AI applications across various sectors.
AI regulation, EU policies, compliance, risk management, regulatory impact
Table
BCG
Saved
Previous
Next
If nothing, comes up, please save your slides first
Create a FREE account to continue browsing
Receive Instant Access to 1,000+ slides from companies like McKinsey, Google, and Goldman Sachs
First Name
Last Name
Email
Password
I agree to all
Terms & Privacy Policy
Thank you! Your submission has been received!
Oops! Something went wrong while submitting the form.
Have an account?
Sign in
Column Chart
Heatmap
Chevron
Org Chart
Infographic
Callouts
Timeline
List
Graphic
Picture
Process Flow
Diagram
Paragraph
Map
Table
Framework
Subtitle
Takeaway Box
Icon
Other Chart
Radar Chart
Waterfall Chart
Mekko Chart
Pie Chart
Scatter Plot
Line Chart
Bar chart
Bullet points