My Account
My Slides
Search by Category
Templates
Leave Feedback
Login
Logout
Get Started
Browse all Slides
Browse all Slides
Create a FREE Account
Instant access to 1,000+ real slides from top companies like McKinsey, BCG, Goldman Sachs, Google and many more!
First Name
Last Name
Email
Password
I agree to all
Terms & Privacy Policy
Thank you! Your submission has been received!
Oops! Something went wrong while submitting the form.
Have an account?
Sign in
Saved Slides
Features a column chart listing reasons for purchasing crypto investment funds, including safety and diversification.
Market Analysis and Trends
Financial Services
The slide outlines reasons Canadians purchase crypto investment funds, emphasizing financial motivations like safety, diversification, and speculative investment, and notes demographic differences in these reasons.
Crypto funds, purchase reasons, investment
Multiple Chart
IPSOS
Saved
Includes a stacked column chart showing debt maturity by year and a small pie chart detailing credit ratings. Design elements highlight key statistics like '€600mln ESG linked Term Loan' and credit rating changes over time from three agencies.
Financial Performance
Financial Services
The slide emphasizes a balanced debt maturity structure and favorable credit ratings, presenting both historical and current data. This information is critical for investors assessing the company's financial health and risk profile.
debt maturity, credit rating, ESG, financial health
Mixed Chart
Goldman Sachs
Saved
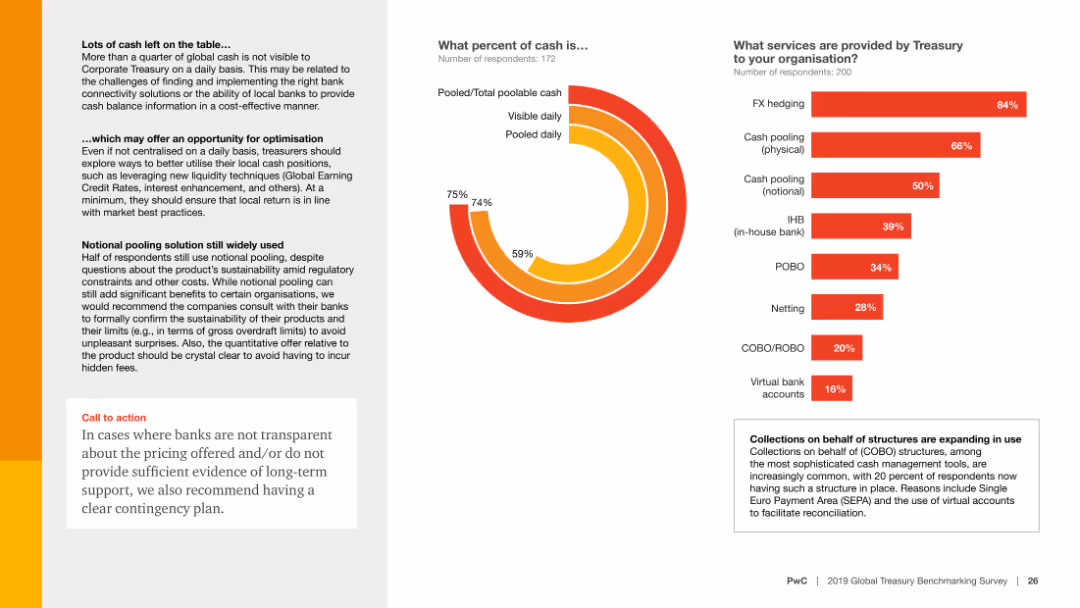
Features a column chart showing satisfaction scores for various Treasury processes. Text elaborates on the challenges with bank fee analysis and management.
Technology and Digital Transformation
Financial Services
Highlights the dissatisfaction with bank fee analysis and bank account management among treasurers, advocating for better transparency and standardized information.
Technology support, satisfaction, bank fees, transparency, standardization
Multiple Chart
PwC/Strategy&
Saved
The slide features a graph illustrating the disparity between the demand for international work by female millennials and their current representation. It has a moderate visual complexity with an icon of a woman circling a globe, alongside a bar chart displaying the percentage statistics.
Technology and Digital Transformation
Professional Services
It presents data on the demand versus the reality of female participation in international work roles. The aim is to highlight the gap and spur discussion on aligning global mobility strategies with the changing workforce demographics to fully utilize female potential.
Female workforce, International mobility, Gap analysis, Workforce demographics
Mixed Chart
PwC/Strategy&
Saved
Light background with green accents, a bar chart on the left showing positive contributions of cyber initiatives, explanatory text on the right.
Operational Efficiency
Technology & Software
The slide discusses the positive contributions of cyber initiatives, such as improved brand reputation and operational stability, with survey data supporting these benefits.
Cyber initiatives, benefits, operational stability, survey, bar chart
Mixed Chart
Gartner
Saved
Column and line charts correlating deal activity in the transport and logistics sector with global GDP growth.
Mergers and Acquisitions
Transportation & Logistics
Discusses the correlation between economic performance and merger activities in the transportation sector.
Transportation, Logistics, GDP, Deals, Mergers, Acquisitions, Economic, Correlation
Mixed Chart
PwC/Strategy&
Saved
Shows a bar chart with advisor recommendations on purchasing crypto assets, divided by recommendation level.
Market Analysis and Trends
Financial Services
The slide presents data on the extent to which financial advisors recommend crypto assets, showing a majority of investors have not been advised to purchase, and details the recommendation levels by various demographics.
Advisor recommendations, crypto assets
Mixed Chart
IPSOS
Saved
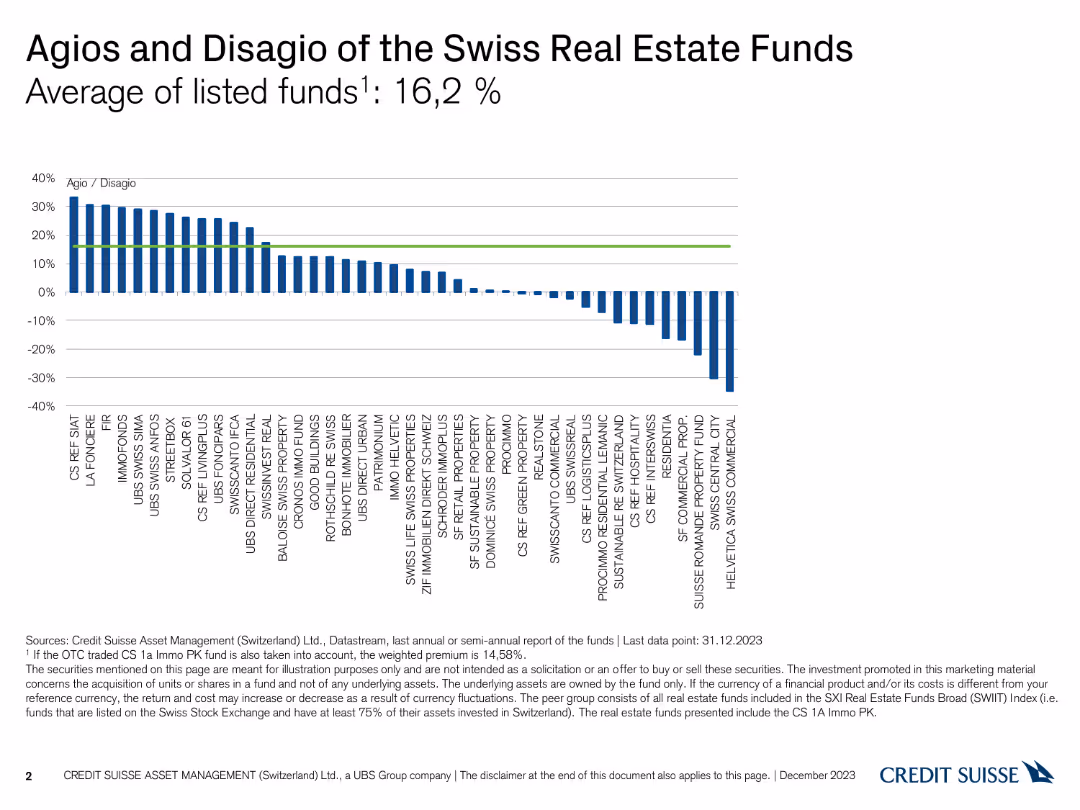
A column chart showing the Agio and Disagio percentages of various Swiss real estate funds, with bars extending above and below a zero line.
Financial Performance
Financial Services
This slide illustrates the Agio (premium) and Disagio (discount) of different Swiss real estate funds as of December 31, 2023, highlighting an average of 16.2%.
Agio, Disagio, Real Estate Funds, Premium, Discount
Single Chart
Credit Suisse
Saved
Three content boxes with lists, checkmarks, and two column charts. Header and footer text are present. The slide is evenly spaced.
Strategic Planning
Financial Services
Discusses commitments to green financing, renewable energy, and sustainable development focus areas with financial goals.
Sustainable development, green financing, renewable energy, business practices
Diagram
JP Morgan
Saved
A minimalist title slide with a dark blue gradient background and the text "Monthly Market Monitor January 2024" on a white background.
Industry Overview
Financial Services
The slide serves as the title page for a report on the monthly market, setting the stage for financial insights and data that follow.
title, market monitor, January 2024, financial, minimalist
Title
Morgan Stanley
Saved
Features a world map and portrait of a woman, highlighting Brazil's role as a continental hub attracting global tech companies
Market Analysis and Trends
Technology & Software
Focuses on Brazil's emerging status as a tech hub, mapping major global tech players and their activities within the region
Brazil, tech hub, global, market, innovation
Graphic
McKinsey
Saved
Slide includes multiple column charts comparing German and Global responses regarding the ethical implications and organizational investments related to Industry 4.0 technologies. It shows leaders' perspectives on ethical concerns, policy exploration, and investment strategies in technologies to protect businesses.
Regulatory and Compliance
Technology & Software
Discusses ethical considerations and investment strategies by German and Global executives in response to Industry 4.0 technologies. It explores the level of concern and proactive measures taken to mitigate unethical use and disruptions.
Ethics, Industry 4.0, Technology, Investment, Germany, Global, Business Protection, Leadership
Multiple Chart
Deloitte
Saved
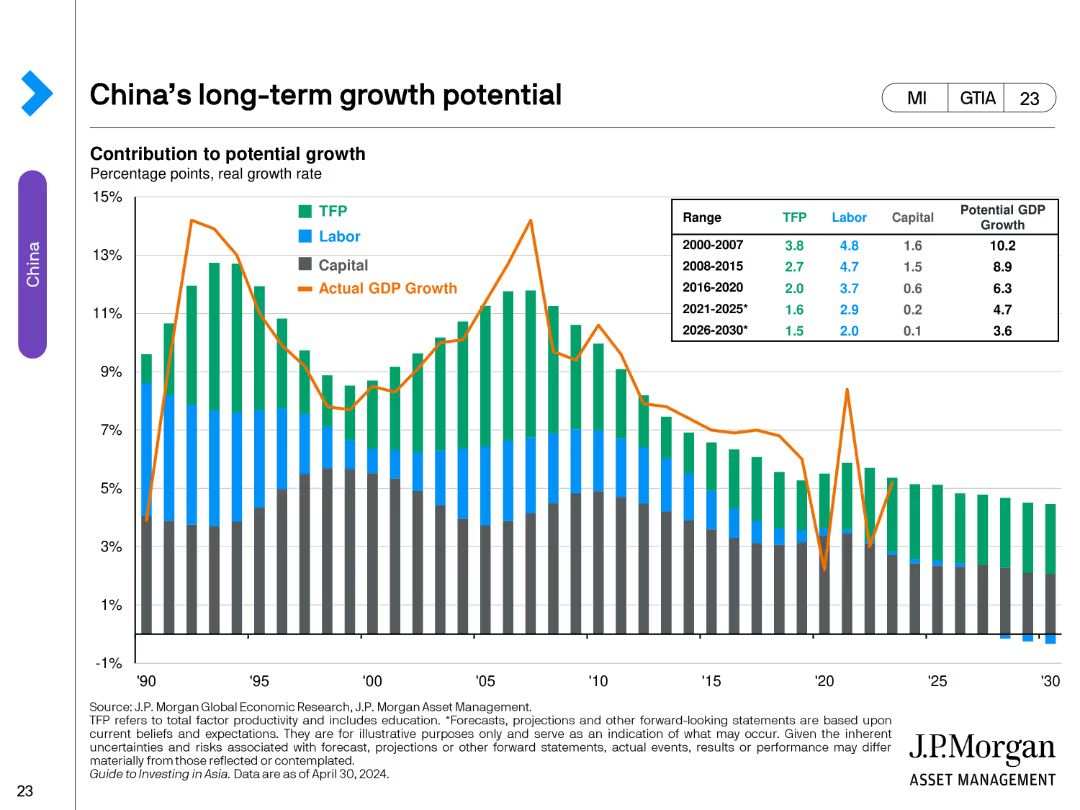
The slide contains a stacked bar chart showing the contribution to potential GDP growth in China from TFP, labor, and capital, alongside actual GDP growth from 1990 to 2030. The chart includes a table summarizing growth rates in various periods.
Market Analysis and Trends
Financial Services
This slide assesses China's long-term economic growth potential, breaking down contributions from total factor productivity (TFP), labor, and capital. It contrasts these with actual GDP growth over time, providing forecasts for future growth rates.
China, GDP, growth, potential, TFP, labor, capital, economic forecast, stacked bar chart, financial services
Single Chart
JP Morgan
Saved
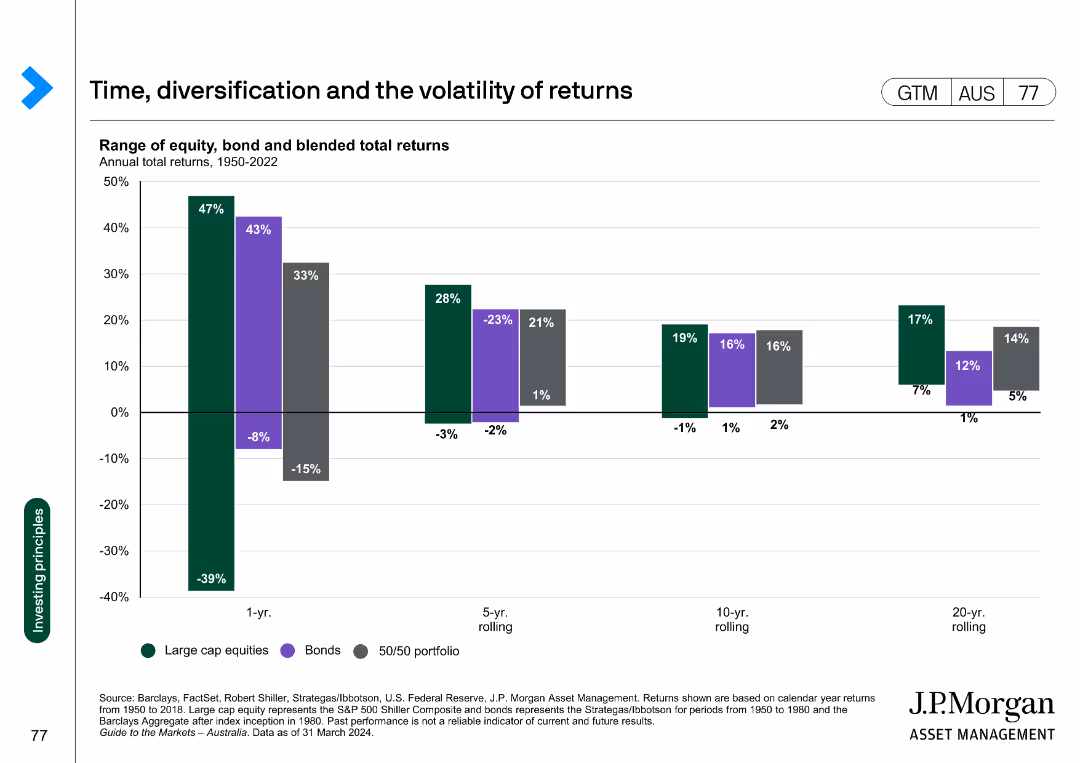
A column chart showing the range of equity, bond, and blended total returns over different time periods (1-year, 5-year, 10-year, 20-year). Each type of return is represented by different colors.
Market Analysis and Trends
Financial Services
The slide compares the performance of large-cap equities, bonds, and a 50/50 portfolio over various rolling periods from 1950 to 2022.
returns, diversification, volatility, equity, bonds
Single Chart
JP Morgan
Saved
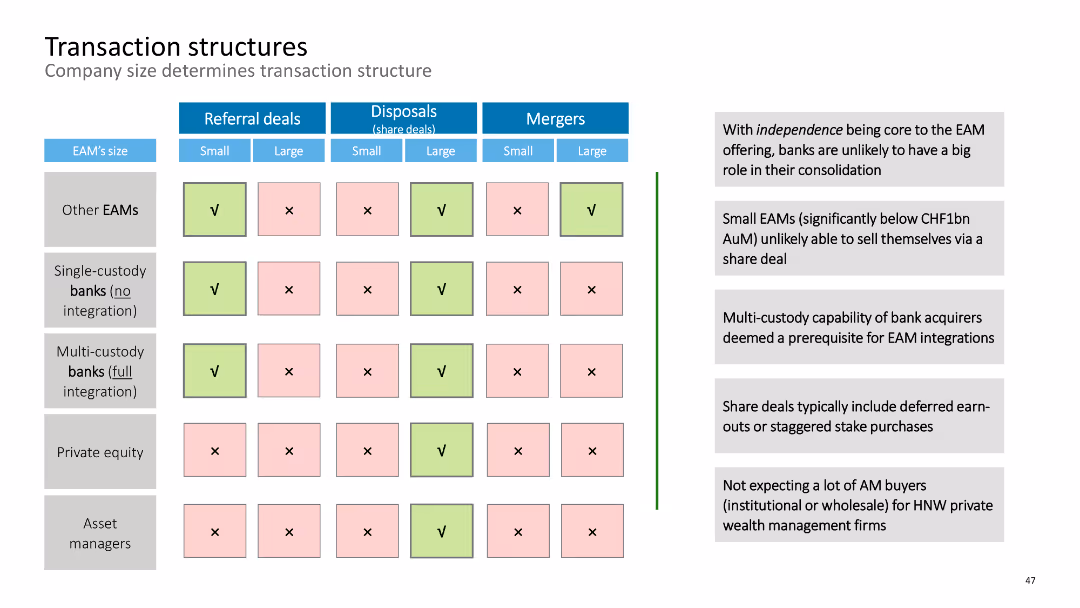
Matrix diagram detailing transaction structures by company size for referral deals, disposals, and mergers.
Operational Efficiency
Financial Services
This slide outlines various transaction structures in the financial sector, considering company size and deal type.
transaction structures, referral deals, disposals, mergers, financial services, company size
Table
Deloitte
Saved
Line charts showing US job opening rates and labor force participation rates from January 2006 to January 2024.
Operational Efficiency
Professional Services
Indicates balanced US labor market conditions with reduced churn and slower labor demand, suggesting gradual cooling of wage growth.
labor demand, job openings, labor force, participation rates, wage growth, line chart, market conditions, US, 2006-2024
Multiple Chart
EY
Saved
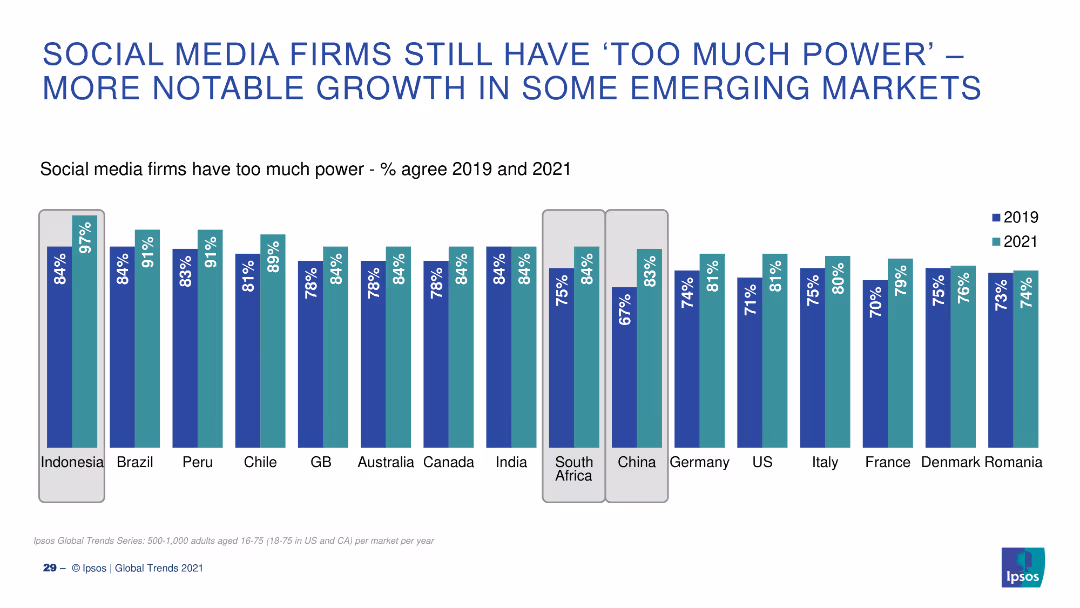
A bar chart showing the percentage of agreement in 2019 and 2021 that social media firms have too much power, across various countries.
Market Analysis and Trends
Media & Entertainment
The slide illustrates the change in perception regarding the power of social media firms, comparing data from 2019 and 2021 across countries.
Social Media, Power, Perception, 2019-2021, Countries
Single Chart
IPSOS
Saved
This slide uses a simple design with images and text to announce upcoming reports on industrial automation by Harris Williams and L.E.K., including process industry automation, discrete (factory) automation, and warehouse automation.
Strategic Planning
Industrial & Manufacturing
The slide informs about upcoming reports from Harris Williams and L.E.K. on industrial automation, focusing on process industry automation, discrete (factory) automation, and warehouse automation.
Upcoming Reports, Industrial Automation, Process Automation, Discrete Automation, Warehouse Automation, Harris Williams, L.E.K.
Diagram
LEK
Saved
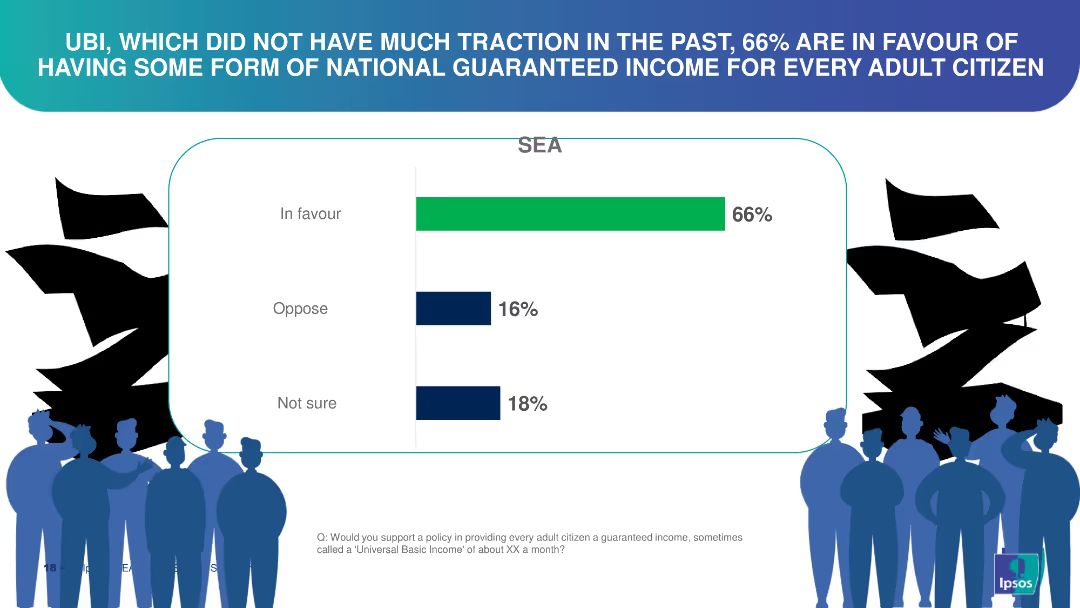
This slide features a vertical bar chart illustrating support levels for Universal Basic Income (UBI) among the surveyed population. The chart is simple, with three distinct bars showing "In favour," "Oppose," and "Not sure" categories.
Market Analysis and Trends
Financial Services
The slide shows that 66% are in favor of UBI, 16% oppose it, and 18% are unsure. It highlights the growing support for UBI, which can be utilized to discuss policy changes, economic reforms, and public sentiment towards income security.
universal basic income, survey results, public opinion, income security, economic reform
Single Chart
IPSOS
Saved
Features three large numbered circles aligned horizontally, each describing a sub-trend of globalization including economic integration, and BRICS markets.
Market Analysis and Trends
Professional Services
Discusses three key aspects of globalization impacting new markets and economies, highlighting economic integration and the diversification of global markets.
globalization, economic integration, BRICS, new markets, sub-trends
Pillar
Roland Berger
Saved
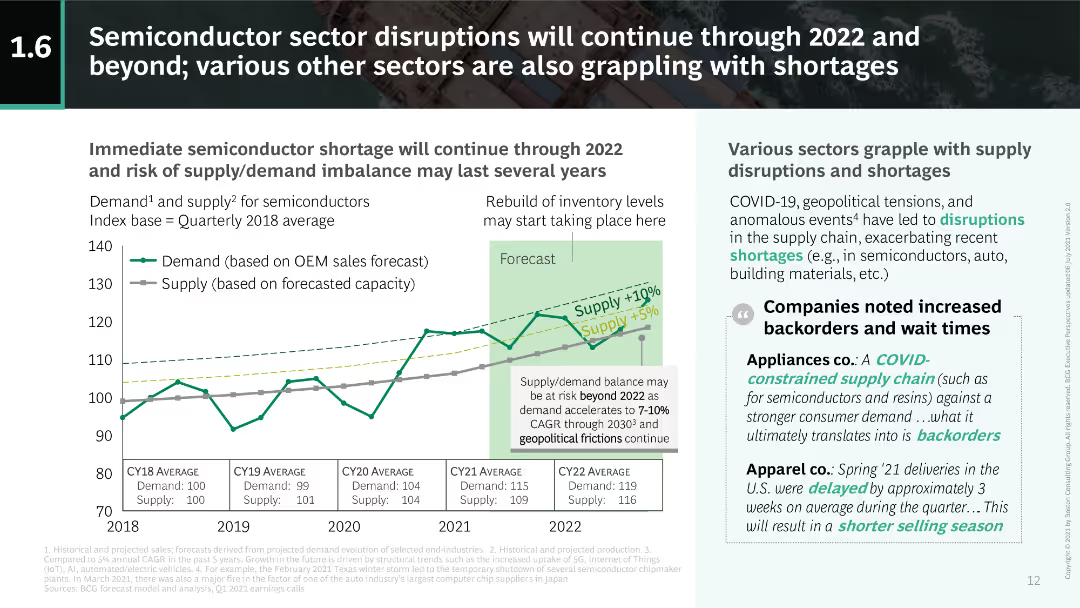
This slide includes a dual-axis line chart showing demand and supply indices for semiconductors from 2018 to 2022. Text on the right discusses broader sector impacts due to disruptions.
Risk Assessment and Management
Technology & Software
The slide details the ongoing semiconductor shortages and their impact across various sectors, emphasizing the supply-demand imbalance and its long-term implications.
semiconductors, supply-demand, shortages, disruptions, 2022
Mixed Chart
BCG
Saved
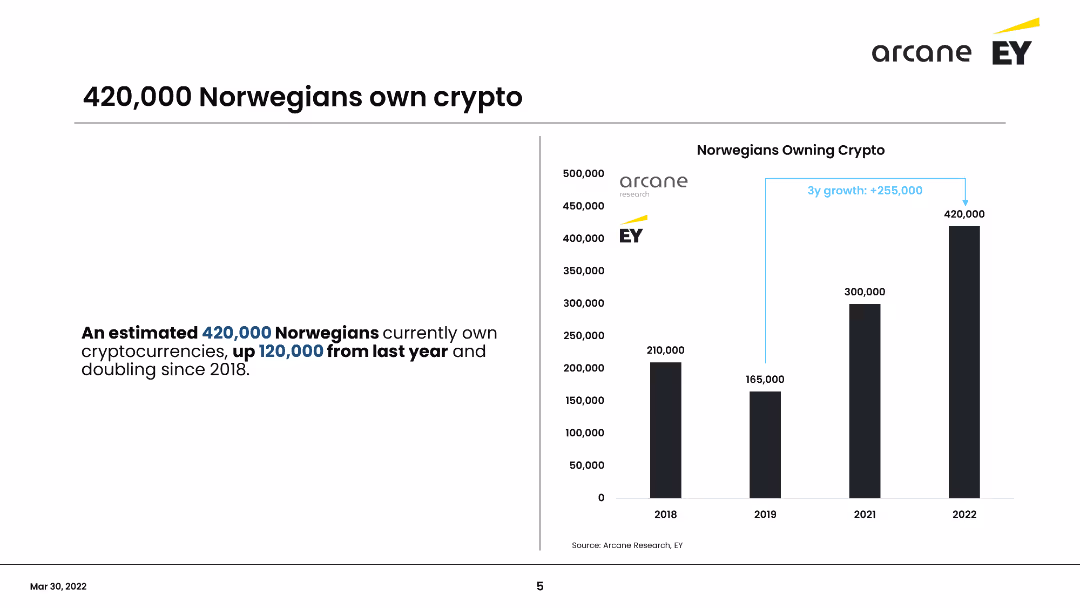
This slide includes a column chart showing the number of Norwegians owning cryptocurrency from 2018 to 2022. It emphasizes the growth in crypto ownership, with an increase of 120,000 owners from the previous year, totaling 420,000 in 2022.
Market Analysis and Trends
Financial Services
Shows the significant increase in cryptocurrency ownership among Norwegians, doubling since 2018 to 420,000 in 2022. Highlights the annual growth and demographic changes, focusing on the increase from the previous year.
Cryptocurrency, Norway, Growth, Ownership, Trends
Mixed Chart
EY
Saved
Consists of a gradient green scale illustrating levels of digital marketing maturity from Nascent to Multi-moment. The layout is straightforward with circular nodes and connecting lines.
Market Analysis and Trends
Media & Entertainment
This slide assesses various brands on their digital marketing maturity, categorizing them from nascent to multi-moment stages. It highlights the progression and maturity in digital marketing practices among brands, useful for understanding market positions and planning marketing strategies.
digital marketing, brand assessment, maturity scale, nascent, multi-moment, marketing strategies, market analysis, progression, technology, engagement
Linear Flow
BCG
Saved
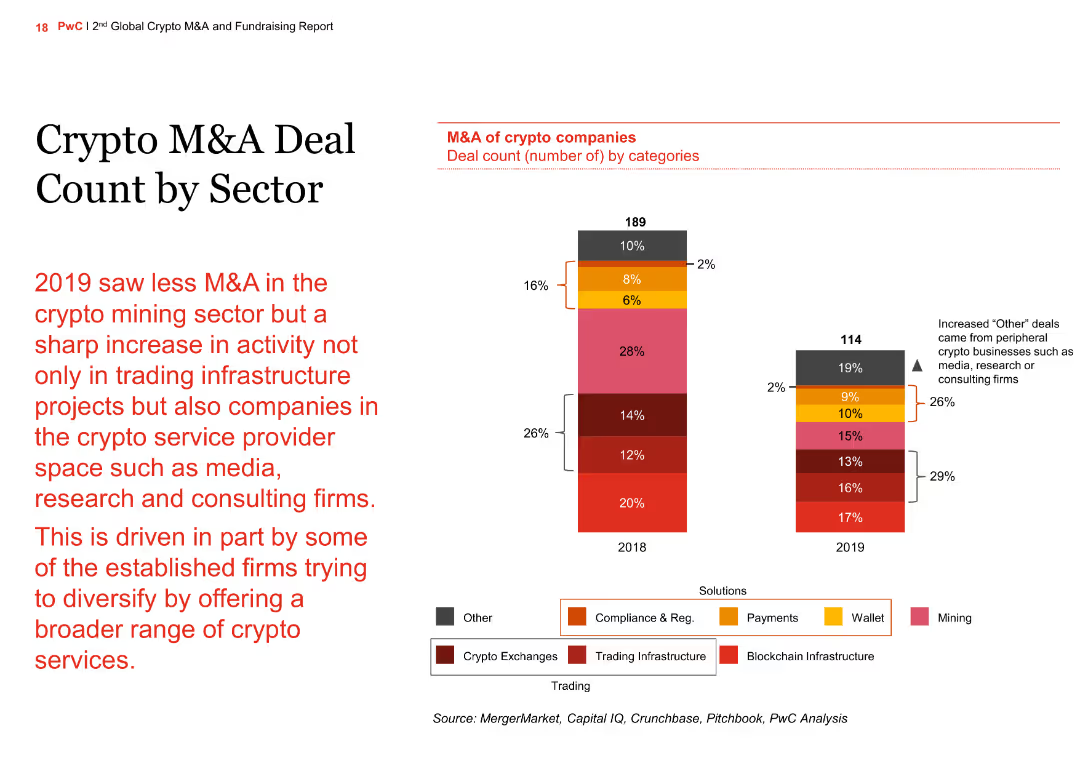
This slide includes a column chart showing the number of M&A deals by sector for the years 2018 and 2019. Sectors include mining, trading, and various service providers like media, research, and consulting.
Market Analysis and Trends
Financial Services
The slide highlights the decline in M&A activity in the crypto mining sector in 2019 and an increase in deals within the service provider space, driven by firms diversifying their service offerings.
crypto, M&A, sector, column chart, comparison
Mixed Chart
PwC/Strategy&
Saved
This slide is divided into segments showing icons and brief descriptions for health, education, food security, environment, and trade, assessing solar's impact across these dimensions. The layout is visually engaging with high informational clarity.
Regulatory and Compliance
Environmental Services & Sustainability
Discusses the broad socio-economic benefits of solar energy adoption, covering its impact on healthcare, education, and economic activities, essential for policy and compliance considerations.
solar benefits, socio-economic impact, health, education, policy impact
Table
BCG
Saved
Previous
Next
If nothing, comes up, please save your slides first
Create a FREE account to continue browsing
Receive Instant Access to 1,000+ slides from companies like McKinsey, Google, and Goldman Sachs
First Name
Last Name
Email
Password
I agree to all
Terms & Privacy Policy
Thank you! Your submission has been received!
Oops! Something went wrong while submitting the form.
Have an account?
Sign in
Column Chart
Heatmap
Chevron
Org Chart
Infographic
Callouts
Timeline
List
Graphic
Picture
Process Flow
Diagram
Paragraph
Map
Table
Framework
Subtitle
Takeaway Box
Icon
Other Chart
Radar Chart
Waterfall Chart
Mekko Chart
Pie Chart
Scatter Plot
Line Chart
Bar chart
Bullet points