My Account
My Slides
Search by Category
Templates
Leave Feedback
Login
Logout
Get Started
Browse all Slides
Browse all Slides
Create a FREE Account
Instant access to 1,000+ real slides from top companies like McKinsey, BCG, Goldman Sachs, Google and many more!
First Name
Last Name
Email
Password
I agree to all
Terms & Privacy Policy
Thank you! Your submission has been received!
Oops! Something went wrong while submitting the form.
Have an account?
Sign in
Saved Slides
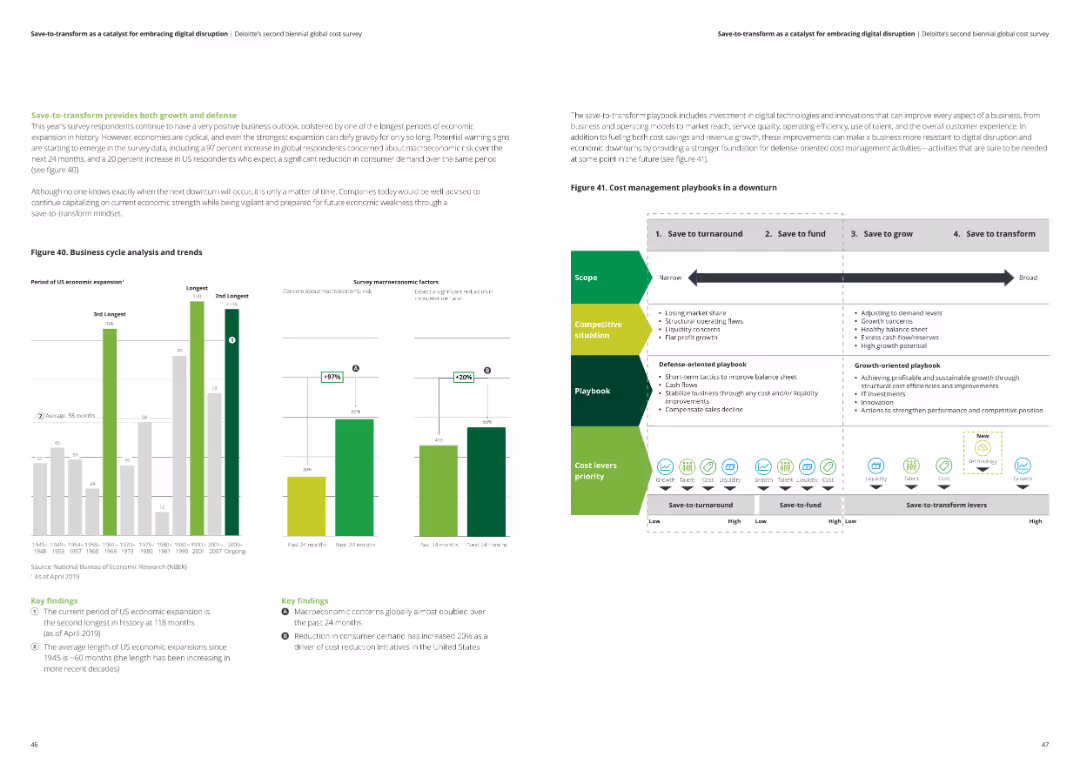
The slide features a timeline with different cost management playbooks for downturns, alongside a bar chart showing macroeconomic concerns and reduction in consumer demand over the past 24 months.
Risk Assessment and Management
Professional Services
This slide presents a playbook for managing costs during economic downturns, emphasizing defensive and growth-oriented strategies. It also covers survey data on macroeconomic concerns and consumer demand reduction.
cost management, economic downturn, macroeconomic concerns, consumer demand, playbook
Multiple Chart
Deloitte
Saved
The slide contains text and graphical elements, including a large "16 of the top 30" in teal, a pie chart showing 72% of US businesses, and a financial figure for the cloud computing market size. The design is clean and modern.
Sales and Business Development
Professional Services
The slide highlights Ipsos' engagement with top B2B companies, emphasizing the predominance of B2B businesses in the US and the significant market size of cloud computing.
B2B, market opportunity, cloud computing, US, engagement
Mixed Chart
IPSOS
Saved
This slide contains a complex, color-coded map showing Deutsche Bank's global operations and their division into regions with a focus on corporate structure.
Organizational Structure and Change
Financial Services
Overview of Deutsche Bank’s global legal entity structure, highlighting significant branches and subsidiaries across different regions.
Legal, structure, global, branches, corporate, Deutsche Bank, map, entities, organization
Table
Deutsche Bank
Saved
Bubble chart correlating median industry earnings with job vulnerability and education levels, color-coded by percentage of jobs requiring a bachelor's degree.
Market Analysis and Trends
Education & Training
Correlates industries with wages and educational attainment, indicating the potential impact of COVID-19 on these factors.
industries, education, wages, vulnerability, COVID-19, bachelor's degree
Single Chart
McKinsey
Saved
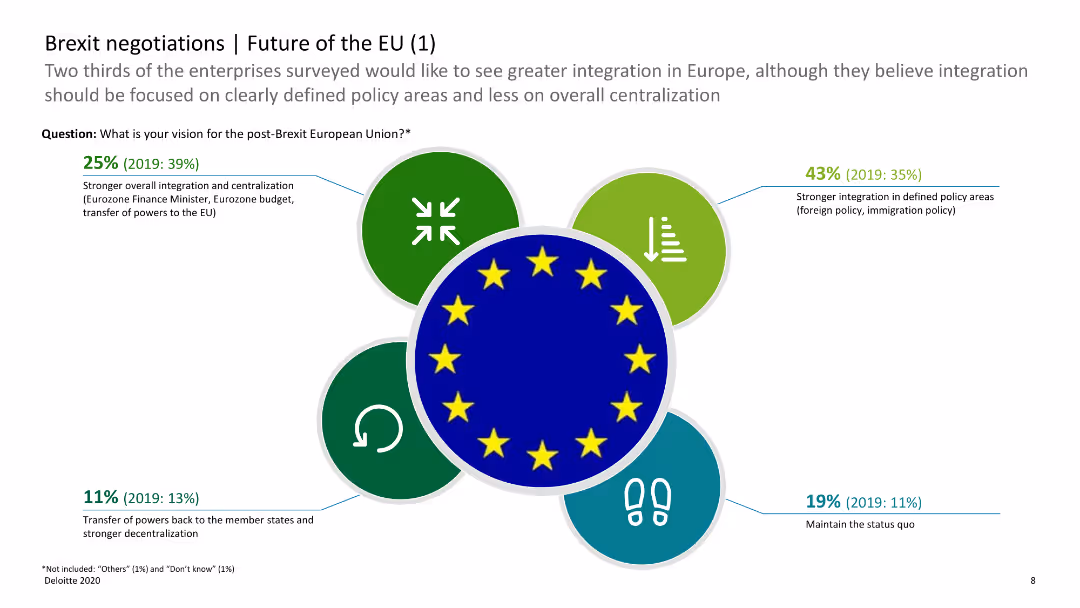
The slide has icons and horizontal bar charts showing opinions on the future of the EU post-Brexit, with categories such as integration and decentralization.
Regulatory and Compliance
Government & Public Sector
This slide shows survey results on the future of the EU, indicating preferences for integration versus decentralization post-Brexit. It helps understand future EU policy directions.
Brexit, EU future, integration, decentralization, survey
Diagram
Deloitte
Saved
The slide features multiple bar charts comparing revenue impacts over two periods. Charts are color-coded and accompanied by insights and economic sector data.
Market Analysis and Trends
Professional Services
The slide analyzes revenue generated by business apps, highlighting variations across different sectors and revenue ranges, useful for assessing market impact and strategic planning.
revenue, apps, business impact, B2B, B2C, market analysis
Mixed Chart
Deloitte
Saved
Features a photo of a diverse team with text on managed flexibility and the principles that guide it.
Strategic Planning
Professional Services
Emphasizes a secure nation supported by diverse perspectives and a shared purpose. Mentions partnerships with suppliers and community organizations.
diversity, flexibility, security, workforce, innovation
Text Only
Booz Allen Hamilton
Saved
Clean layout with tiered blocks diagramming the layers of Web3 technology—Blockchain, Smart Contracts, Digital Assets, and their applications in areas like DeFi and Gaming. Colored in blue shades with icons.
Technology and Digital Transformation
Technology & Software
Explains the structure of Web3 technologies starting from basic blockchain through to various applications like gaming and insurance. Useful for explaining foundational technology and its potential applications.
Web3, blockchain, smart contracts, digital assets, applications
Table
McKinsey
Saved
Two line graphs tracking the NCL and 90+ DPD over time for branded cards and retail services. Below each graph is a column chart showing ACLL Balance and ACLL/EOP Loans.
Financial Performance
Financial Services
Showcases credit trends over time for branded cards and retail services, highlighting changes in non-current loans (NCL), delinquency rates, and allowance for credit losses (ACLL).
Credit Trends, Branded Cards, Retail Services, NCL, DPD, ACLL Balance, Financial Analysis, Delinquency Rates, Loan Management
Multiple Chart
Citigroup
Saved
The slide has four content boxes each with a heading, a ranking, and three bullet points summarizing strategy aspects. Two larger blue boxes highlight the market leadership position, while two smaller gray boxes detail engagement metrics.
Strategic Planning
Financial Services
This slide focuses on the strides made in Consumer Banking, Branch Network, and Business Banking, juxtaposing the current achievements with future strategic goals. It serves to communicate progress and set a determined outlook for extending market leadership.
Strategy progress, Consumer banking, Market leadership, Business strategy, Future outlook, Banking network
Table
JP Morgan
Saved
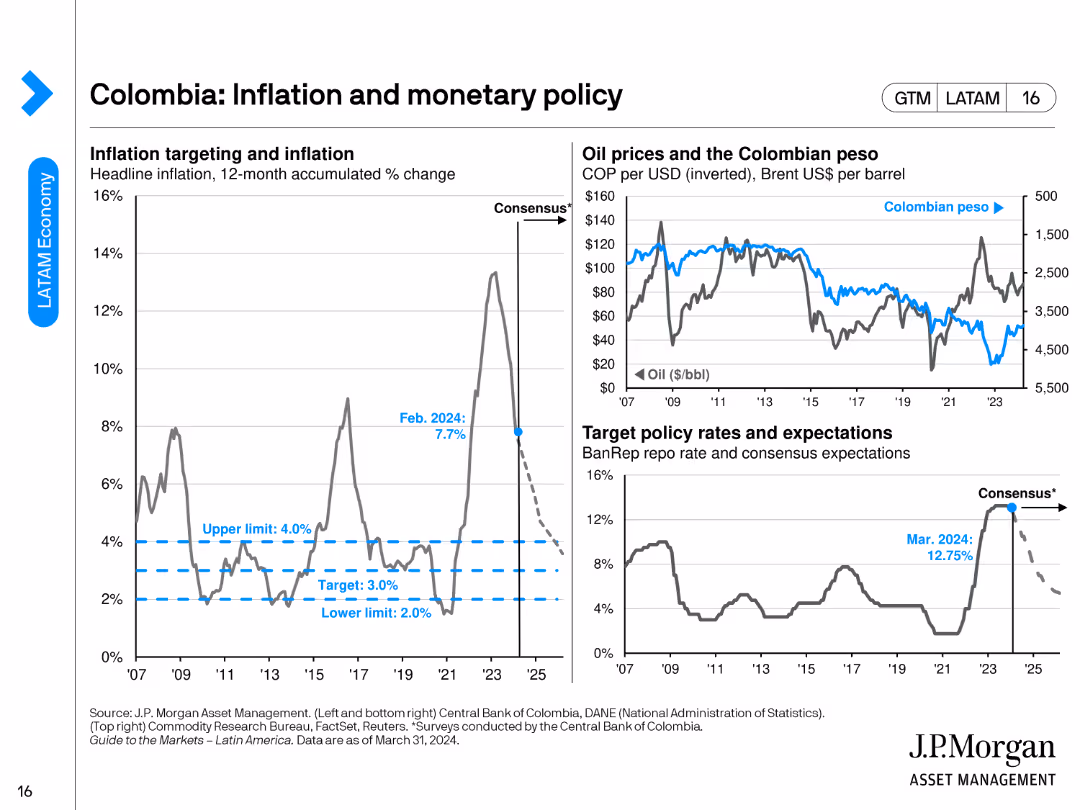
The slide includes three charts: a line chart for inflation targeting, another for oil prices vs. the Colombian peso, and a chart for target policy rates.
Regulatory and Compliance
Financial Services
This slide discusses Colombia's inflation and monetary policy, highlighting inflation targeting, oil prices, and target policy rates as of February 2024.
Colombia, inflation, monetary policy, oil prices, policy rates
Multiple Chart
JP Morgan
Saved
Slide displays doughnut charts representing the adoption of online business activities by MSMEs, with percentages and a descriptive sidebar.
Operational Efficiency
Financial Services
The slide quantifies the adoption of online methods in business practices among MSMEs, indicating minimal digital engagement even among active businesses. The visual data supports discussion on the need for digital onboarding to enhance operational efficiency within the sector.
MSMEs, Digital Adoption, Online Activities, Business Practices, Efficiency, Engagement
Multiple Chart
Kearney
Saved
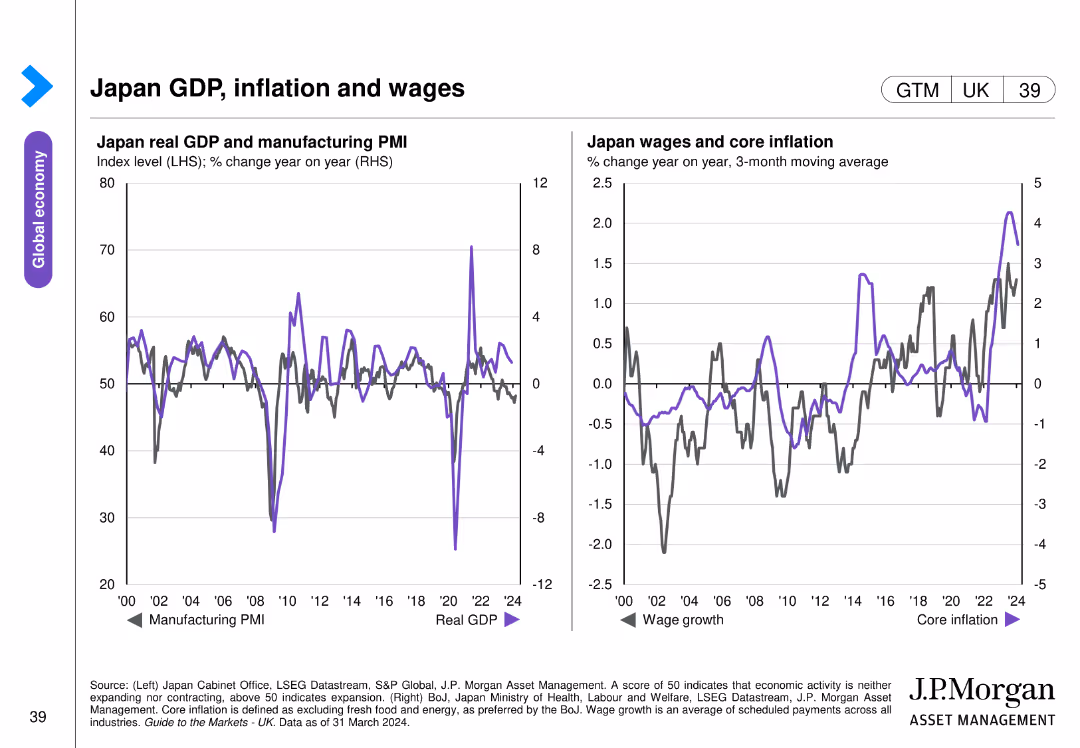
Two charts: one shows Japan's real GDP and manufacturing PMI, and the other depicts Japan's wage growth and core inflation trends over several years.
Market Analysis and Trends
Financial Services
This slide analyzes the economic indicators for Japan, including GDP, manufacturing PMI, wage growth, and core inflation. Used for economic performance review and forecasting in the Japanese market.
Japan, GDP, inflation, wages, PMI
Multiple Chart
JP Morgan
Saved
Displays a column chart and additional data visualizations relating to liquidity coverage ratio, available resources, and historical trajectories.
Regulatory and Compliance
Financial Services
Examines the liquidity position of a financial institution, showing compliance with regulatory requirements and the sufficiency of liquid assets to cover potential cash outflows.
Liquidity, Coverage, Compliance, Column Chart, Financial Health, Regulatory, Banking, Resources
Multiple Chart
Citigroup
Saved
The slide contains two horizontal bar charts on a background image of an airplane, with a cityscape in the background. The charts illustrate investment impacts.
Risk Assessment and Management
Financial Services
Discusses how the Covid-19 pandemic might affect investment strategies in Italy, focusing on sector and country-specific changes, based on investor opinions.
Covid-19, investment, strategy, Italy, impact, sector focus, country focus, investor opinion
Multiple Chart
EY
Saved
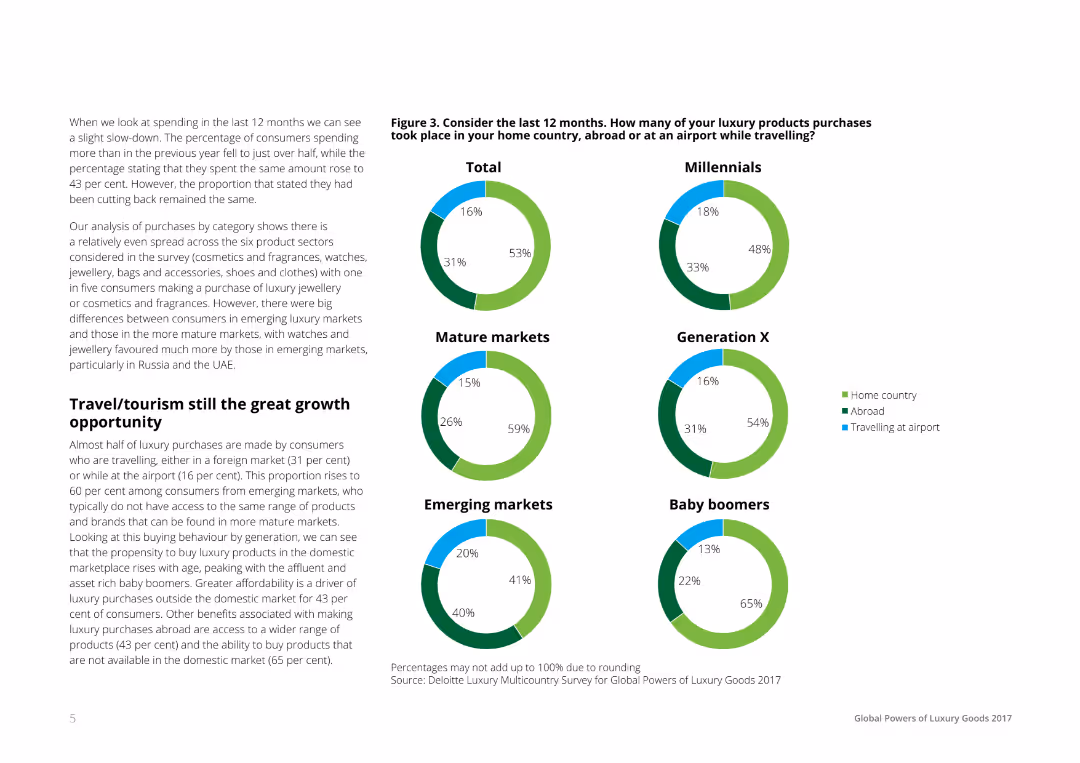
Textual analysis on the left with pie charts on the right, representing data on where luxury purchases took place: home country, abroad, or at the airport. Each pie chart is segmented and color-coded to represent different demographic groups.
Market Analysis and Trends
Hospitality & Tourism
The slide highlights the travel and tourism sector as a key growth area for luxury goods, presenting data on where consumers purchase luxury products, segmented by demographic groups such as Millennials, Generation X, and Baby Boomers.
Travel, Tourism, Luxury, Market, Growth
Multiple Chart
Deloitte
Saved
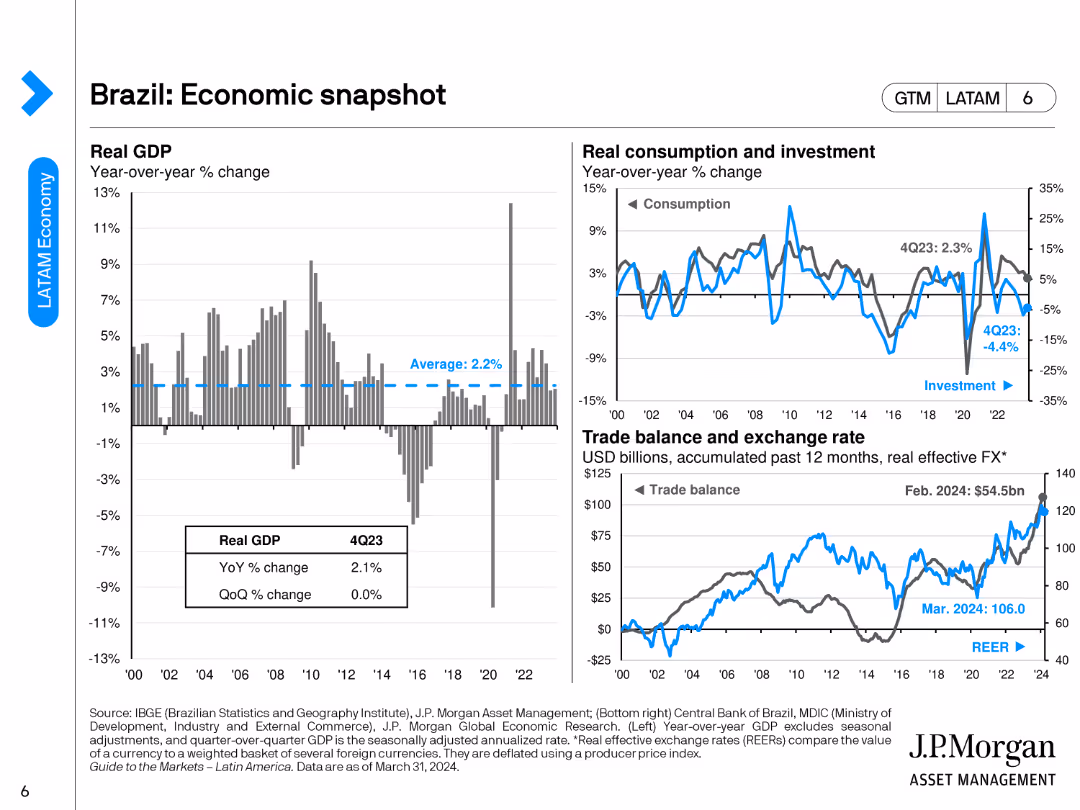
The slide includes three main charts: a bar chart for real GDP year-over-year change, a line chart for consumption and investment, and a combined line/bar chart for trade balance and exchange rate.
Market Analysis and Trends
Financial Services
The slide provides an economic overview of Brazil, detailing GDP changes, consumption, investment trends, and trade balance with exchange rate metrics.
Brazil, economic snapshot, GDP, trade balance, investment
Multiple Chart
JP Morgan
Saved
Three-column chart with headers for WM Client Assets, Fee-Based Assets, and Client Relationships, each with key figures and ranks. Clean design with prominent blue highlights.
Financial Performance
Financial Services
Demonstrates Morgan Stanley's market position with total client assets, fee-based assets, and client relationships, emphasizing leadership and scale.
Scale, wealth management, market position, client assets, fee-based, client relationships, market leadership
Table
Goldman Sachs
Saved
Includes a bar chart showing consumer preferences for smartphone features, focusing on battery life and camera quality.
Product and Service Analysis
Telecommunications
Highlights consumer preferences for certain smartphone features like battery life and camera, while noting lower interest in eco-friendly specifications.
smartphone features, consumer preferences, battery life, camera quality, sustainability
Mixed Chart
Deloitte
Saved
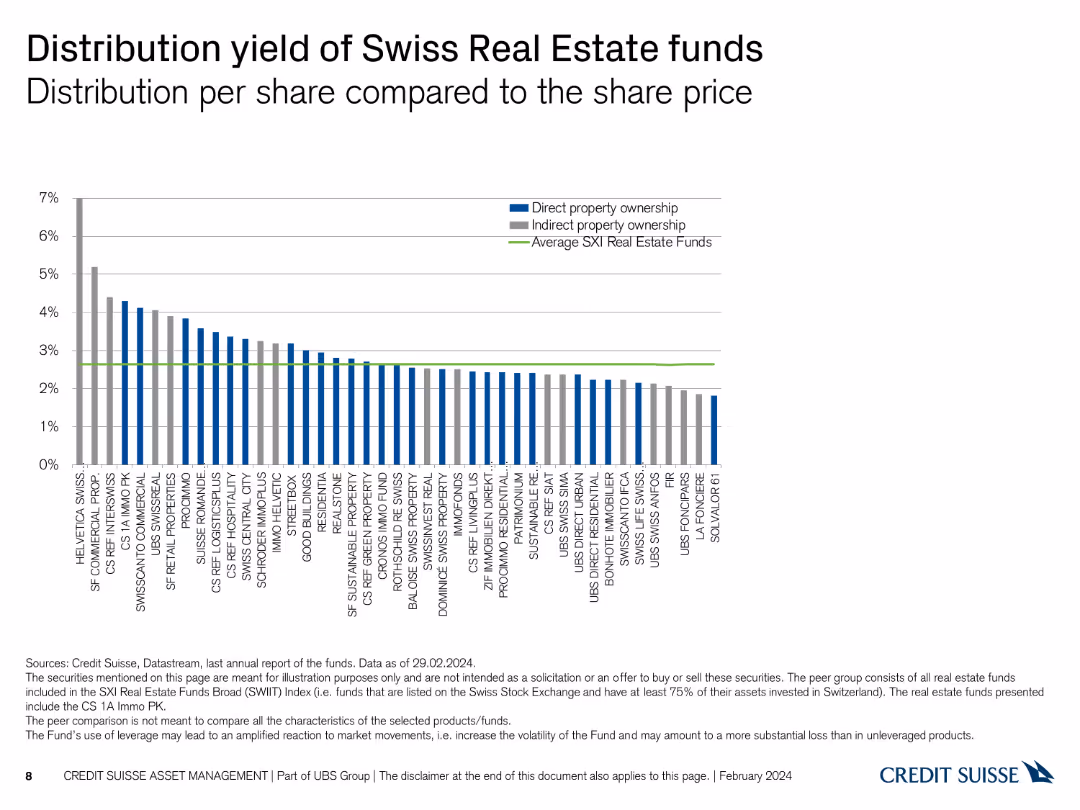
Column chart comparing distribution yields per share with share prices across Swiss real estate funds.
Financial Performance
Real Estate & Construction
Compares the distribution yield per share with the share prices of various Swiss real estate funds.
real estate, distribution yield, share price, comparison, funds
Single Chart
Credit Suisse
Saved
Features an image of a student with headphones using a laptop on the left and two content columns on the right with icons. The slide is clear and uses a split-layout design.
Operational Efficiency
Financial Services
Details strategies to maximize revenue and manage costs within core business operations, suitable for financial and operational strategy discussions.
Revenue, Cost Management, Market Share, Operational Strategy
Header Horizontal
Morgan Stanley
Saved
Features a bar chart comparing preferences for different vehicle engines between two study years. The chart is color-coded and provides percentages for each engine type, including gasoline, hybrid, and electric.
Market Analysis and Trends
Transportation & Logistics
Analyzes consumer preference shifts from traditional gasoline vehicles to electric and hybrid models, reflecting changing market dynamics and environmental concerns in the automotive industry.
consumer behavior, market shift, electric vehicles, hybrid vehicles, gasoline, automotive industry, environmental impact, technology adoption
Single Chart
Deloitte
Saved
Contains a column chart comparing H2/CO ratios across different production methods, with key comments on the right explaining the implications of these ratios.
Technology and Digital Transformation
Energy & Utilities
Highlights the importance of the H2/CO ratio in hydrogen production, comparing different methods and discussing the impact on end applications and flexibility.
Hydrogen, CO ratio, production methods, flexibility, end applications
Mixed Chart
Kearney
Saved
Column chart comparing conversion rates of online channels with and without genAI enabled contact centers. Shows significant improvement with genAI integration.
Sales and Business Development
Financial Services
Demonstrates how genAI enabled customer centers significantly increase sales performance by improving conversion rates for online loan applications.
genAI, customer center, sales, conversion rates, online channel
Multiple Chart
Kearney
Saved
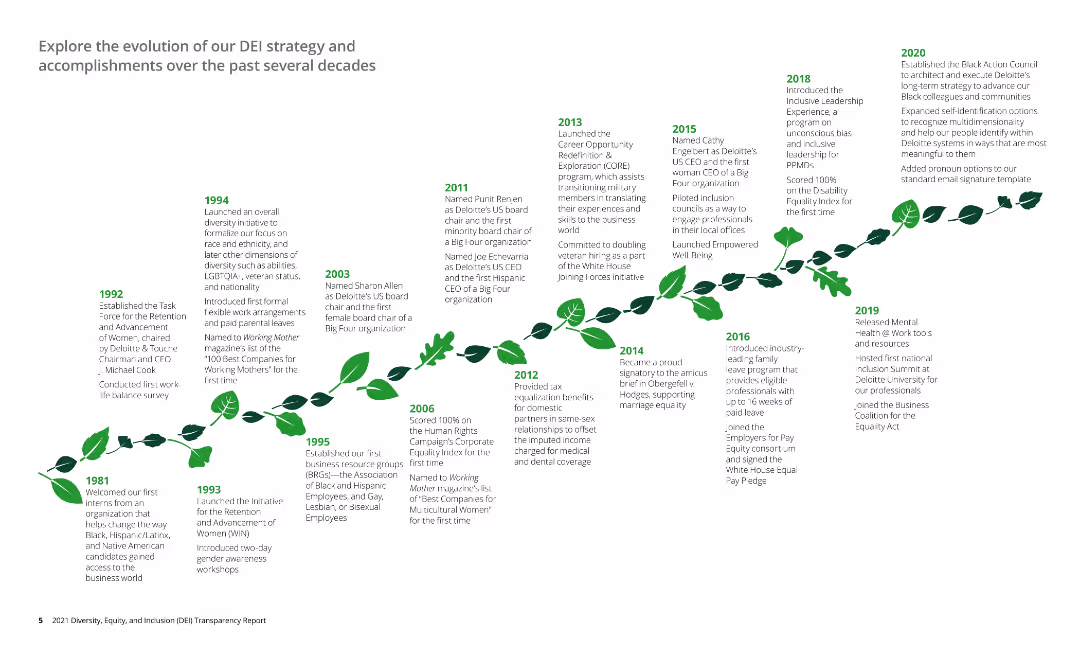
The slide features a timeline detailing the evolution of a company's DEI strategy from 1981 to 2020, with key milestones and achievements noted. The timeline is visually represented as a growing plant, symbolizing development and progress.
Organizational Structure and Change
Professional Services
The slide provides a historical overview of the company's Diversity, Equity, and Inclusion (DEI) strategy, highlighting significant milestones, initiatives, and accomplishments over several decades, from 1981 to 2020.
DEI strategy, timeline, milestones, diversity, inclusion
Linear Flow
Deloitte
Saved
Previous
Next
If nothing, comes up, please save your slides first
Create a FREE account to continue browsing
Receive Instant Access to 1,000+ slides from companies like McKinsey, Google, and Goldman Sachs
First Name
Last Name
Email
Password
I agree to all
Terms & Privacy Policy
Thank you! Your submission has been received!
Oops! Something went wrong while submitting the form.
Have an account?
Sign in
Column Chart
Heatmap
Chevron
Org Chart
Infographic
Callouts
Timeline
List
Graphic
Picture
Process Flow
Diagram
Paragraph
Map
Table
Framework
Subtitle
Takeaway Box
Icon
Other Chart
Radar Chart
Waterfall Chart
Mekko Chart
Pie Chart
Scatter Plot
Line Chart
Bar chart
Bullet points