My Account
My Slides
Search by Category
Templates
Leave Feedback
Login
Logout
Get Started
Browse all Slides
Browse all Slides
Create a FREE Account
Instant access to 1,000+ real slides from top companies like McKinsey, BCG, Goldman Sachs, Google and many more!
First Name
Last Name
Email
Password
I agree to all
Terms & Privacy Policy
Thank you! Your submission has been received!
Oops! Something went wrong while submitting the form.
Have an account?
Sign in
Saved Slides
Five icons representing different factors such as 'Technical feasibility', 'Cost of labor', and 'Regulatory and social factors', each with a descriptive subheading and arranged in a clean, circular layout.
Strategic Planning
Technology & Software
Outlines the major factors that influence the pace and extent of AI and automation adoption in industries, discussing technical, economic, and regulatory considerations.
AI, Automation, Factors, Adoption, Industry
Pillar
McKinsey
Saved
Contains column charts and demographic breakdowns, showing the reporting and satisfaction rates of harassment incidents by gender and orientation among Gen Z and Millennials. The visual design aids in understanding disparities.
Market Analysis and Trends
Professional Services
Discusses the differences in harassment reporting and satisfaction with organizational responses among different gender and orientation groups within Gen Z and Millennials.
harassment, diversity, inclusion, Gen Z, Millennials, reporting rates, satisfaction
Multiple Chart
Deloitte
Saved
Timeline of AI achievements from 2020 to 2050, including tasks like telephone banking, writing a high school essay, and generating a top 40 pop song.
Technology and Digital Transformation
Technology & Software
The slide outlines the projected advancements in AI capabilities over the next few decades. It predicts significant milestones in AI performance, highlighting the increasing complexity and ambition of tasks that intelligent machines will be able to accomplish, potentially surpassing human capabilities.
AI Capabilities, Timeline, Intelligent Machines
Linear Flow
Roland Berger
Saved
Contains infographics detailing e-money statistics and competitive landscape. It includes graphical representation of active e-wallets and transaction volumes.
Technology and Digital Transformation
Financial Services
Details the growth and competitive landscape of the e-payments sector in the Philippines, highlighting significant investments and transactions.
e-payments, digital, Philippines, transactions, growth
Table
Deloitte
Saved
Shows pie charts in soft blue and teal, focused on AI's role in patient care and hospital operations.
Operational Efficiency
Healthcare & Pharmaceuticals
Highlights specific AI applications in healthcare operations and patient management, detailing the adoption rates and areas like imaging and diagnostics where AI is prominently used.
healthcare, AI, patient experience, operations, diagnostics
Multiple Chart
Deloitte
Saved
This slide features a timeline with labeled boxes representing different integrated projects in operation. The timeline includes flags and color-coded boxes for various project details.
Strategic Planning
Energy & Utilities
It showcases a timeline of integrated projects in the oil and gas industry, detailing project names, owners, types, CO₂ storage rates, and rationales for investment, highlighting major milestones.
integrated projects, oil and gas, timeline, CO₂ storage, project names, investment, energy, utilities
Linear Flow
Kearney
Saved
The slide features a bar chart representing investment values across sectors with a key data point highlighted in green. It maintains visual simplicity while conveying quantitative information.
Investment Analysis
Financial Services
An analysis of Q1 2020 investments into emerging internet and tech firms, beneficial for financial and investment strategy discussions, especially within the tech industry.
investments, financial strategy, tech industry, Q1 2020, emerging firms
Single Chart
Bain
Saved
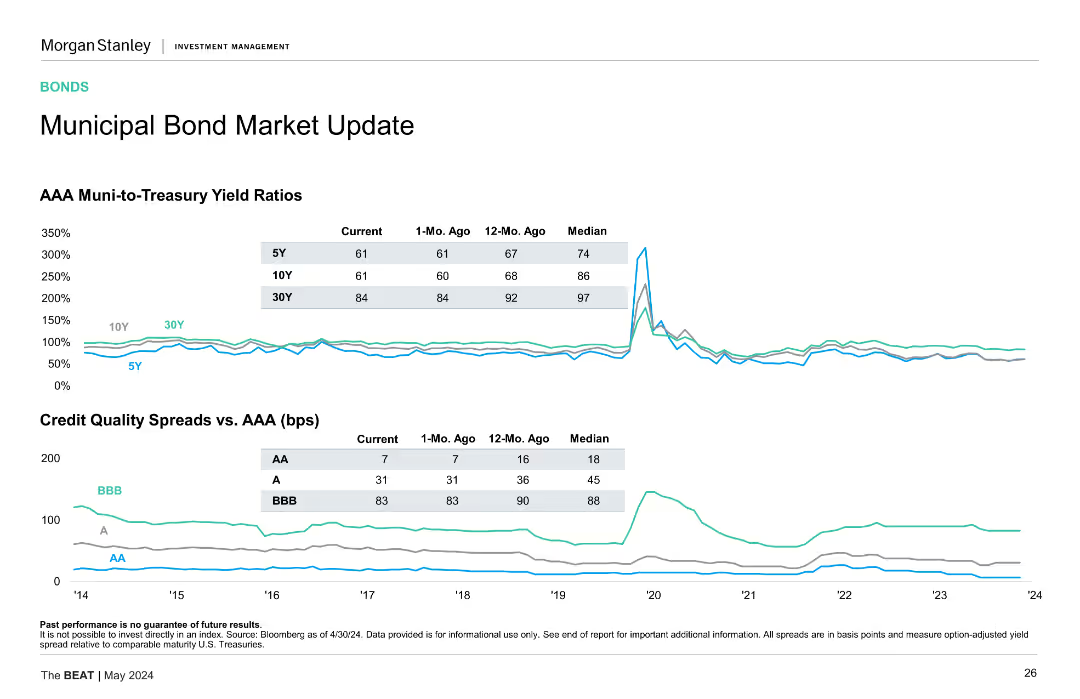
This slide contains two line charts. The first chart shows AAA Muni-to-Treasury yield ratios for 5Y, 10Y, and 30Y bonds. The second chart displays credit quality spreads vs. AAA for AA, A, and BBB bonds. Both charts are accompanied by data tables summarizing the current, 1-Mo. Ago, 12-Mo. Ago, and Median values.
Market Analysis and Trends
Financial Services
The slide updates on municipal bond market conditions, focusing on AAA Muni-to-Treasury yield ratios and credit quality spreads compared to AAA bonds.
Municipal bonds, yield ratios, credit quality, AAA bonds, spreads
Multiple Chart
Morgan Stanley
Saved
Displays three pie charts showing the evolution of podcast advertising campaigns by type from 2018 to 2020, highlighting a shift towards branding.
Strategic Planning
Media & Entertainment
Evaluates changes in the types of advertising campaigns in podcasts, moving from direct response to a focus on branding.
podcast advertising, campaign types, branding, direct response, 2018-2020
Multiple Chart
PwC/Strategy&
Saved
Contains a column chart comparing GBM ROE percentages over time against peer averages, with dark background and dotted lines for comparison.
Financial Performance
Financial Services
This slide analyzes the return profile of Global Banking & Markets, comparing ROE against peers and noting key drivers of increased returns.
ROE, banking, performance, comparison, drivers
Mixed Chart
Goldman Sachs
Saved
A horizontal process diagram illustrates the client experience from solutioning through onboarding, lending, servicing, to content delivery, complemented by performance and efficiency icons.
Operational Efficiency
Financial Services
Focuses on operational excellence and client experience through various banking services.
Client, experience, KYC, lending, servicing, operational, excellence, onboarding, banking
Linear Flow
JP Morgan
Saved
Features a complex stacked column chart showing revenue growth over several years, including acquisitions.
Financial Performance
Financial Services
The slide likely aims to illustrate financial growth and strategic acquisitions for stakeholders or analysts.
Organic Growth, Revenue, Acquisitions, Financial, Analysis, CAGR, Trend, Performance
Single Chart
Goldman Sachs
Saved
This slide has a dual-list structure with icons and data points on the left and implications for the organization on the right, with a central dividing line.
Technology and Digital Transformation
Professional Services
Analyzes the impact of data growth, company lifespan, and public trust on businesses, and what these trends mean for future organizational strategies.
data growth, organizational strategy, public trust, business longevity, competitive advantage
Framework
Deloitte
Saved
The slide consists of several sections, including icons and charts. It features rankings and a pie chart for client distribution. The color palette is blue, gray, and white, maintaining brand consistency.
Market Analysis and Trends
Financial Services
The slide discusses continued growth through comprehensive services and client excellence at JPMorgan Chase. With statistics on market share, revenue, and client distribution, it's useful for presentations that aim to highlight market leadership, growth trends, and commitment to client service across various business sectors.
Markets, Revenue, Growth, Excellence, Client Distribution, Global Expertise, Service Provider, Omnichannel, Trading
Mixed Chart
JP Morgan
Saved
The slide contains column charts showing net interest income, average loans, and average deposits over several quarters.
Financial Performance
Financial Services
This slide provides an analysis of net interest income, average loans, and deposits, showing trends and performance over the recent quarters.
Net Interest Income, Loans, Deposits, Average, Financial, Performance, Trends, Analysis, Quarterly, Data
Multiple Chart
Citigroup
Saved
This slide is dominated by a blue and turquoise bar graph comparing merchant intentions for digital financial services usage. The title and a brief introductory text are placed at the top, and a source citation is at the bottom. The graph is detailed with percentages, making it dense in information.
Market Analysis and Trends
Financial Services
The slide details the expectations of digital merchants towards the adoption of digital financial services over the next couple of years. It specifically quantifies the percentage of merchants likely to increase or maintain their usage of services like digital payments, remittance, insurance, and lending. The purpose of the slide is to convey future usage trends among digital merchants, which is crucial for forecasting and strategic planning in the financial services industry.
Adoption, Digital Merchants, Financial Services, Trends, Payments, Remittance, Insurance, Lending, Growth, Statistics
Single Chart
Bain
Saved
Horizontal bar chart showing contributions to order book growth from various sectors. Uses different colors for each sector and additional columns for order book impact.
Market Analysis and Trends
Financial Services
Analyzes the contributions of different sectors to order book growth, including public sector, CPG, financial services, travel, and big tech, with and without COVID-19 impact.
order book, growth, sectors, impact, analysis
Single Chart
IPSOS
Saved
The slide features bullet points describing a case study of a global retailer. There are two small visual charts on the right: a colorful bar chart and a heat map.
Market Analysis and Trends
Consumer Goods
The slide outlines a case study for a global retailer, including course details, data sources, and an overview of the two-part case study involving sales analysis and recommendations.
case study, global retailer, data analytics, Tableau, sales variance
Mixed Chart
EY
Saved
Slide showcases a set of vertical column charts depicting the year-to-date financial analysis of the S&P 500, focused on metrics like Earnings Growth and Market Cap.
Investment Analysis
Financial Services
Intended for financial analysts, this slide offers a comprehensive year-to-date analysis of the S&P 500 index's performance, highlighting crucial investment insights.
S&P 500, YTD Analysis, Financial Metrics, Earnings Growth, Market Cap, Beta, Dividend Yield, Column Chart
Multiple Chart
Morgan Stanley
Saved
Features comparative column charts for 'Orders and Backlog', 'Revenues', 'EBITA', and 'FOCF' across multiple years, emphasizing trends and performance with the exclusion of Aerostructures. Includes textual annotations with key takeaways.
Strategic Planning
Financial Services
The slide illustrates a historical performance comparison, highlighting achievements and trends that align with or exceed expectations, emphasizing a strategic outlook for future business decisions.
Performance, Revenue, EBITA, FOCF, Historical Data, Business Results, Trend Analysis, Strategic Outlook, Defence, Government
Multiple Chart
Goldman Sachs
Saved
This slide presents a global market analysis for the truck tire segment, using a world map with associated color-coded bar charts and annotations. The charts differentiate between OE and RT market changes, with strategic regional comparisons. Branding is consistent with the Michelin logo placement, and the design is simple, focusing the viewer on the data.
Market Analysis and Trends
Transportation & Logistics
This slide analyzes the global truck tire market, excluding China, with a focus on OE and RT segments. It aims to provide market intelligence and inform strategic decisions in logistics and supply chain planning, suitable for industry analysis briefings or business strategy discussions.
truck tire, market, analysis, OE, RT, global, Michelin, trends, logistics, strategy
Mixed Chart
Morgan Stanley
Saved
This slide shows a title, two column charts displaying trial lengths for FCoA and FCC, and a pie chart depicting reserved judgments delivery time. It uses red and orange hues with clear labels and a note on trial length comparison.
Regulatory and Compliance
Government & Public Sector
It breaks down the trial lengths for matters heard in FCoA and FCC, the percentage of reserved judgments delivered within three months, and highlights the significant difference in trial lengths between the two courts.
FCoA, FCC, trial lengths, reserved judgments, case management, legal proceedings
Multiple Chart
PwC/Strategy&
Saved
Features a column chart showing the range of technology development scores among banks, with a focus on low to high technological capability.
Financial Performance
Financial Services
Discusses the variation in technological development across banks, indicating a broad range of capability from minimal to advanced, relevant for discussions on tech investment strategies in banking.
banking technology, development score, investment strategies, tech capability
Mixed Chart
Accenture
Saved
Displays a series of stacked column charts detailing the sharp decline in private funding across sectors in Indonesia from 2019 to H1 2023. The slide is organized similarly to slide 1821, with a legend and data source included.
Market Analysis and Trends
Technology & Software
Highlights the dramatic reduction in private funding across different sectors in Indonesia, with implications for market analysis and investment strategies.
Indonesia, private funding, sector analysis, 2019-2023 trends, stacked column charts, funding decline.
Single Chart
Bain
Saved
Slide shows a map of Namibia with key economic statistics presented in a segmented arrow design, highlighting data like unemployment rate, GDP growth, and inflation.
Industry Overview
Government & Public Sector
Provides a concise overview of Namibia’s current economic status, detailing key statistics like unemployment, GDP growth, and inflation rates.
Namibia, economic statistics, unemployment, GDP growth, inflation, economic overview
Graphic
PwC/Strategy&
Saved
Previous
Next
If nothing, comes up, please save your slides first
Create a FREE account to continue browsing
Receive Instant Access to 1,000+ slides from companies like McKinsey, Google, and Goldman Sachs
First Name
Last Name
Email
Password
I agree to all
Terms & Privacy Policy
Thank you! Your submission has been received!
Oops! Something went wrong while submitting the form.
Have an account?
Sign in
Column Chart
Heatmap
Chevron
Org Chart
Infographic
Callouts
Timeline
List
Graphic
Picture
Process Flow
Diagram
Paragraph
Map
Table
Framework
Subtitle
Takeaway Box
Icon
Other Chart
Radar Chart
Waterfall Chart
Mekko Chart
Pie Chart
Scatter Plot
Line Chart
Bar chart
Bullet points