My Account
My Slides
Search by Category
Templates
Leave Feedback
Login
Logout
Get Started
Browse all Slides
Browse all Slides
Create a FREE Account
Instant access to 1,000+ real slides from top companies like McKinsey, BCG, Goldman Sachs, Google and many more!
First Name
Last Name
Email
Password
I agree to all
Terms & Privacy Policy
Thank you! Your submission has been received!
Oops! Something went wrong while submitting the form.
Have an account?
Sign in
Saved Slides
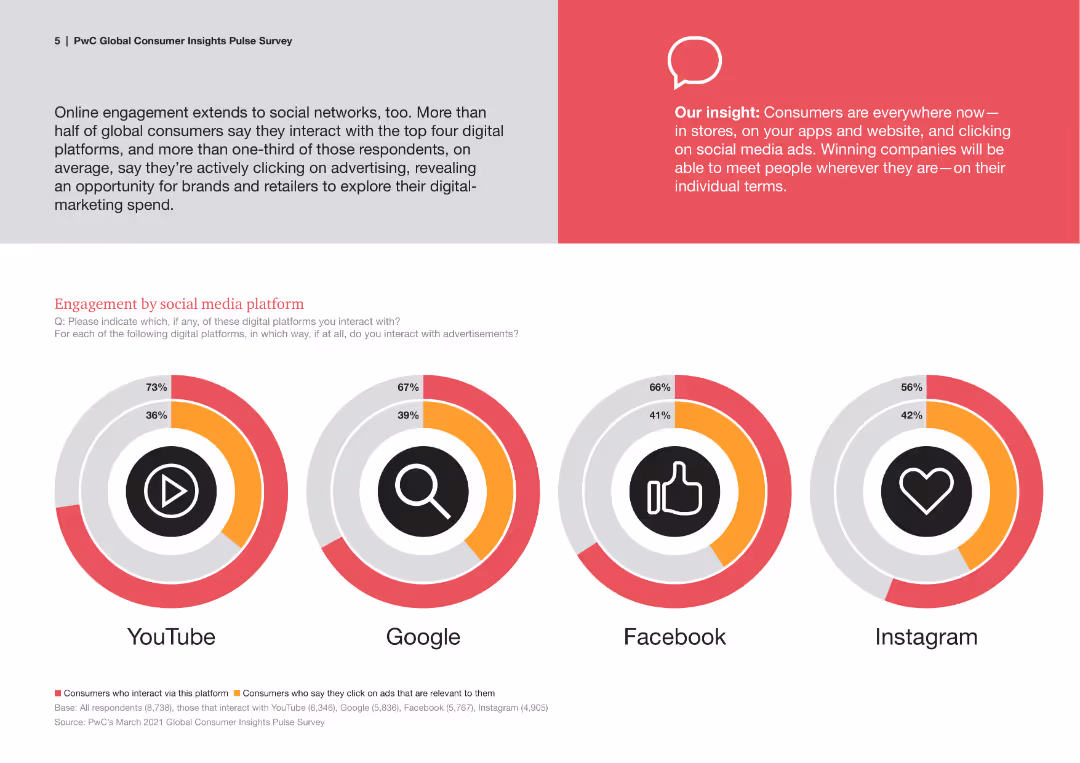
Donut charts displaying consumer engagement and ad interaction across YouTube, Google, Facebook, and Instagram.
Market Analysis and Trends
Media & Entertainment
The slide provides insights into how consumers engage with ads on various social media platforms, revealing interaction trends.
social media, engagement, ad interaction, YouTube, Google, Facebook, Instagram, trends
Multiple Chart
PwC/Strategy&
Saved
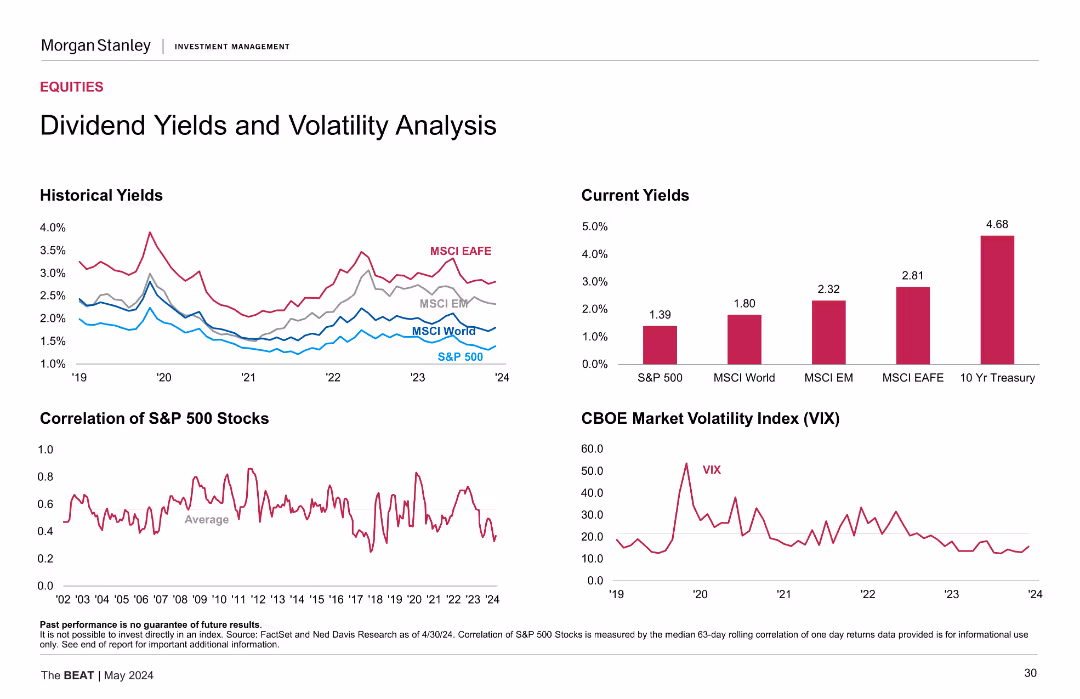
The slide includes multiple line charts and a column chart. The line charts show historical yields for various indices and the correlation of S&P 500 stocks. The column chart displays current yields for S&P 500, MSCI World, MSCI EM, MSCI EAFE, and 10 Yr Treasury. The CBOE Market Volatility Index (VIX) is also plotted as a line chart.
Financial Performance
Financial Services
The slide analyzes dividend yields and market volatility, comparing historical and current yields for various indices, and the correlation of S&P 500 stocks.
Dividend yields, volatility, S&P 500, MSCI, VIX, correlation
Multiple Chart
Morgan Stanley
Saved
This slide features a column chart comparing the percentage of consumers in different countries who think fully self-driving vehicles are not safe between two years.
Market Analysis and Trends
Transportation & Logistics
It analyzes the change in consumer perception regarding the safety of self-driving cars across several countries over two years, showing a trend of increased acceptance.
self-driving, cars, safety, perception, trends
Single Chart
Deloitte
Saved
The slide displays multiple product images under the brand "The Vegetarian Butcher," with accompanying text boxes and a pie chart detailing market segments.
Product and Service Analysis
Consumer Goods
Focuses on the growth and expansion of The Vegetarian Butcher, detailing product offerings and market integration strategies post-acquisition.
plant-based, growth, product expansion, market strategy, acquisition
Mixed Chart
Deutsche Bank
Saved
A title slide with dramatic ocean imagery in the background and bold, white text overlaying it, presenting the report's theme.
Industry Overview
Financial Services
Serves as the introductory slide for a report on global private equity, setting the tone for the data and analysis that will follow.
Private Equity, Global Report, Financial Services, Introduction, Market Overview, Dramatic Imagery, Title Slide
Title
Bain
Saved
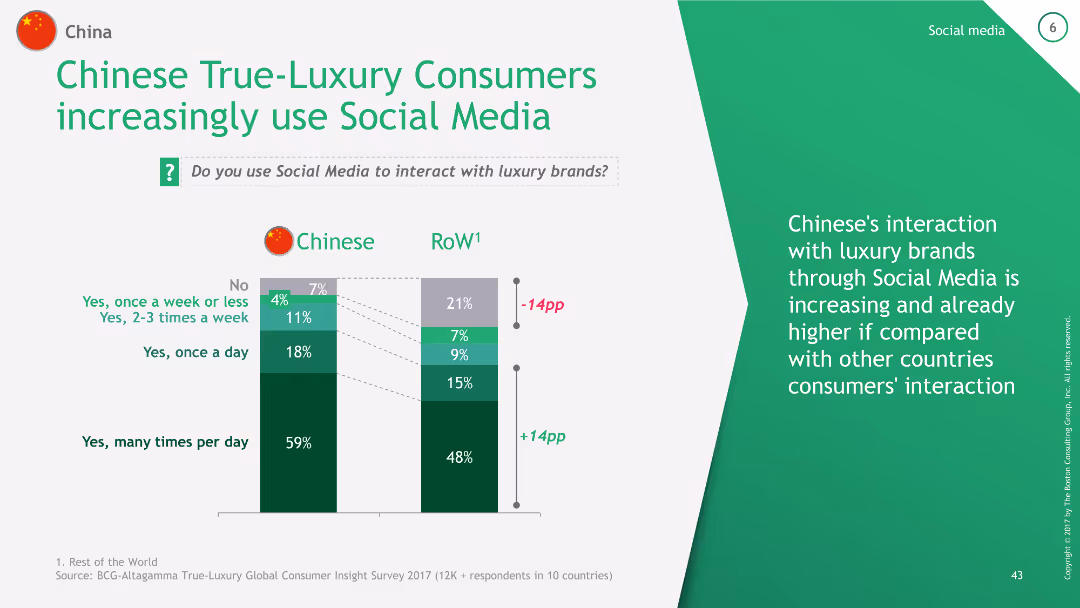
The slide features a column chart comparing the frequency of social media use among Chinese True-Luxury Consumers and the Rest of the World (RoW). It shows four frequency categories: many times per day, once a day, 2-3 times a week, and once a week or less.
Technology and Digital Transformation
Consumer Goods
This slide demonstrates the high frequency of social media use among Chinese luxury consumers compared to global averages, indicating a higher engagement with luxury brands through social media.
China, social media, luxury, engagement, frequency
Mixed Chart
BCG
Saved
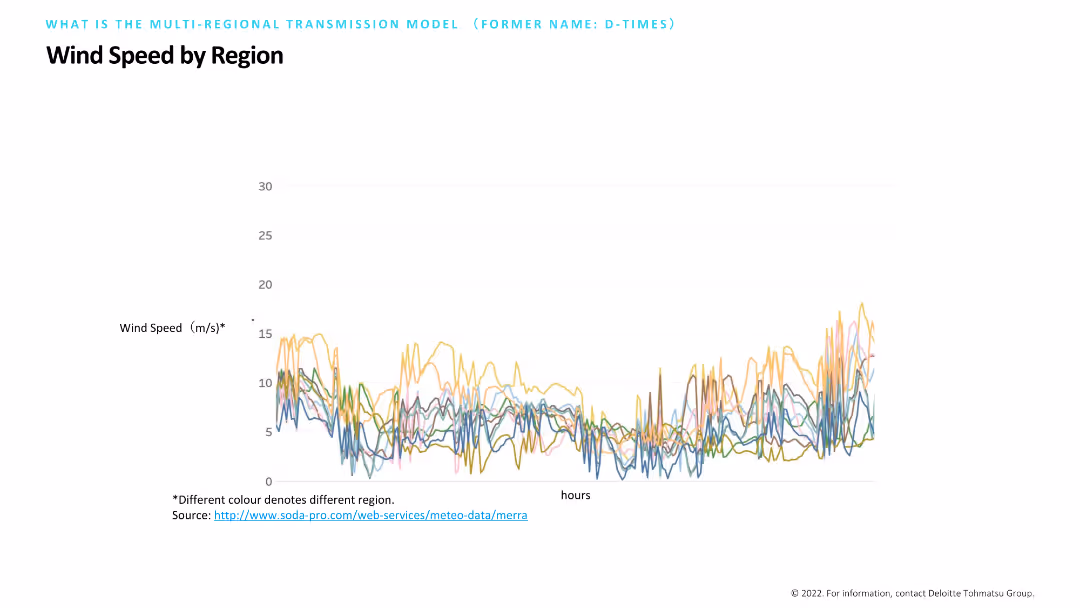
Contains a line chart with multiple colored lines representing wind speed variations across different regions over time. The chart is labeled with wind speed on the Y-axis and hours on the X-axis, with a note indicating the source of data.
Market Analysis and Trends
Environmental Services & Sustainability
Illustrates wind speed variations by region, using a line chart to track changes over time. This data visualization helps in analyzing regional wind patterns, essential for renewable energy planning and assessing the viability of wind power projects.
Wind Speed, Region, Data, Renewable, Analysis
Single Chart
Deloitte
Saved
Two bar charts comparing PMPM costs in New England and with comparable enrollees. Text boxes explain key points and data. Moderate layout.
Financial Performance
Government & Public Sector
Comparison of MMIS spending per member per month (PMPM) in New Hampshire versus other states, suggesting cost minimization strategies.
PMPM, MMIS, Costs, Comparison, Strategy
Multiple Chart
Alvarez & Marsal
Saved
The slide contains multiple column charts and a bar chart showing data on private equity dry powder, unrealized portfolio value, and fundraising activity.
Market Analysis and Trends
Financial Services
The slide discusses the positive outlook for sponsor dynamics in private equity, indicating continued activity into 2019, with supportive data.
sponsor dynamics, private equity, 2019, dry powder, portfolio value, fundraising, activity, market analysis
Multiple Chart
Credit Suisse
Saved
Column chart showing the recovery of share prices across multiple industries. Uses a mix of green and blue to show recovery and remaining declines.
Market Analysis and Trends
Financial Services
Analyzes share price recovery across industries post-COVID-19, highlighting which sectors have bounced back or still struggle.
Share prices, Recovery, COVID-19, Industries, Analysis
Single Chart
McKinsey
Saved
Slide presents a bar chart assessing the quality of underwriting processes across various criteria like strategy and tools, with varying shades indicating quality levels.
Operational Efficiency
Financial Services
Reviews the current quality of underwriting processes within a company, showing areas of strength and those needing improvement across various functions.
underwriting quality, assessment, process improvement, strategic quality, tool effectiveness
Mixed Chart
Accenture
Saved
Includes a scatter plot chart correlating the number of high-growth companies with GVA by local authorities, supplemented with descriptive text and a key.
Regulatory and Compliance
Government & Public Sector
Explores the relationship between the density of high-growth companies and local economic performance measured by GVA, offering insights into regional economic policies.
local economies, high-growth companies, GVA, economic impact, local authorities, regional development, policy implications, economic analysis, public sector
Mixed Chart
Barclays
Saved
The slide lists core, business, procurement, and digital skills, categorized by yesterday's, today's, and tomorrow's skills with a detailed skills layout table.
Technology and Digital Transformation
Professional Services
It outlines the evolving skills needed for procurement success, emphasizing digital transformation, strategic alliances, and advanced analytics.
Procurement skills, digital transformation, strategic alliances, analytics, talent development, future skills
Multiple Chart
Kearney
Saved
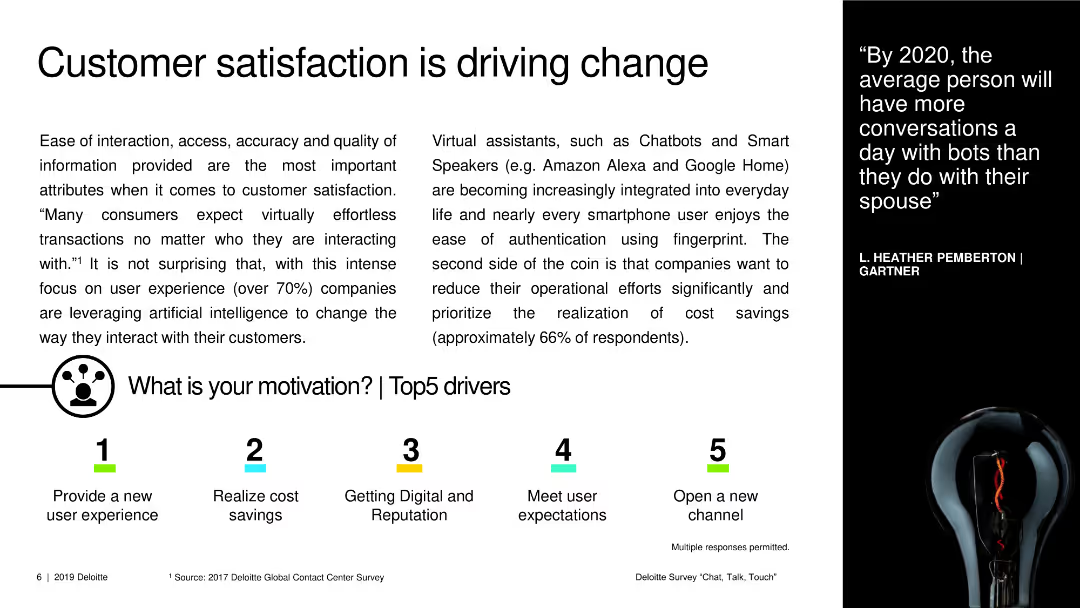
A text slide with a mix of textual content and small graphical icons, emphasizing customer satisfaction and its drivers.
Strategic Planning
Technology & Software
The slide discusses the importance of customer satisfaction and lists top drivers such as new user experience and cost savings.
customer satisfaction, drivers, strategic planning, user experience, cost savings, technology
Linear Flow
Deloitte
Saved
The slide features a detailed flowchart showing biomass feedstock market dynamics, including land demand, land use, consumption pattern, biomass residues, primary biomass, and bioenergy consumption. It illustrates the drivers for biomass residues and primary biomass.
Market Analysis and Trends
Energy & Utilities
This slide analyzes the market dynamics of biomass feedstock, detailing the factors influencing land demand, consumption patterns, and the production of biomass residues and primary biomass, as well as their implications for bioenergy consumption.
biomass feedstock, market dynamics, land demand, land use, consumption pattern, biomass residues, primary biomass, bioenergy consumption
Linear Flow
Kearney
Saved
Slide with title and subtitle, utilizes a puzzle graphic as a metaphor for critical components of disciplined underwriting. Also, features two column charts showing approval rates and card NCO rates based on deposit relationships.
Risk Assessment and Management
Financial Services
This slide could be used to illustrate the advantages of deepened banking relationships in risk management. It uses underwriting as a case study to show how customer data from non-card relationships can inform better risk decisions, with graphical data supporting the claims.
Risk Management, Underwriting, Banking Relationships, Data Utilization, Customer Data, Deposit Relationships, Approval Rates, Financial Services, Card NCO Rates, Chase
Mixed Chart
JP Morgan
Saved
This slide features multiple vertical column charts comparing traditional and social/casual gaming revenue growth in Mainland China, the US, and globally from 2020 to 2025. The slide layout is dense with data and includes red and grey bars representing different gaming types within each geographical focus.
Market Analysis and Trends
Media & Entertainment
The slide analyzes video gaming revenue trends from 2020 to 2025, highlighting the growth in different gaming types (traditional vs. social/casual) across Mainland China, the US, and globally. It predicts significant revenue growth in the gaming industry, emphasizing the dominant market positions of China and the US.
video games, revenue growth, traditional gaming, social gaming, market analysis
Multiple Chart
PwC/Strategy&
Saved
Slide includes bar charts and a remarks section. Focuses on account premium sizes and net premiums written by companies, segmented by line of business with explanatory remarks.
Market Analysis and Trends
Financial Services
Examines the financial aspects of insurance underwriters' profiles, focusing on average account premium and company's net premiums across different lines of business.
financial analysis, insurance, premiums, account size, company revenue, business lines, personal lines, commercial lines, specialty lines
Multiple Chart
Accenture
Saved
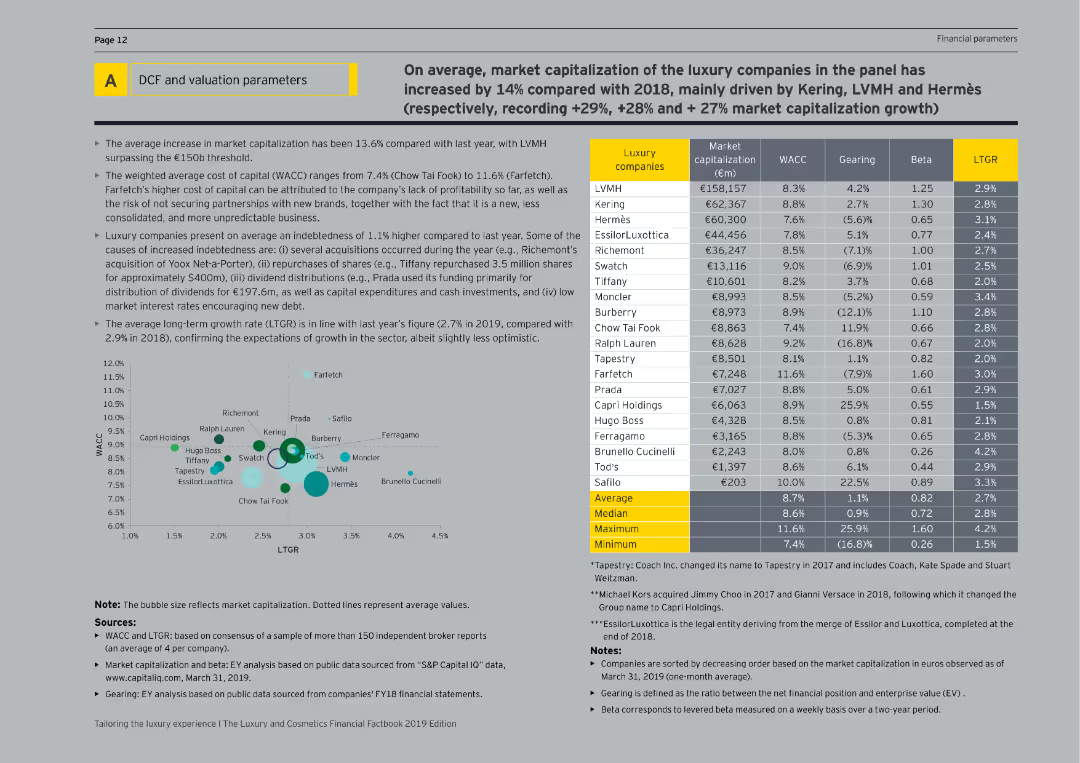
This slide features tables and bubble charts showing the market capitalization, WACC, gearing, beta, and LTGR of luxury companies.
Financial Performance
Consumer Goods
The slide presents detailed financial parameters of luxury companies, including market capitalization, cost of capital, and gearing ratios, with comparisons and growth expectations.
Valuation parameters, luxury companies, financial metrics, market capitalization, WACC
Mixed Chart
EY
Saved
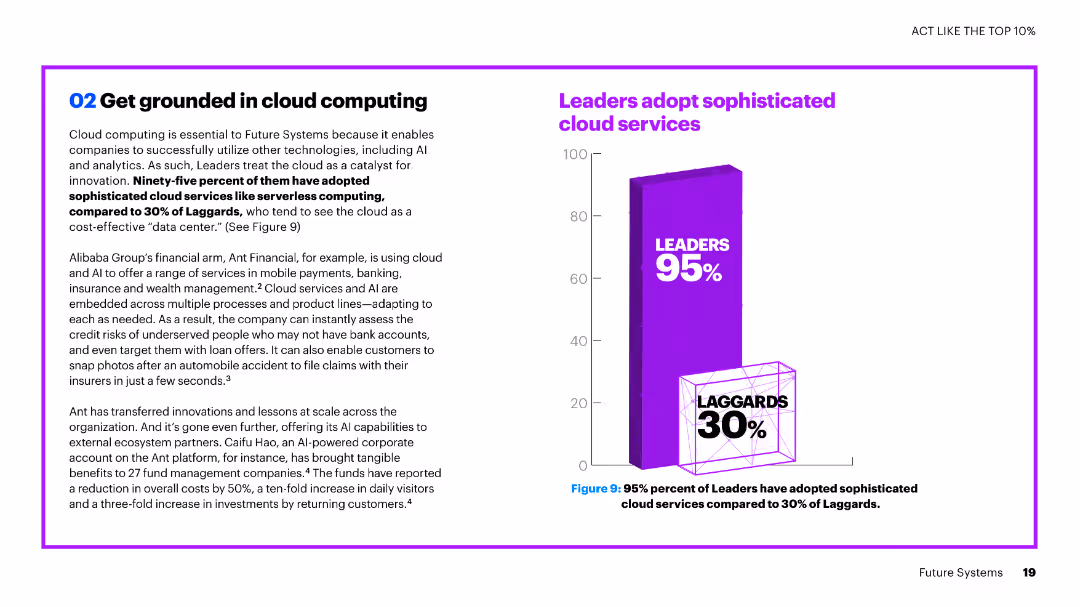
The slide features a combination of text and a vertical column chart. The chart shows a comparison of leaders and laggards in adopting sophisticated cloud services.
Technology and Digital Transformation
Technology & Software
The slide explains the importance of cloud computing in leveraging advanced technologies like AI and analytics, highlighting the adoption rates of sophisticated cloud services among leaders versus laggards.
cloud computing, AI, analytics, adoption, leaders, laggards, services, comparison, technology
Mixed Chart
Accenture
Saved
This slide contains a large area chart comparing mobile banking's growth to branch banking over a six-year period. There are additional blue boxes with concise texts highlighting the significance of the mobile banking trend.
Technology and Digital Transformation
Financial Services
The slide depicts the growth trend of mobile banking versus branch banking in the U.S., indicating customer preferences. Useful for discussing changes in consumer behavior and the importance of mobile banking solutions.
Mobile Banking, Branch Banking, Customer Preference, Growth Trend, Digital Disruption, Banking Anytime, Unsatisfied Demand
Mixed Chart
Morgan Stanley
Saved
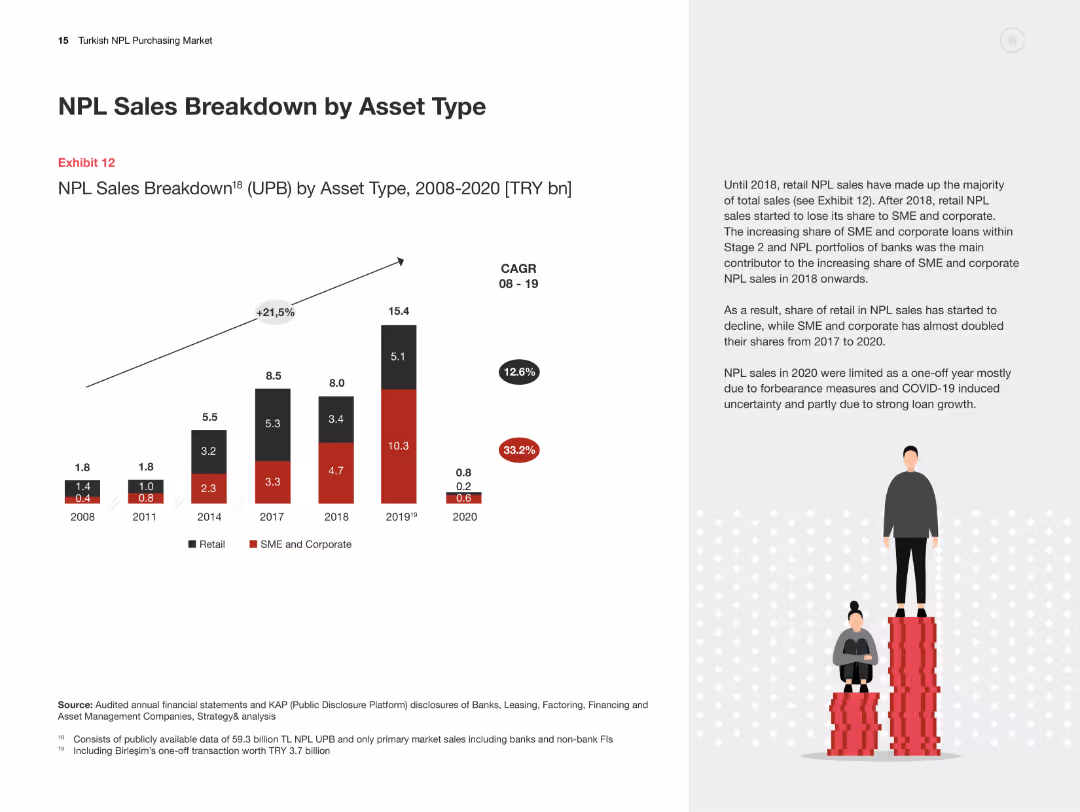
Column chart illustrating NPL sales breakdown by asset type from 2008-2020. Text discusses the shift in asset types.
Market Analysis and Trends
Financial Services
The slide categorizes NPL sales by asset type, showing trends from 2008-2020 and explaining shifts in retail and corporate loans.
NPL sales, asset types, retail loans, corporate loans, financial analysis, Turkey
Mixed Chart
PwC/Strategy&
Saved
Features a table showing spot returns vs. USD and EUR for various currencies over multiple time frames (1 month, YTD, 1 year, 3 years, 5 years) and local interest rates. Also includes a line chart for the U.S. Dollar Index performance over time.
Financial Performance
Financial Services
Analyzes the performance and yields of developed market currencies compared to USD and EUR, highlighting changes in spot returns and interest rates. Useful for currency market analysis and investment strategies.
currency performance, yields, USD, EUR, spot returns, interest rates, U.S. Dollar Index
Mixed Chart
Morgan Stanley
Saved
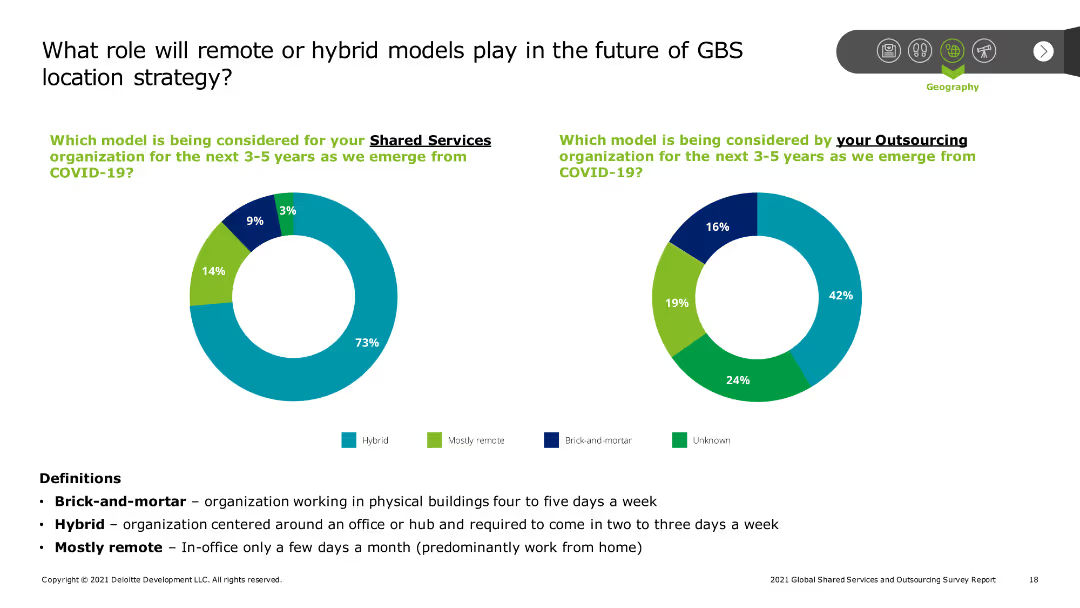
This slide presents two pie charts comparing models considered for shared services and outsourcing organizations post-COVID-19, including hybrid, remote, and brick-and-mortar models. Text provides definitions and key points.
Technology and Digital Transformation
Professional Services
The slide explores the role of remote or hybrid work models in the future of GBS location strategy, showing the distribution of preferred models for shared services and outsourcing organizations.
Remote work, hybrid models, GBS, location strategy, post-COVID-19
Multiple Chart
Deloitte
Saved
The slide uses a combination of text and pie charts, with a focus on survey results. It is moderately dense, featuring textual analysis on the left and charts on the right.
Human Resources and Talent Management
Government & Public Sector
Discusses how governing workforce strategies apply to public services, emphasizing the need for new questions to leverage predictive analytics for decision-making.
workforce, analytics, public sector, strategy, decision-making, survey results, internal changes, external changes
Multiple Chart
Deloitte
Saved
Previous
Next
If nothing, comes up, please save your slides first
Create a FREE account to continue browsing
Receive Instant Access to 1,000+ slides from companies like McKinsey, Google, and Goldman Sachs
First Name
Last Name
Email
Password
I agree to all
Terms & Privacy Policy
Thank you! Your submission has been received!
Oops! Something went wrong while submitting the form.
Have an account?
Sign in
Column Chart
Heatmap
Chevron
Org Chart
Infographic
Callouts
Timeline
List
Graphic
Picture
Process Flow
Diagram
Paragraph
Map
Table
Framework
Subtitle
Takeaway Box
Icon
Other Chart
Radar Chart
Waterfall Chart
Mekko Chart
Pie Chart
Scatter Plot
Line Chart
Bar chart
Bullet points