My Account
My Slides
Search by Category
Templates
Leave Feedback
Login
Logout
Get Started
Browse all Slides
Browse all Slides
Create a FREE Account
Instant access to 1,000+ real slides from top companies like McKinsey, BCG, Goldman Sachs, Google and many more!
First Name
Last Name
Email
Password
I agree to all
Terms & Privacy Policy
Thank you! Your submission has been received!
Oops! Something went wrong while submitting the form.
Have an account?
Sign in
Saved Slides
A column chart and a table showing global distribution of skilled workforce and top countries by skilled workforce.
Human Resources and Talent Management
Education & Training
Highlights global distribution and forecast of skilled workers, focusing on growth in Asia Pacific, Africa, and Latin America.
Skilled workforce, global distribution, Asia Pacific, Africa, Latin America, workforce forecast
Mixed Chart
Accenture
Saved
The slide has two distinct sections: on the left, a vertical list of competitive advantages with dark blue horizontal bars; on the right, future goals with numeric rankings and bullet points.
Strategic Planning
Financial Services
The slide presents key advantages that position the company for future growth and outlines specific forward goals with rankings in various financial sectors.
competitive, advantages, growth, financial, banking, market share, execution, global reach, trusted advisor
Table
Goldman Sachs
Saved
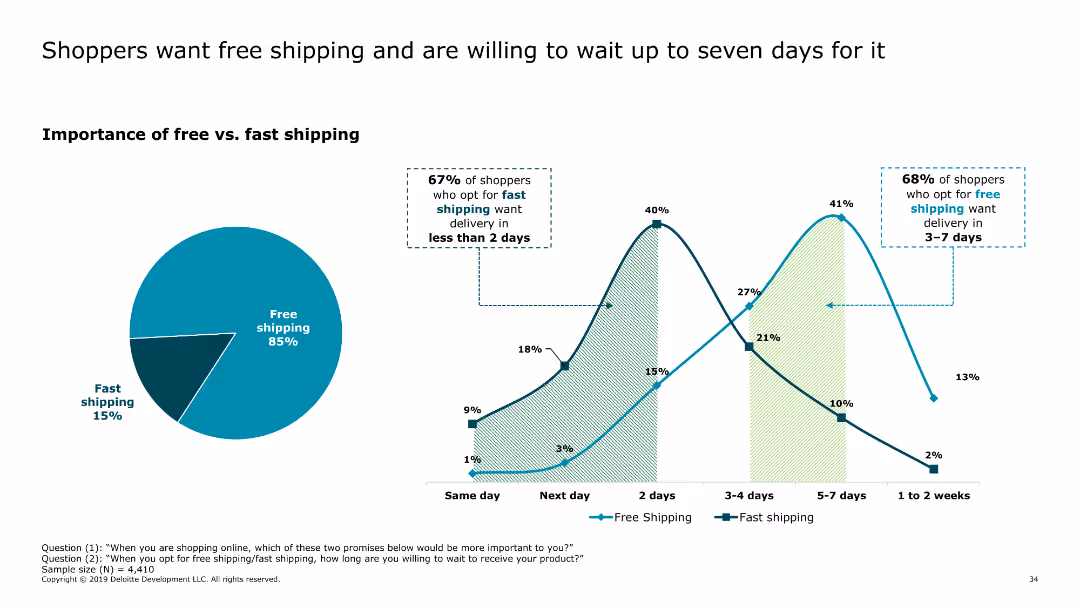
This slide includes a pie chart showing the importance of free versus fast shipping, along with a line chart illustrating delivery time preferences for free and fast shipping options.
Market Analysis and Trends
Retail & E-commerce
The slide highlights consumer preferences for free shipping over fast shipping, with many shoppers willing to wait up to seven days for free delivery. It provides insights into delivery expectations and preferences.
free shipping, delivery preferences, consumer behavior, online shopping, shipping options
Multiple Chart
Deloitte
Saved
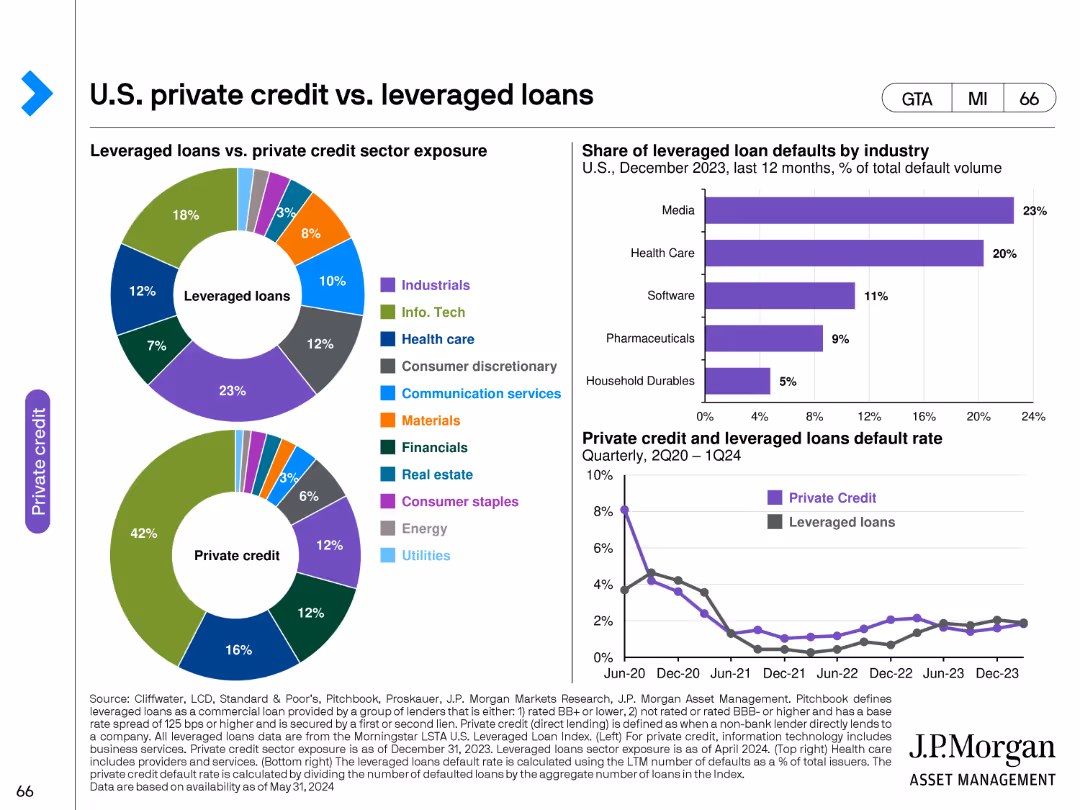
This slide features two pie charts and one line chart. The pie charts compare sector exposure between leveraged loans and private credit. The line chart shows the share of leveraged loan defaults by industry from December 2023 to 2024.
Investment Analysis
Financial Services
The slide compares the sector exposures of leveraged loans and private credit, and analyzes the default rates by industry, providing a comprehensive view of risk and sector distribution in private credit markets.
private credit, leveraged loans, sector exposure, defaults, investment
Multiple Chart
JP Morgan
Saved
Line chart showing the evolution of business volumes per employee and per branch from 2008 to 2023. Purple and grey color scheme with clear markers for each year.
Market Analysis and Trends
Financial Services
Tracks the growth of business volumes per employee and branch over 15 years, highlighting significant increases in recent years.
business volumes, growth, employee, branch, evolution
Multiple Chart
Kearney
Saved
Flow diagram detailing the consumer journey for essential items, with online and offline touchpoints.
Customer and Market Segmentation
Retail & E-commerce
Describes consumer behavior for essential items, highlighting the importance of an integrated channel experience.
essential items, shopping behavior, consumer journey, online shopping, retail
Header Horizontal
Bain
Saved
The slide contains a column chart showing market concentration levels across different access modes using an alternative approach, which considers outlet homepages within the last 5 steps and excludes subsequent visits. Annotations provided.
Market Analysis and Trends
Media & Entertainment
This slide examines market concentration levels (HHI) by access mode using an alternative approach that includes outlet homepages within the last 5 steps before reaching news articles and excludes subsequent visits, offering insights into media concentration.
Alternative Approach, Market Concentration, HHI, Column Chart, Access Mode
Single Chart
IPSOS
Saved
Slide includes a line chart comparing past and expected future marketing hires, segmented by economic sector.
Human Resources and Talent Management
Professional Services
Analyzes trends in marketing recruitment, indicating a recovery to pre-Covid hiring levels and sectors leading the growth.
hiring trends, marketing recruitment, sector comparison, growth analysis, line graph
Mixed Chart
Deloitte
Saved
Slide with a list layout, including bullet points and headers, detailing strategy points in a clear, readable format without additional visual elements.
Strategic Planning
Financial Services
JP Morgan's strategic focus areas such as customer engagement, digital tool scaling, expense management, and risk control are outlined on this slide. Intended for communicating to stakeholders how the company intends to grow and strengthen its market position.
Strategy, Customer Engagement, Digital Tools, Expense Management, Risk Control
Table
JP Morgan
Saved
The slide shows a line chart projecting China's future scrap supply and demand, with various scenarios outlined.
Strategic Planning
Industrial & Manufacturing
The slide projects future scenarios for China's scrap supply and demand by 2025, exploring potential industry developments and strategic considerations.
China, scrap, supply, demand, 2025, bar chart, column chart
Single Chart
McKinsey
Saved
This slide features a mix of text and a column chart. The text is on the left side, while the chart is on the right. The chart highlights various performance optimization approaches by percentage.
Investment Analysis
Financial Services
The slide discusses different approaches APAC family offices plan to implement to optimize performance and measure success, focusing on ESG factors and sustainability initiatives.
APAC, family offices, performance, optimization, ESG
Mixed Chart
EY
Saved
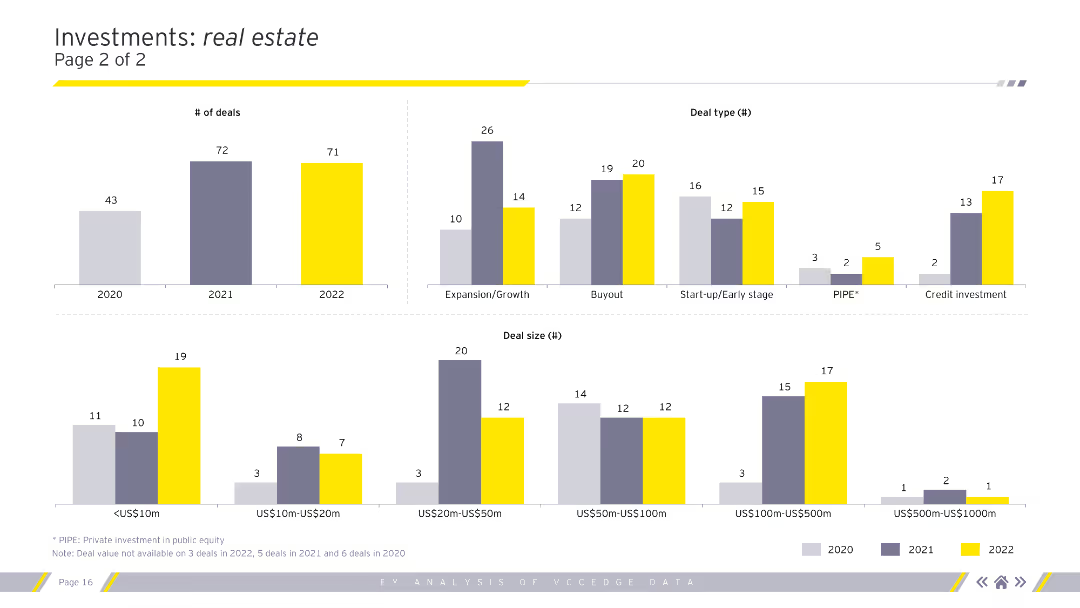
Column charts showing the number of deals, deal types, and deal sizes in the real estate sector for 2020-2022.
Market Analysis and Trends
Real Estate & Construction
Continued analysis of investment types, sizes, and segments within the real estate sector.
real estate, deals, deal types, deal sizes, analysis
Multiple Chart
EY
Saved
Slide includes stacked column charts representing participation in the second-hand market by age group, in varying shades of green.
Market Analysis and Trends
Retail & E-commerce
Analyzes the age-related dynamics of the second-hand luxury market, showing how younger generations are more active participants.
second-hand market, consumer demographics, luxury goods, age comparison, market participation
Multiple Chart
BCG
Saved
Two scatter plots: one comparing Trade Openness Index to years until 25% adoption in the US, and the other relating GII to internet adoption rates. Text discusses the influence of globalization on adoption rates.
Technology and Digital Transformation
Technology & Software
The slide examines the relationship between globalization, network effects, and technology adoption. It highlights how higher trade openness and innovation indices correlate with faster technology adoption, emphasizing the role of global interactions and network effects in accelerating the diffusion of innovations.
Globalization, Network Effects, Adoption, Trade Openness Index
Multiple Chart
Roland Berger
Saved
A column chart shows predicted expenses for 2023 with additional annotations on integration costs and considerations from FDIC. The layout is straightforward with clear divisions between sections.
Financial Performance
Financial Services
The slide outlines JPMorgan Chase's expense projections for 2023, excluding costs related to First Republic. It includes a detailed analysis of various business units and factors that might impact these expenses, like FDIC assessments and labor inflation.
Expense Outlook, FDIC, First Republic, Financial Analysis, JPMorgan Chase
Mixed Chart
JP Morgan
Saved
Two pie charts showing the distribution of business banking relationships, accompanied by a column chart showing the growth of talech customers, using blue tones.
Sales and Business Development
Financial Services
Presents the expansion strategy in business banking, indicating the potential for deepening customer relationships and adding new customers through various payment solutions.
Business Banking, talech, Bento, Growth
Multiple Chart
Goldman Sachs
Saved
The slide contains a mix of text, pie charts, and infographics. The layout is structured into sections including an analysis of business cases, development sources, and risks.
Strategic Planning
Government & Public Sector
This slide presents a case study for Indonesia’s planned new capital, using a five-case model to analyze its strategic, financial, commercial, economic, and management cases.
Case study, green city, inclusive, smart, capital, strategic planning, Indonesia, development, financial, risks
Single Chart
BCG
Saved
The slide presents a comparative analysis of monthly passenger vehicle sales year-over-year for several countries (US, Germany, Italy, Sweden, China, South Korea, Japan). Each country has a bar graph with monthly data from January to July, with bars colored to indicate the percentage change compared to the previous year. The design is straightforward, with clear labels and a color-coded system that helps in quickly identifying trends and deviations in vehicle sales.
Market Analysis and Trends
Transportation & Logistics
This slide is useful for analyzing trends in the automotive sector, particularly how different regions are recovering from economic impacts of COVID-19 on vehicle sales. It allows stakeholders to compare market dynamics and consumer confidence across various countries, aiding in strategic planning for production adjustments, marketing strategies, and inventory management. The clear month-by-month breakdown helps in understanding the timing and effectiveness of economic recovery measures and consumer sentiment towards vehicle purchases.
vehicle sales, COVID-19, market analysis, economic recovery, automotive sector, consumer confidence, strategic planning
Multiple Chart
BCG
Saved
This slide features multiple bar charts, comparing the prevalence of economic threats across global regions. Each region's chart has a distinct set of data points, with color coding to distinguish between different concerns. The layout is clean, with a clear distinction between charts and descriptive text.
Market Analysis and Trends
Financial Services
This slide presents a visual comparison of various economic threats perceived globally and in specific regions. It can be used to understand regional concerns in economic growth and policy, informing strategic decisions in global business operations.
Economic growth, Risk assessment, Policy uncertainty, Cyber threats, Geopolitical instability, Trade conflicts
Multiple Chart
PwC/Strategy&
Saved
This slide contains a complex column chart with annotations.
Investment Analysis
Financial Services
This slide visualizes factors that investors prioritize in making investment decisions, highlighting growth, FCF generation, and business strategy as top factors.
investment, growth, strategy, FCF, business
Multiple Chart
BCG
Saved
A conceptual circular diagram illustrates the strategy with keywords such as "scale," "engage," and "deepen" in different colors. There is minimal text other than labels and the company logo.
Strategic Planning
Financial Services
Depicts the strategic approach of JP Morgan in building customer engagement and deepening relationships, with focus on scaling through products and marketing.
strategy, engagement, customer relationships, scale, deepen
Linear Flow
JP Morgan
Saved
Includes stacked column charts and column charts detailing provisions for credit losses and the status of stage 3 loans across various bank divisions, enhanced with quantitative data and coverage ratios.
Risk Assessment and Management
Financial Services
Analyzes provisions for credit losses and the condition of stage 3 loans at Deutsche Bank in Q2 2023, offering insights into the bank's financial health and risk management practices.
Credit losses, stage 3 loans, risk management, financial health, Deutsche Bank, Q2 2023, banking sectors
Multiple Chart
Deutsche Bank
Saved
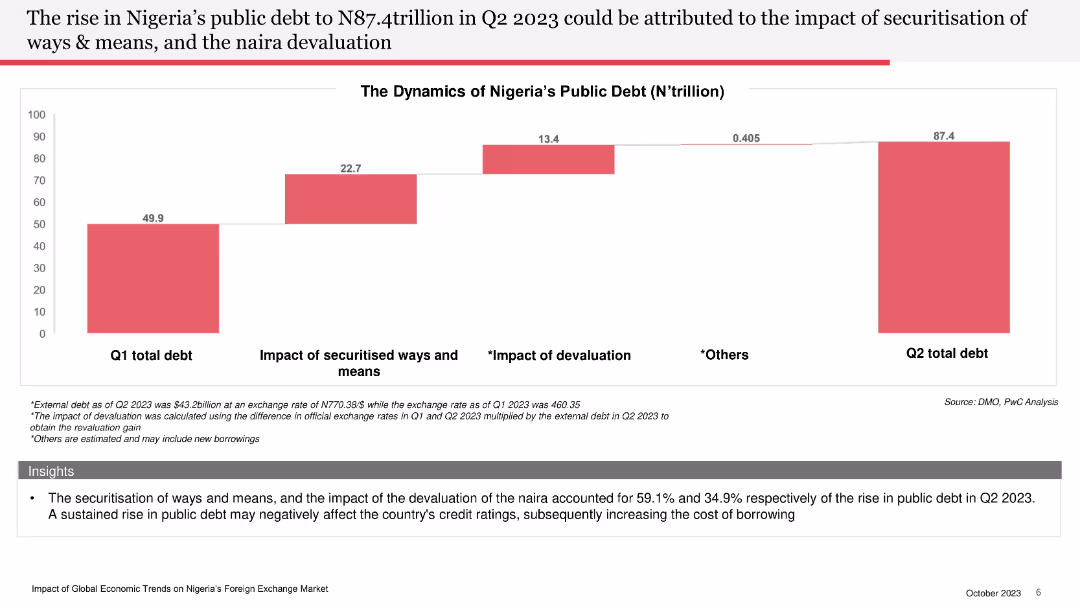
Shows a column chart of public debt components and their contributions to the total debt in Q2 2023.
Financial Performance
Financial Services
Discusses the rise in public debt and the factors contributing to it, including naira devaluation and securitisation of ways and means.
public debt, Nigeria, Q2 2023, securitisation, naira devaluation, financial performance, debt components
Mixed Chart
PwC/Strategy&
Saved
A column chart showing ownership model splits and a table detailing profitability across leasing, subscription, rental, and sharing models.
Market Analysis and Trends
Transportation & Logistics
Explores the rise of alternative vehicle ownership models, projecting potential growth and profitability of leasing, subscription, rental, and sharing models by 2035.
alternative ownership, leasing, subscription, rental, sharing
Mixed Chart
PwC/Strategy&
Saved
A multi-stacked column chart displays deal values across sectors from 2017 to H1 2021. It’s a complex visual with varied colors for each sector, requiring more focus to interpret the layered information.
Market Analysis and Trends
Financial Services
Provides a detailed breakdown of deal values within sectors such as e-commerce, transport & food, and digital financial services over multiple years, pinpointing the sustained focus and prominence of e-commerce and financial services deals.
Deal Values, Sectors, E-commerce, Financial Services
Single Chart
Bain
Saved
Previous
Next
If nothing, comes up, please save your slides first
Create a FREE account to continue browsing
Receive Instant Access to 1,000+ slides from companies like McKinsey, Google, and Goldman Sachs
First Name
Last Name
Email
Password
I agree to all
Terms & Privacy Policy
Thank you! Your submission has been received!
Oops! Something went wrong while submitting the form.
Have an account?
Sign in
Column Chart
Heatmap
Chevron
Org Chart
Infographic
Callouts
Timeline
List
Graphic
Picture
Process Flow
Diagram
Paragraph
Map
Table
Framework
Subtitle
Takeaway Box
Icon
Other Chart
Radar Chart
Waterfall Chart
Mekko Chart
Pie Chart
Scatter Plot
Line Chart
Bar chart
Bullet points