My Account
My Slides
Search by Category
Templates
Leave Feedback
Login
Logout
Get Started
Browse all Slides
Browse all Slides
Create a FREE Account
Instant access to 1,000+ real slides from top companies like McKinsey, BCG, Goldman Sachs, Google and many more!
First Name
Last Name
Email
Password
I agree to all
Terms & Privacy Policy
Thank you! Your submission has been received!
Oops! Something went wrong while submitting the form.
Have an account?
Sign in
Saved Slides
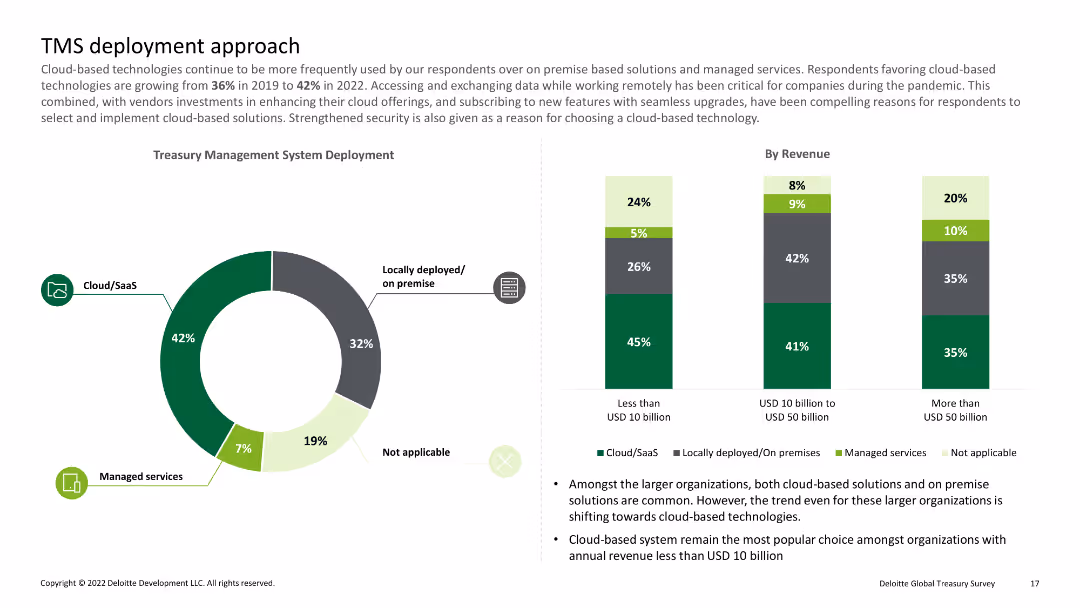
Pie chart showing percentages of cloud/SaaS, locally deployed, and managed services; bar charts detailing deployment by revenue
Technology and Digital Transformation
Financial Services
Discusses the shift towards cloud-based treasury management systems and their deployment among organizations of varying revenue sizes.
Cloud, SaaS, deployment, revenue, treasury
Multiple Chart
Deloitte
Saved
The slide features a title, two sections with column charts, and additional small text boxes with statistics. The first chart shows the growth in consumers with hybrid fitness routines from 2020 to 2022. The second part has comparison stats on health outcomes between hybrid fitness consumers and general respondents.
Market Analysis and Trends
Healthcare & Pharmaceuticals
This slide discusses the increasing adoption of hybrid fitness models, comparing data from 2020 and 2022. It provides evidence of effectiveness by showing higher positive health outcomes among hybrid fitness users versus all respondents. The slide could be used to discuss market trends in health and fitness and consumer behavior changes post-pandemic.
Hybrid fitness, health outcomes, consumer trends, market analysis, data comparison
Single Chart
McKinsey
Saved
This slide is focused on the Chinese luxury goods market, featuring a column chart that track consumption growth from 2012 to 2017, compared to non-Chinese markets. It uses contrasting colors like red for China and gray for other markets, effectively highlighting the differences in growth rates.
Market Analysis and Trends
Consumer Goods
Highlights the booming luxury goods consumption in China, contrasting it with more moderate growth in other global markets. Details the impact of increased consumer confidence and economic factors in China, while providing a broader view of global market trends.
China, luxury goods, market growth, consumer behavior, global comparison
Single Chart
Bain
Saved
This slide features a series of bar charts evaluating energy and power portfolios based on CTF scores, alongside a comprehensive text breakdown of Barclays' client engagement strategies in transitioning to lower-emission operations.
Client Case Studies
Financial Services
Describes how Barclays assesses and engages with clients on their ESG performance using the Client Transition Framework, offering insights into sector-specific transition plans and executive engagement.
client engagement, ESG performance, transition planning, sector analysis, sustainability, client assessment
Multiple Chart
Barclays
Saved
Includes two pie charts showing the frequency of core and secondary bank relationship reviews. Text explains the importance of systematic reviews.
Operational Efficiency
Financial Services
Highlights the lack of regular review of bank relationships by treasurers, suggesting systematic, scheduled reviews to enhance service and future readiness.
Bank relationships, review, frequency, systematic, treasurers
Mixed Chart
PwC/Strategy&
Saved
Bar chart showing percentages of family offices not confident in various tax operations, with supporting text.
Regulatory and Compliance
Financial Services
Addresses the lack of confidence in tax operations among APAC family offices, detailing areas of concern.
tax operations, confidence, APAC, family offices, transparency
Mixed Chart
EY
Saved
The slide features a balance sheet summary on the left with a simple table layout, and credit metrics on the right with numerical highlights and explanatory texts. The design includes shaded boxes and clear separation of content areas.
Financial Performance
Financial Services
This slide compares a company's balance sheet and credit profile, with a focus on cash, debt, and capital structure, as well as credit metrics like EBITDA and leverage ratio. It’s tailored for financial analysts or investors looking at company stability, creditworthiness, and financial health.
Balance Sheet, Credit Profile, EBITDA, Net Leverage, Capital, Financial Health
Boxed
Goldman Sachs
Saved
The slide uses a table and bar charts to present data on different innovation levers with activity levels and trends over time.
Sales and Business Development
Technology & Software
Discusses the optimization of innovation processes, highlighting key levers such as innovation strategy, new structures, and non-core innovations.
Innovation, Strategy, Optimization, Trends
Pillar
Roland Berger
Saved
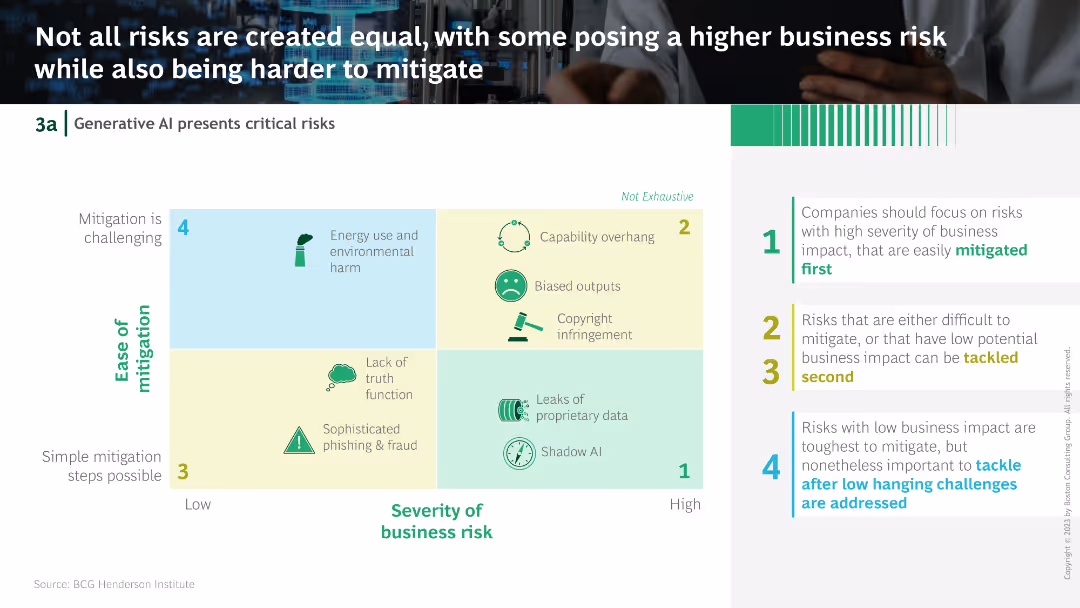
A grid comparing different risks of Generative AI in terms of ease of mitigation and severity of business impact, color-coded for clarity.
Risk Assessment and Management
Technology & Software
This slide categorizes the risks of Generative AI by their ease of mitigation and severity of business impact, suggesting a prioritization strategy for addressing these risks.
Generative AI, risks, mitigation, business impact, strategy
Diagram
BCG
Saved
The slide displays a line graph charting the trend in Eurozone interest rates, with a predictive dotted line extending into the future. There are also infographic elements, such as icons, describing the factors impacting monetary policy. The design is professional with a blue and grey color scheme.
Risk Assessment and Management
Financial Services
It examines the impact of monetary policy on interest rates and how these changes could affect a company's earnings. It's valuable for financial analysts, CFOs, and investors in discussions about interest rate risk, strategic financial planning, or forecasting economic conditions.
monetary policy, interest rates, Eurozone, inflation, earnings impact
Mixed Chart
Morgan Stanley
Saved
The slide features a horizontal bar chart that displays the effectiveness of exception closure in meter point analytics. Each bar represents a different category, showing closure rates in red and green colors.
Operational Efficiency
Energy & Utilities
This slide evaluates the effectiveness of exception closures in meter point analytics, using a horizontal bar chart to compare closure rates across different categories, helping improve operational processes.
Meter Point, Analytics, Exception Closure, Effectiveness, Bar Chart
Single Chart
EY
Saved
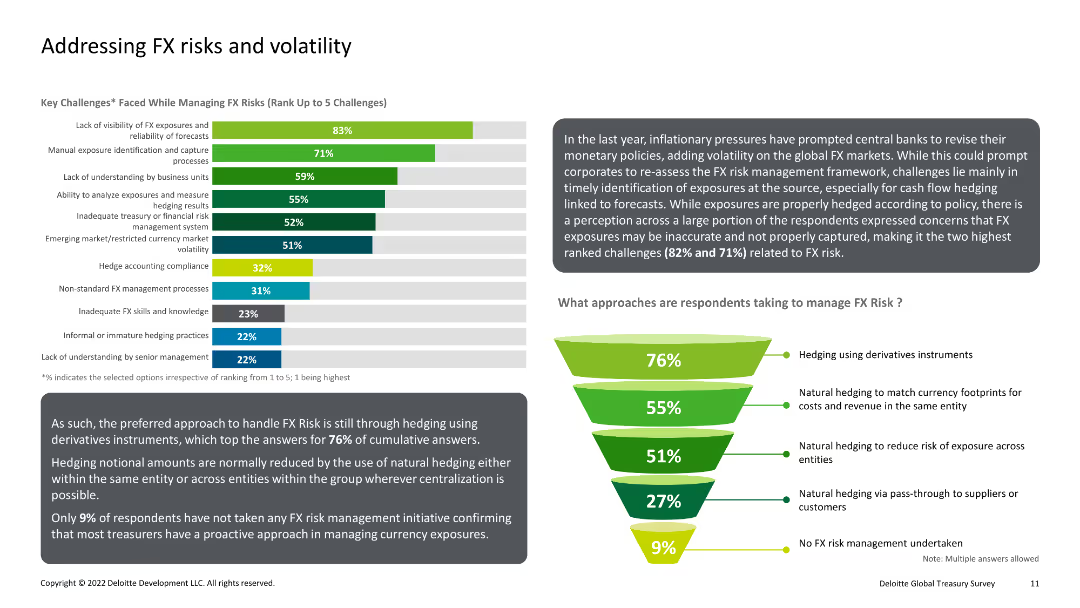
Bar chart and funnel diagram showing key challenges in managing FX risks and the approaches taken to mitigate them. The chart uses various shades of green and blue for visual differentiation.
Risk Assessment and Management
Financial Services
This slide discusses the main challenges faced in managing foreign exchange (FX) risks and volatility, and presents the preferred approaches used by respondents to address these challenges, including hedging strategies.
FX, Risks, Volatility, Hedging, Management
Multiple Chart
Deloitte
Saved
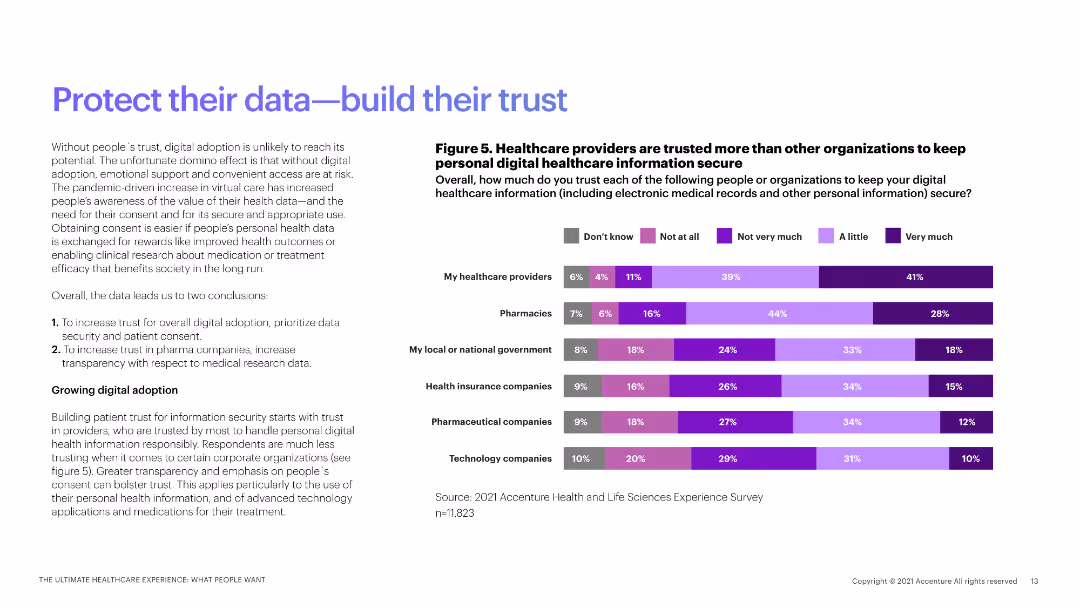
A bar chart showing trust levels in different organizations for keeping digital healthcare information secure, with a detailed explanation on the left.
Risk Assessment and Management
Healthcare & Pharmaceuticals
This slide presents survey data on trust levels in various organizations to secure personal digital healthcare information.
trust levels, healthcare providers, data security, digital information, survey results
Mixed Chart
Accenture
Saved
The slide shows a bar chart comparing the top 5 services consumers use or want in an EV app across different regions (APAC, EMEA, North America). Icons and colors differentiate services.
Strategic Planning
Transportation & Logistics
The slide presents the results of a survey on the most desired features in EV apps, illustrating regional differences in consumer preferences. It aims to guide EV app development strategies.
EV apps, consumer preferences, regional analysis, digital tools, survey results
Mixed Chart
PwC/Strategy&
Saved
Features line graphs and column charts detailing economic indicators, interest rates, and credit cycle concerns.
Risk Assessment and Management
Financial Services
Examines the potential cyclical headwinds faced by the industry and the economic growth forecasts.
Economic indicators, interest rates, credit cycle, economic growth, cyclical headwinds
Multiple Chart
JP Morgan
Saved
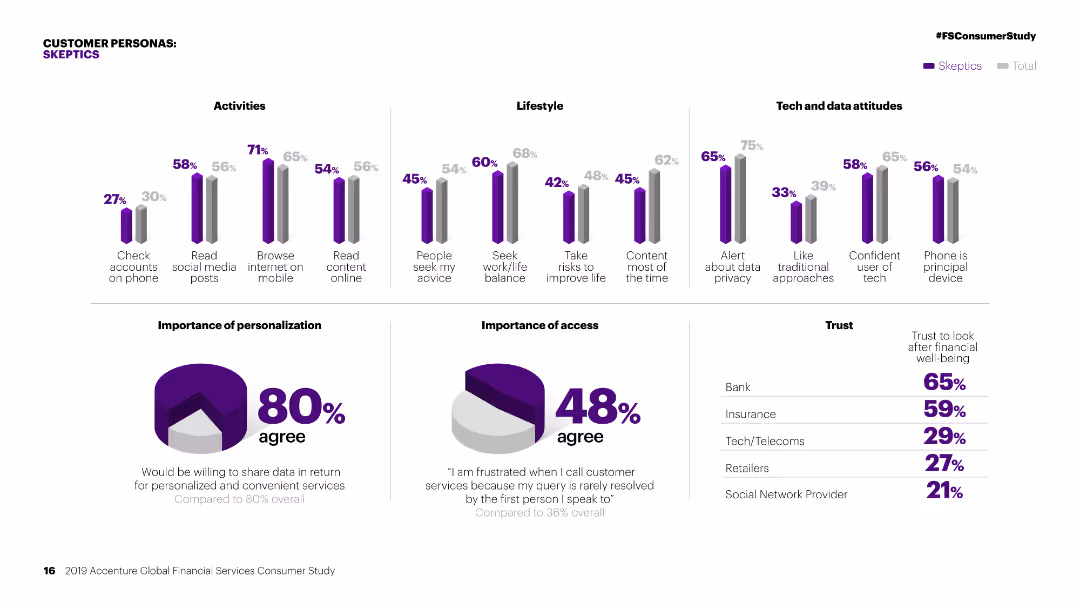
Column charts showing activities, lifestyle, and tech attitudes of 'Skeptics' compared to the total. Pie charts on personalization and access.
Customer and Market Segmentation
Financial Services
Detailed segmentation of 'Skeptics' in financial services, focusing on their activities, lifestyle, attitudes towards tech, and personalization preferences.
Personas, financial services, segmentation, skeptics, activities, lifestyle, tech attitudes, personalization, market study, access
Multiple Chart
Accenture
Saved
Two column charts: Left chart depicts cumulative alternatives fundraising in billions from 2020 to 2024. Right chart shows alternatives management and other fees from 2019 to 2024. An arrow highlights the growth in fees and fundraising targets, accompanied by key financial data.
Product and Service Analysis
Financial Services
Analyzes the firm's growing momentum in the alternatives business sector, with projected fundraising and fee earnings through 2024. It demonstrates the firm's strategic targets for alternatives investments, signifying confidence in the market's growth potential.
alternatives business, growth momentum, fundraising, fees, strategy, column chart
Multiple Chart
Goldman Sachs
Saved
Circular diagram showing the product lifecycle stages (Pre-Launch, At Launch, In Market) and associated services Ipsos offers, with text descriptions of each stage.
Strategic Planning
Professional Services
Outlines the different stages of a product lifecycle and the various services Ipsos provides to support clients at each stage. Emphasizes strategic planning and service integration.
Product Lifecycle, Strategic Planning, Services, Ipsos
Diagram
IPSOS
Saved
Two line charts: one showing Euro area central bank interest rate from 2021 to 2025F and one showing US central bank interest rate for the same period, with historical data, market expectations, and forecasts.
Market Analysis and Trends
Financial Services
This slide discusses how easing inflation and slowing economic momentum will push central banks to recalibrate policies, with gradual rate cuts expected instead of rapid reductions.
interest rates, central banks, inflation, economic momentum, rate cuts, forecast
Multiple Chart
EY
Saved
The slide features a large header in bold type, two bar graphs comparing ASEAN and OECD firms in terms of formal training offerings, and the number of training hours per employee. The layout is split into two sections with dark and light blue bars representing different regions. There are two callout boxes with recommendations at the bottom.
Market Analysis and Trends
Education & Training
The slide contrasts the percentage of firms offering formal training and the number of training hours per employee between ASEAN and OECD countries. It advocates for government intervention to increase corporate training programs. The aim is to facilitate a competitive edge for companies by ensuring training compliance, particularly in digital skill areas, over a 5-year growth target.
Training, ASEAN, OECD, Government Policy, Corporate Training, Digital Skills, Formal Training, Employee Development, Competitiveness, Growth Target
Multiple Chart
Kearney
Saved
Circular diagrams compare leadership structures pre and post-merger, highlighting streamlining and reduction of management layers.
Strategic Planning
Financial Services
Explains the restructuring of leadership to streamline operations post-merger, enhancing focus and efficiency.
leadership, restructuring, merger, efficiency, circular diagram
Linear Flow
Barclays
Saved
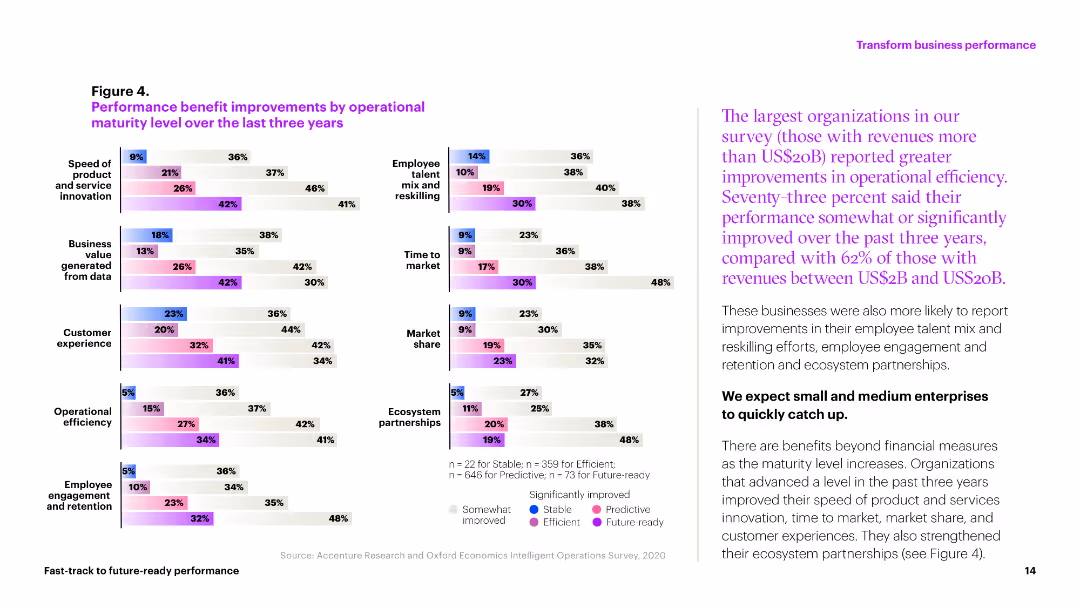
The slide includes multiple column charts showing performance improvements in various operational metrics over three years. Colors differentiate levels of improvement across categories like market share and efficiency.
Operational Efficiency
Professional Services
This slide illustrates the operational improvements achieved by organizations in areas like customer experience, market share, and operational efficiency over the past three years.
performance, improvements, metrics, efficiency, market share
Multiple Chart
Accenture
Saved
A three-part comparative layout discussing major M&A highlights across industries, including energy, financial services, and consumer sectors.
Market Analysis and Trends
Financial Services
Highlights key M&A activities in 2020, focusing on industries like energy and financial services, including major deals and industry impacts.
M&A, 2020, Philippines, energy, financial services, consumer, industry focus
Pillar
Deloitte
Saved
This slide illustrates a circular diagram with six sectors, each representing a factor critical to successful digital marketing strategies.
Strategic Planning
Professional Services
Describes six key factors, both technical and organizational, essential for success in digital marketing.
digital marketing, success factors, technical, organizational, strategy, key factors
Diagram
BCG
Saved
Blue and white color scheme with multiple graphics. There's a flowchart at the top, three outlined boxes below indicating rankings (#1 Primary bank market share, #2 SMB credit card spend, #1 Payment provider), and logos for VISA and Chase.
Market Analysis and Trends
Financial Services
The slide communicates Chase's market position and services offered to SMBs, highlighting key rankings in primary bank market share and SMB credit card spend.
Banking, SMBs, Chase, Market Share, Credit Card, Payment Provider, Rankings, Services, Business
Linear Flow
JP Morgan
Saved
Previous
Next
If nothing, comes up, please save your slides first
Create a FREE account to continue browsing
Receive Instant Access to 1,000+ slides from companies like McKinsey, Google, and Goldman Sachs
First Name
Last Name
Email
Password
I agree to all
Terms & Privacy Policy
Thank you! Your submission has been received!
Oops! Something went wrong while submitting the form.
Have an account?
Sign in
Column Chart
Heatmap
Chevron
Org Chart
Infographic
Callouts
Timeline
List
Graphic
Picture
Process Flow
Diagram
Paragraph
Map
Table
Framework
Subtitle
Takeaway Box
Icon
Other Chart
Radar Chart
Waterfall Chart
Mekko Chart
Pie Chart
Scatter Plot
Line Chart
Bar chart
Bullet points