My Account
My Slides
Search by Category
Templates
Leave Feedback
Login
Logout
Get Started
Browse all Slides
Browse all Slides
Create a FREE Account
Instant access to 1,000+ real slides from top companies like McKinsey, BCG, Goldman Sachs, Google and many more!
First Name
Last Name
Email
Password
I agree to all
Terms & Privacy Policy
Thank you! Your submission has been received!
Oops! Something went wrong while submitting the form.
Have an account?
Sign in
Saved Slides
Slide includes a mekko chart showcasing investment distribution by sector in Malaysia, focusing on solar and sustainable industries. Visuals are clean and professionally presented.
Investment Analysis
Energy & Utilities
Reviews the investment landscape in Malaysia, particularly in the renewable energy sector, highlighting potential growth areas and key investors.
Malaysia, investment, green energy, solar, sustainable development
Single Chart
Bain
Saved
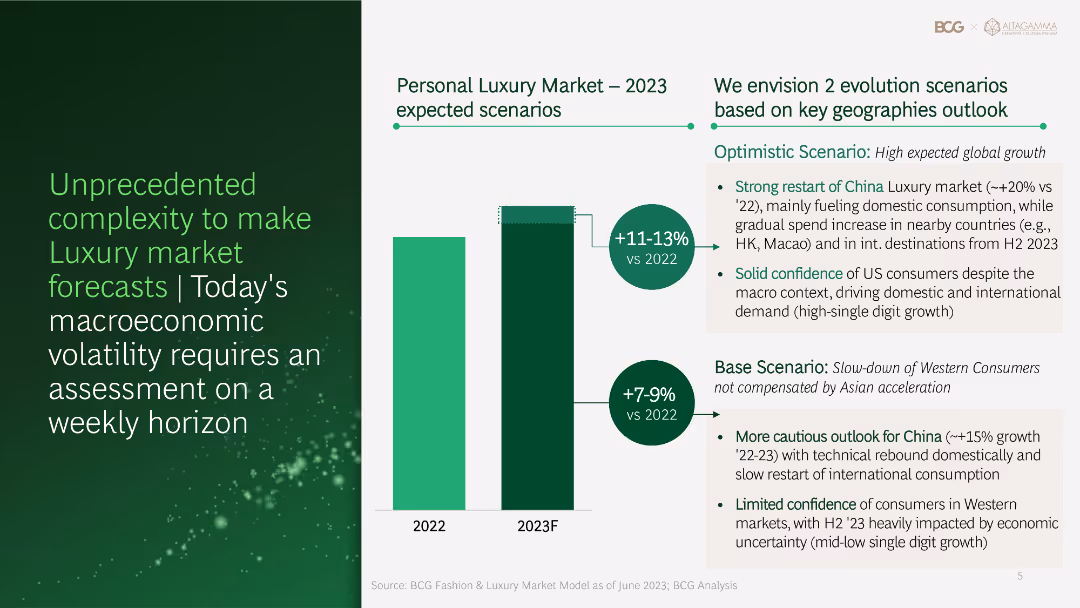
Column chart and text showing different growth scenarios for the personal luxury market in 2023, highlighting optimistic and base scenarios based on geographical outlooks.
Risk Assessment and Management
Financial Services
Discusses the complexities in forecasting the luxury market, presenting optimistic and base scenarios for 2023 growth based on geographical trends and macroeconomic factors.
luxury market, forecast, growth scenarios, geographical outlooks, macroeconomic
Mixed Chart
BCG
Saved
Composed of a colorful performance matrix, this slide visually distinguishes annual returns across various asset classes over multiple years for quick analysis.
Investment Analysis
Financial Services
Ideal for identifying historical performance trends, this data-driven slide allows investors to discern patterns and outliers in asset class returns over an extended period, aiding long-term strategic investment planning.
Asset Class, Annual Returns, Performance Trends, Data Matrix, Long-term Analysis, Color-Coded, Financial Planning
Table
Morgan Stanley
Saved
Features tables and a column chart summarizing the financial performance of the Institutional Clients Group, including net income, revenues, and credit costs. The design uses blue tones.
Financial Performance
Financial Services
This slide details the quarterly financial results of an institutional client group, highlighting key metrics like revenues and net income, and providing a segmented revenue breakdown. Ideal for financial reviews or stakeholder presentations to discuss company performance.
Financial, Institutional, Clients, Revenue, Credit Costs, Net Income, Performance, Analysis
Mixed Chart
Citigroup
Saved
This slide is moderate in complexity with a dual-tab layout, one focusing on HealthTech and one on EdTech, with text boxes and color-coded areas indicating various levels of technology adoption during the lockdown.
Market Analysis and Trends
Education & Training
The slide discusses the significant yet incomplete adoption of EdTech tools in education during lockdowns, with a focus on areas with heavy, moderate, and potential for increased adoption.
EdTech, lockdown, adoption, video lectures, methodologies
Table
Bain
Saved
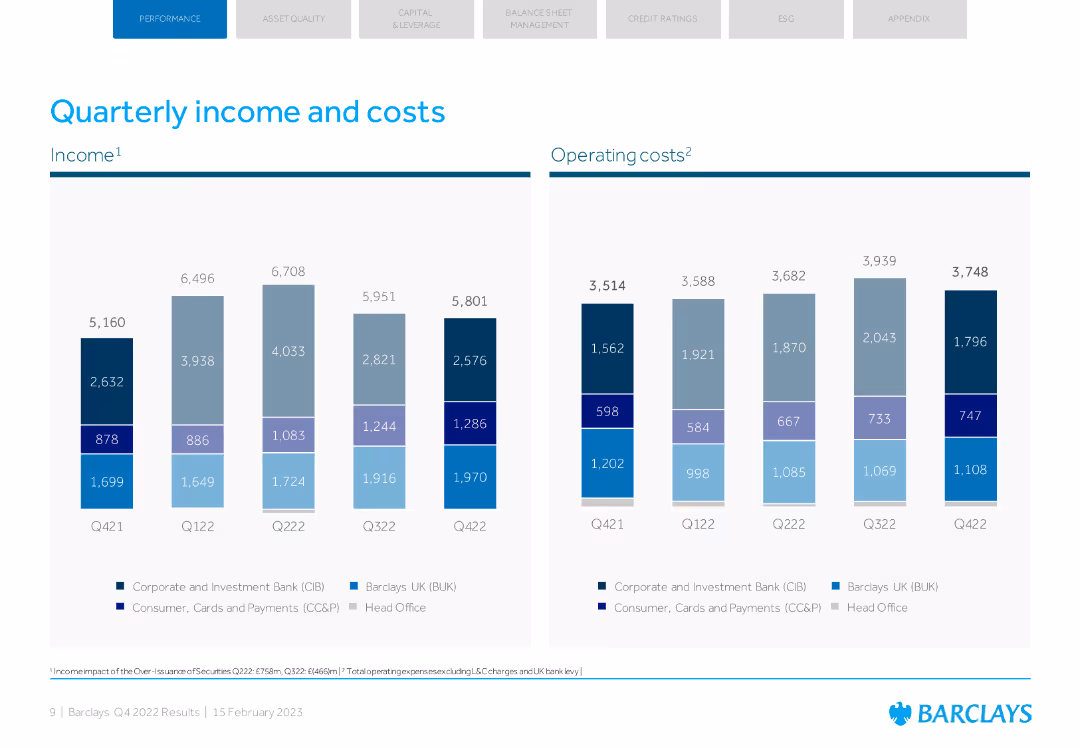
The slide includes two column charts, one for income and one for operating costs across different quarters. The design is clean with blue and grey colors.
Financial Performance
Financial Services
The slide presents quarterly comparisons of Barclays' income and operating costs, highlighting financial trends over the past year.
quarterly income, operating costs, Barclays, financial trends, FY22
Multiple Chart
Barclays
Saved
Shows a donut chart and a gauge chart examining the emotional engagement of managers with their teams. The charts use distinct color segments to illustrate different responses.
Human Resources and Talent Management
Professional Services
Analyzes managers' emotional engagement, essential for HR strategy sessions aiming to improve internal communication and team morale.
emotional engagement, managers, HR
Multiple Chart
PwC/Strategy&
Saved
The slide contains a flowchart with three phases outlined, text descriptions, and several bullet points. It is moderately complex with a clear visual path to follow.
Strategic Planning
Financial Services
This slide depicts the company’s future strategy in three phases, highlighting the current phase and the objectives for the coming years. It is used for explaining strategic investment plans and expected outcomes.
strategy, phases, execution, investment, planning, outcomes
Linear Flow
Citigroup
Saved
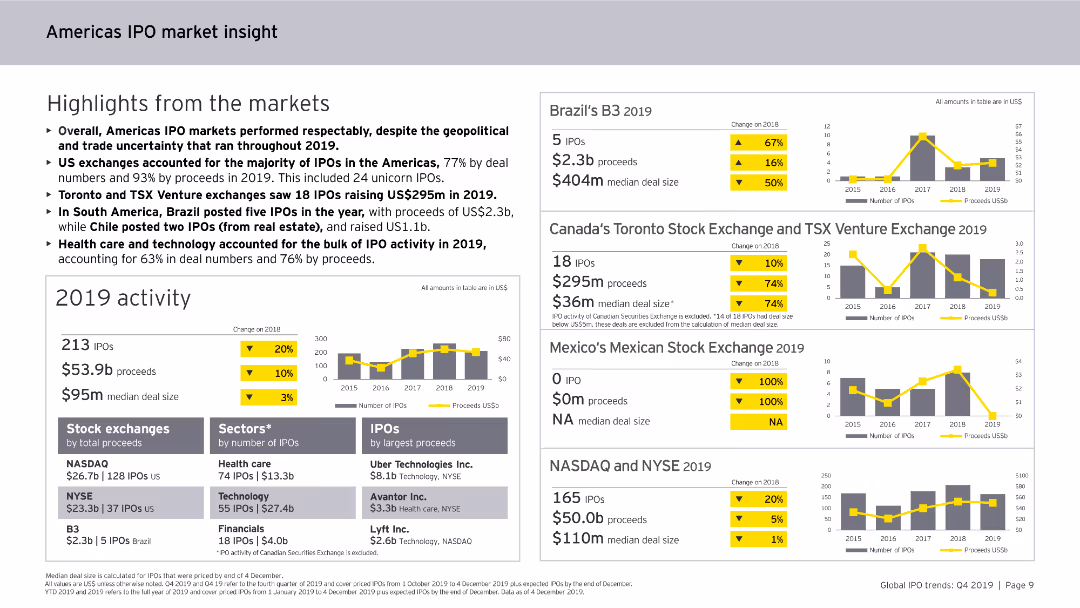
Contains column charts, data tables, and bullet points. The slide is visually dense, focusing on IPO activities and trends in the Americas for 2019.
Market Analysis and Trends
Financial Services
Highlights the performance of IPO markets in the Americas for 2019, including sector-specific analysis, major exchanges, and trends in IPO deal sizes and proceeds.
Americas, IPO, market insight, 2019, trends
Multiple Chart
EY
Saved
Featuring a mobile device graphic, pie chart, and column chart, the slide is moderately detailed with text descriptions emphasizing digital client engagement and the value proposition.
Market Analysis and Trends
Financial Services
The slide demonstrates the role of digital channels in client acquisition and growth in self-directed investing accounts, emphasizing the integrated banking and investing experience. It is useful for illustrating the digital engagement trend and its impact on client account growth and banking integration.
Digital engagement, Client acquisition, Growth, Self-directed investing
Multiple Chart
JP Morgan
Saved
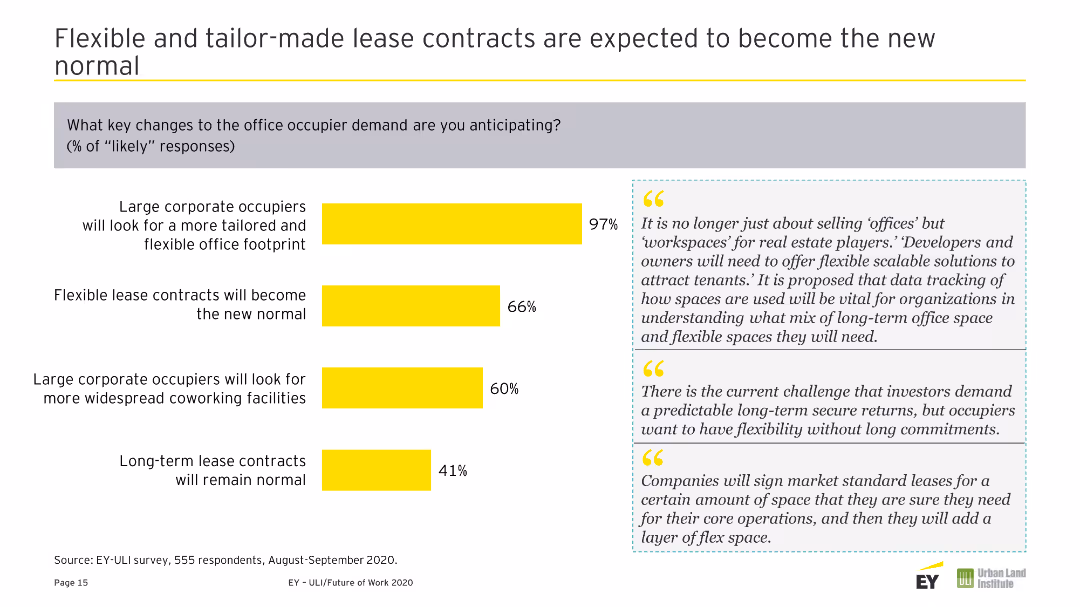
Column chart illustrating challenges from the Future of Work. Includes two text quotes on the right side in gray boxes. Uses yellow and gray colors.
Risk Assessment and Management
Real Estate & Construction
Identifies top challenges such as increased IT costs, loss of corporate culture, and less effective talent management.
IT Costs, Corporate Culture, Talent, Management, Turnover, Innovation, Creativity, Challenges, Future of Work
Mixed Chart
EY
Saved
The slide contains a table listing leading CCUS countries by capture capacity, number of operational projects, and type of storage.
Industry Overview
Energy & Utilities
Highlights North America's leadership in CCUS projects, detailing capture capacities, number of projects, and storage types for leading countries.
CCUS, North America, global leadership, capture capacity, operational projects, storage types
Mixed Chart
Kearney
Saved
This slide features a mixed chart with bars representing the industry wallet in advisory, equity, and debt, and a line indicating Goldman Sachs Fee Share. Annotations explain the growth strategy.
Market Analysis and Trends
Financial Services
Discussing the company's core business areas, the slide details the growth in market share across advisory, equity, and debt segments. It quantifies the financial implications of increasing market share, outlining strategic priorities for sector and regional expansion, and capturing acquisition financing opportunities.
Core Business, Market Share, Advisory, Equity, Debt, Growth Strategy
Mixed Chart
Goldman Sachs
Saved
The slide includes three line charts showing Canada y/y real GDP (2012-25F), Canada unemployment rate (2012-25F), and Canada y/y CPI (2012-25F). The charts display historical data and future projections with clear labels and demarcations for important time points.
Market Analysis and Trends
Financial Services
The slide forecasts a slowdown in the Canadian economy through mid-2024, highlighting constraints due to elevated debt servicing costs and cost fatigue. It analyzes trends in GDP, unemployment, and CPI, discussing their implications for economic activity.
Canadian economy, GDP, unemployment, CPI, forecast
Multiple Chart
EY
Saved
Two-column layout with bar and line charts showing real GDP growth in selected economies and the higher for longer inflation scenario.
Strategic Planning
Financial Services
Discusses the risks of delayed monetary easing and sticky inflation trends leading to potential recessionary conditions in advanced economies.
monetary easing, inflation trends, recession, advanced economies, central banks
Multiple Chart
EY
Saved
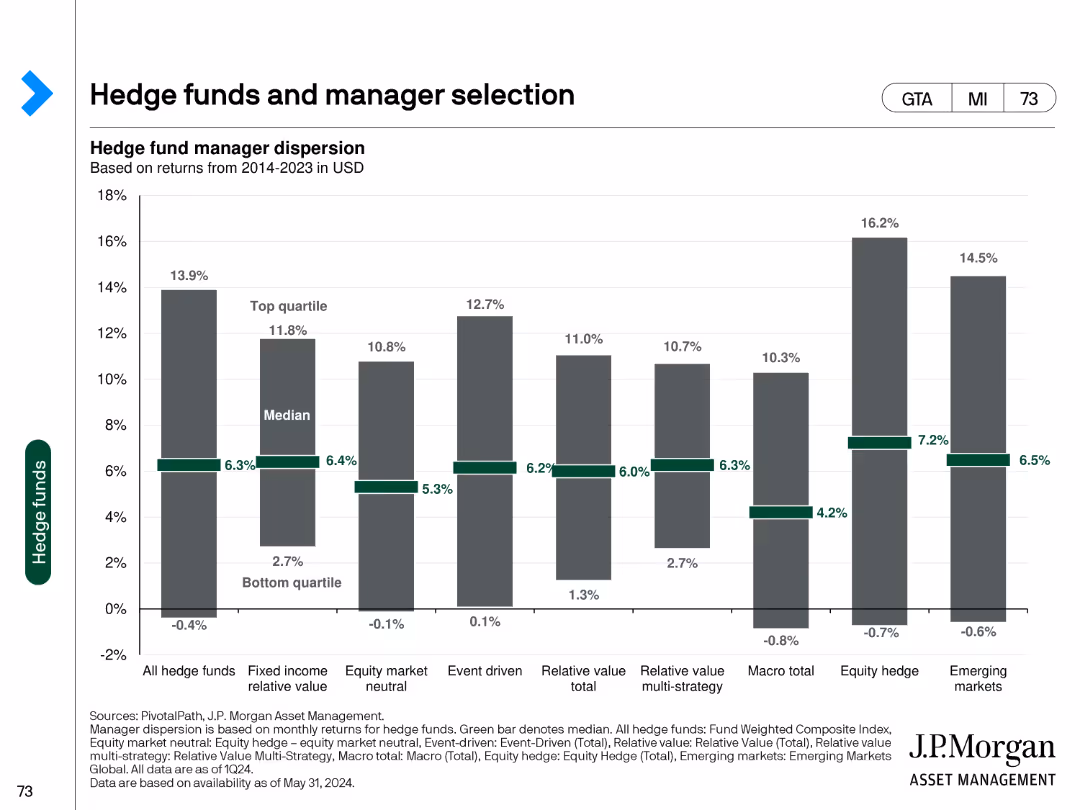
This slide features a column chart showing hedge fund manager dispersion based on returns from 2014-2023 in USD. It compares the performance of top quartile, median, and bottom quartile managers across different hedge fund strategies.
Investment Analysis
Financial Services
The slide examines hedge fund performance dispersion, providing a comparative analysis of returns across various hedge fund strategies over a multi-year period.
hedge funds, manager selection, returns, performance, dispersion
Single Chart
JP Morgan
Saved
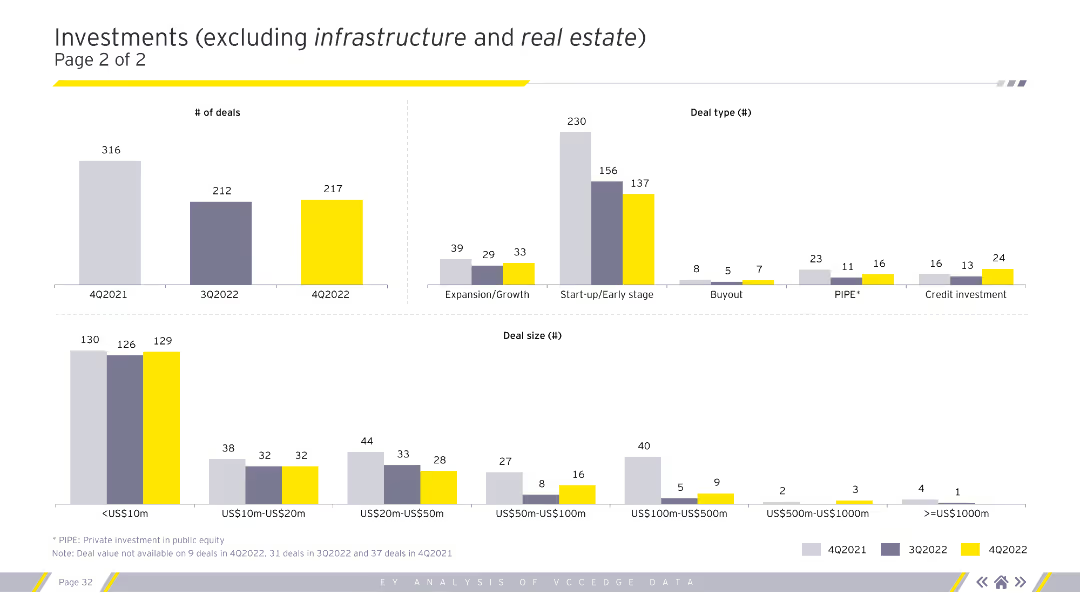
The slide includes column charts depicting the number of deals, deal types, and deal sizes for different quarters. Different colors represent distinct quarters, enhancing comparative analysis.
Market Analysis and Trends
Financial Services
This slide continues the analysis of investments excluding infrastructure and real estate, emphasizing the number of deals and their distribution across deal types and sizes.
Deal types, number of deals, deal sizes, investments
Multiple Chart
EY
Saved
Pie charts for loan segmentation, bar charts with credit comparison, textual content
Financial Performance
Financial Services
Overview of consumer loans, credit quality, and corporate lending in the U.S.
Loans, Credit, Corporate, Pie Chart, Bar Chart, Consumer, Financials
Multiple Chart
Citigroup
Saved
The slide features a table comparing consumer spending trends in goods and services across the US, UK, Germany, and France. Categories include groceries, motor vehicles, and fuel among others. Color-coded cells indicate changes.
Market Analysis and Trends
Consumer Goods
This slide shows consumer spending trends by goods and services in the US and Europe, emphasizing a shift towards services with notable rebounds in car sales. The table format helps compare changes across countries over the last six months and the latest monthly changes.
consumer spending, US, Europe, trends, goods, services
Multiple Chart
Accenture
Saved
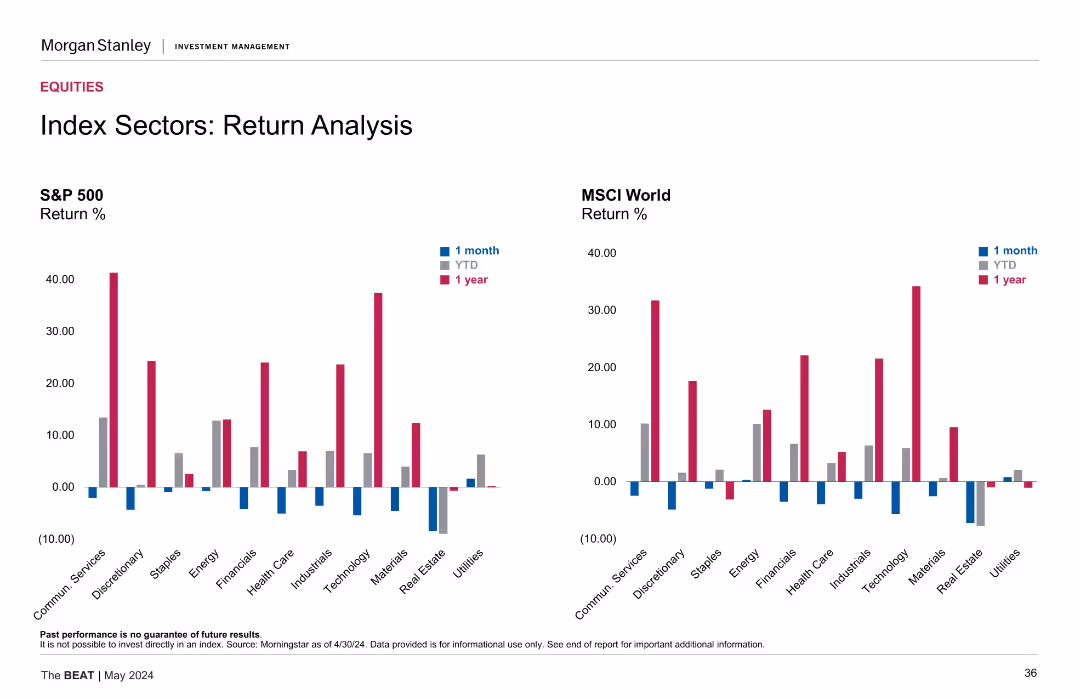
Two sets of bar charts comparing return percentages for the S&P 500 and MSCI World Index sectors over one month, YTD, and one year periods.
Financial Performance
Financial Services
The slide compares return analysis for sectors within the S&P 500 and MSCI World Index, showcasing performance over different time periods for comprehensive financial insights.
return, sectors, analysis, S&P 500, MSCI
Multiple Chart
Morgan Stanley
Saved
This slide features a central circular diagram with arrows and key components labeled around it. The diagram is flanked by two columns of textual content with highlighted subheaders.
Strategic Planning
Financial Services
A slide focused on the growth of a financial franchise supported by risk and resource management, illustrated by a central cycle diagram and flanking text explaining strategic elements.
franchise growth, risk management, resource management, strategy, Goldman Sachs, operational oversight, continuous improvement, culture, leverage, deposits
Linear Flow
Goldman Sachs
Saved
The slide features two column charts categorized by business line and account size, utilizing purple and yellow color schemes.
Technology and Digital Transformation
Financial Services
It assesses the utilization of automation and robotics across different business lines and account sizes for underwriting tasks.
automation, robotics, business lines, account size, chart
Mixed Chart
Accenture
Saved
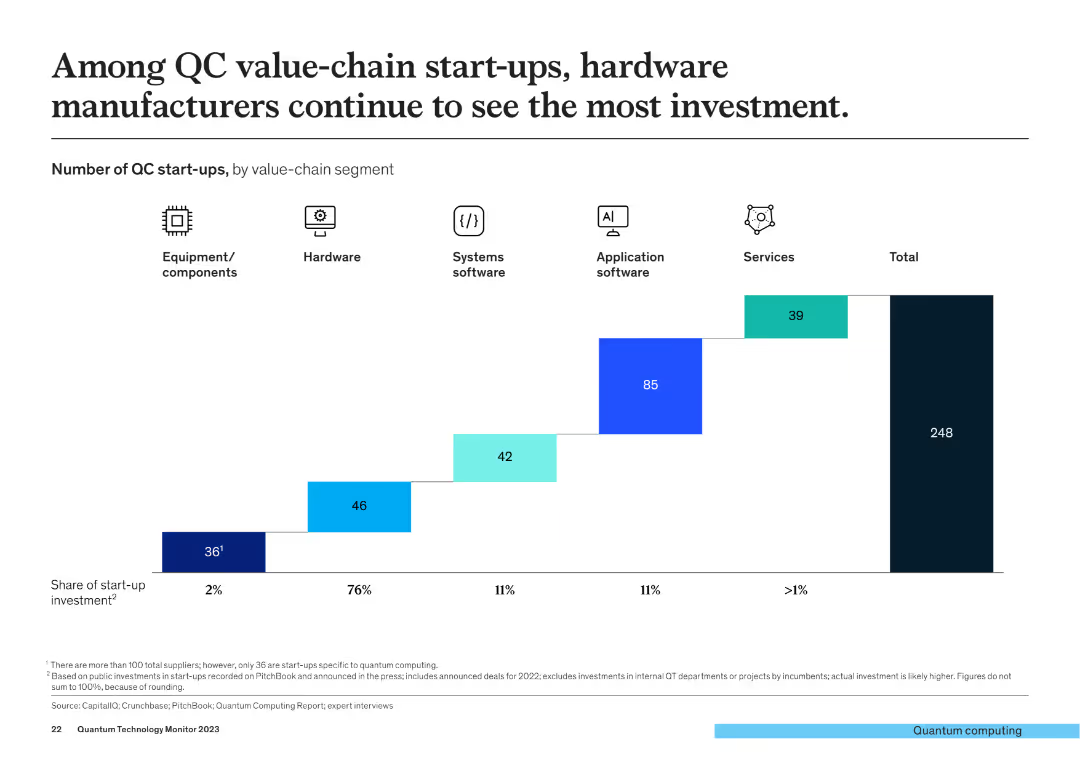
The slide features a bar chart showing the number of QC start-ups by value-chain segment (Equipment, Hardware, Systems software, Application software, Services) with the share of start-up investment indicated.
Investment Analysis
Financial Services
This slide highlights that hardware manufacturers among QC value-chain start-ups receive the most investment, with detailed segmentation of investment shares across different value-chain segments.
hardware, QC start-ups, value-chain, investment, segment analysis
Single Chart
McKinsey
Saved
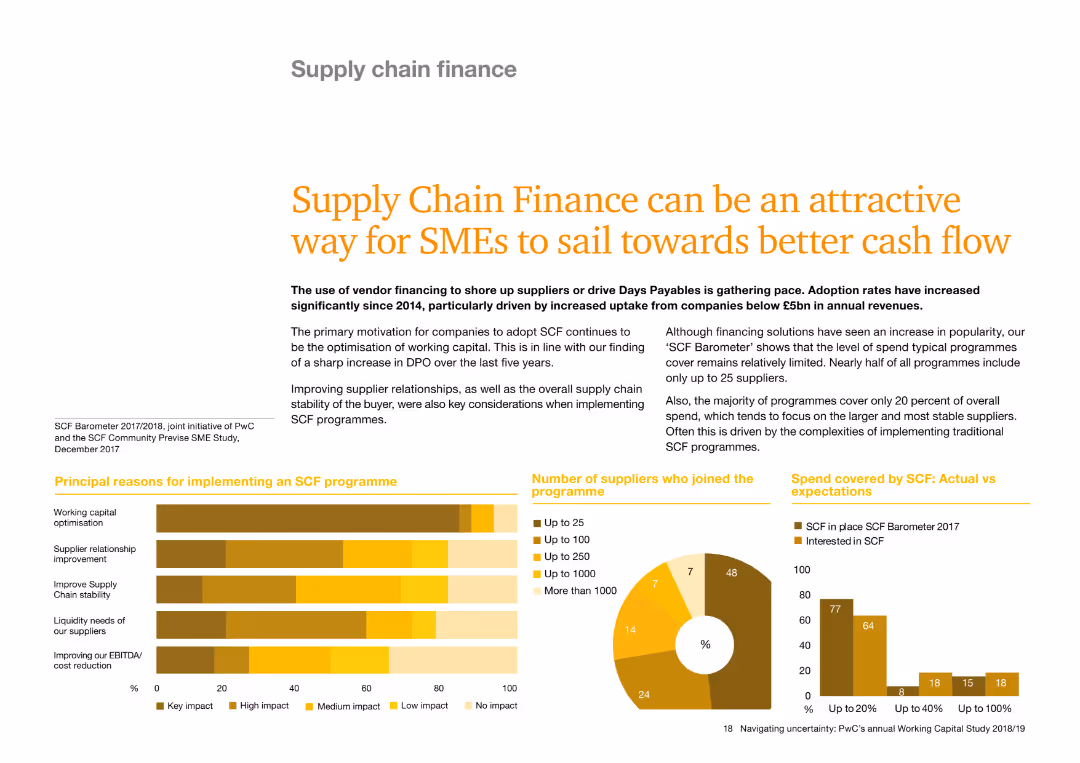
The slide includes a main title, several paragraphs of text, and a bar chart showing the principal reasons for implementing an SCF program. A pie chart illustrates the number of suppliers involved in the program. A three-color scheme of yellow, orange, and brown is used consistently throughout the slide.
Operational Efficiency
Financial Services
This slide discusses the benefits of supply chain finance (SCF) for SMEs, highlighting improved cash flow and supplier relationships. It also presents data on the number of suppliers participating in SCF programs and the impact on working capital. The bar and pie charts provide a clear visual representation of the data.
Supply chain finance, SMEs, cash flow, supplier relationships, SCF program, bar chart, pie chart
Multiple Chart
PwC/Strategy&
Saved
The slide is divided into two sections: text on the left and a bar chart on the right. The chart compares the percentage of millennials and Gen Zs valuing certain employee characteristics, with separate bars for each group. The slide has a white background with green accent bars.
Industry Overview
Technology & Software
The slide discusses the importance of flexibility and adaptability in the workplace, especially for millennials and Gen Z. It presents findings from the Deloitte Global Resilience Report, showing that these groups value flexibility/adaptability, creativity, and being technologically savvy the most in the success of businesses. A column chart visualizes these values, differentiating the perceptions between millennials and Gen Z.
Flexibility, Adaptability, Millennials, Gen Z, Deloitte, Resilience Report, Employee Characteristics, Business Success, Column Chart
Mixed Chart
Deloitte
Saved
Previous
Next
If nothing, comes up, please save your slides first
Create a FREE account to continue browsing
Receive Instant Access to 1,000+ slides from companies like McKinsey, Google, and Goldman Sachs
First Name
Last Name
Email
Password
I agree to all
Terms & Privacy Policy
Thank you! Your submission has been received!
Oops! Something went wrong while submitting the form.
Have an account?
Sign in
Column Chart
Heatmap
Chevron
Org Chart
Infographic
Callouts
Timeline
List
Graphic
Picture
Process Flow
Diagram
Paragraph
Map
Table
Framework
Subtitle
Takeaway Box
Icon
Other Chart
Radar Chart
Waterfall Chart
Mekko Chart
Pie Chart
Scatter Plot
Line Chart
Bar chart
Bullet points