My Account
My Slides
Search by Category
Templates
Leave Feedback
Login
Logout
Get Started
Browse all Slides
Browse all Slides
Create a FREE Account
Instant access to 1,000+ real slides from top companies like McKinsey, BCG, Goldman Sachs, Google and many more!
First Name
Last Name
Email
Password
I agree to all
Terms & Privacy Policy
Thank you! Your submission has been received!
Oops! Something went wrong while submitting the form.
Have an account?
Sign in
Saved Slides
Features bullet points, bold headers, and a large pie chart illustrating market growth by 2030. Graphical elements are well-spaced and the slide is easy to read.
Market Analysis and Trends
Transportation & Logistics
Explores the growth potential in sustainable mobility due to regulatory changes and market electrification, stressing on the expected market evolution and Faurecia's strategic positioning to leverage these opportunities.
sustainability, mobility, market growth, electrification, regulations, 2030
Boxed
Deutsche Bank
Saved
This slide is dominated by a large, purple column chart that breaks down total spending into categories such as engineering, support, and infrastructure. Text boxes provide context and outline opportunities for development excellence and technology modernization.
Financial Performance
Financial Services
Explores financial strategies aimed at leveraging technology and development practices to enhance productivity and manage expense growth.
Financial Performance, Technology Modernization, Strategic Planning, Financial Services, Productivity, Cost Efficiency
Mixed Chart
JP Morgan
Saved
This slide displays three column charts illustrating the difference in perceptions between leaders and employees regarding inclusion, training opportunities, and reporting sensitive issues.
Market Analysis and Trends
Professional Services
It discusses how a significant portion of employees feel excluded from their organizations and compares these figures to leaders' beliefs, indicating a notable perception gap.
inclusion, training, reporting, perceptions, gap
Multiple Chart
Accenture
Saved
The slide contains four doughnut charts illustrating attitudes towards ESG risks and opportunities among investors. Accompanied by bullet points, each chart is encircled by a yellow ring indicating percentage agreement. The slide's background is white with minimal design elements to emphasize the data.
Market Analysis and Trends
Financial Services
This slide evaluates the economic impacts and challenges related to ESG (Environmental, Social, and Governance) factors in investment decisions. It highlights that a significant percentage of investors consider ESG risks important and expect companies to integrate ESG targets into executive pay, despite potential impacts on short-term profitability.
ESG, Investors, Risks, Opportunities, Executive Pay, Profitability, Doughnut Chart
Multiple Chart
PwC/Strategy&
Saved
The slide presents two column charts, one showing the percentage of cov-lite loans and the other showing incurrence debt percentages.
Risk Assessment and Management
Financial Services
The slide addresses risks associated with covenant-lite loans and compares them with traditional loans, highlighting concerns and mitigants.
covenant-lite loans, risks, Credit Suisse, incurrence debt, traditional loans, mitigants, comparisons, credit quality
Multiple Chart
Credit Suisse
Saved
Describes the expected impact of ML industrialization across various sectors, with representative icons for each.
Technology and Digital Transformation
Technology & Software
Explores the potential impact of ML industrialization across a variety of industries and how it could offer competitive advantages.
ML, industries, impact, tech trend, competitive advantage
Header Vertical
McKinsey
Saved
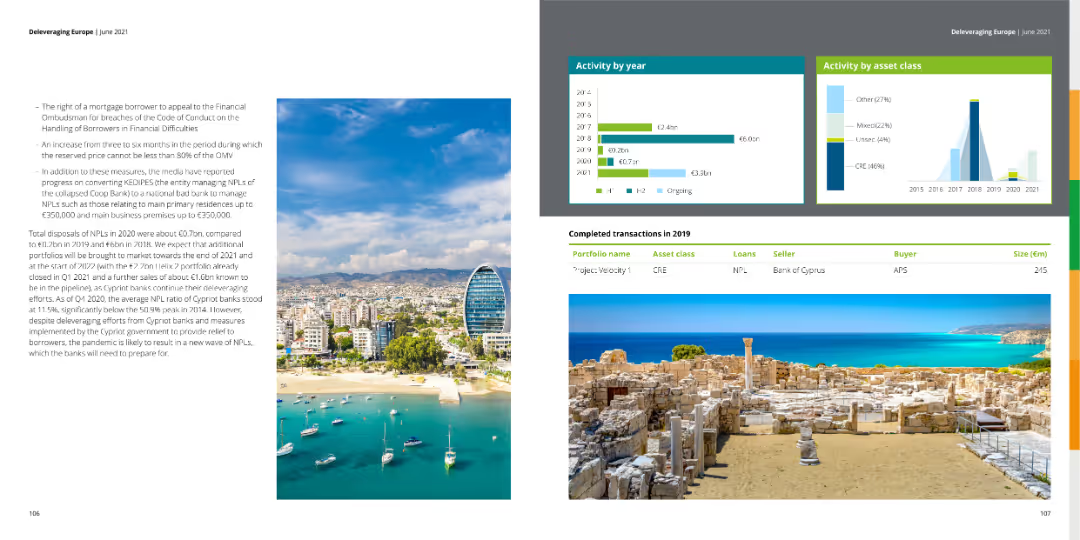
The slide presents tables of completed transactions for 2019, along with bar charts showing activity by year and asset class. The left side contains a dense text block discussing NPL volumes and bank actions.
Market Analysis and Trends
Financial Services
The slide offers a detailed overview of financial activities by year and asset class, including completed transactions in 2019, with insights into trends and strategic bank actions.
activity, transactions, asset class, trends, NPL
Multiple Chart
Deloitte
Saved
Bar charts showing the breakdown of invested assets by class and currency for Global Wealth Management and Asset Management.
Financial Performance
Financial Services
Analyzes the distribution of invested assets across different classes and currencies, comparing Global Wealth Management and Asset Management.
Invested assets, asset class, currency, UBS, Global Wealth Management, Asset Management, financial performance, 3Q22
Multiple Chart
UBS
Saved
Column chart represents CFO sentiments about the business outlook over the next 12 months, using shades of green to indicate varying levels of optimism and pessimism. The 'somewhat optimistic' category shows the highest count.
Investment Analysis
Financial Services
Reflects the mixed sentiments of CFOs regarding the future business climate, with a lean towards a somewhat optimistic outlook. This sentiment analysis can aid in understanding the confidence levels of business leaders in financial planning and strategy adjustments amidst ongoing economic uncertainties.
business outlook, CFO, sentiment analysis, financial planning, optimism
Single Chart
Deloitte
Saved
Featuring a vertical bar graph, this slide depicts the timeline of COVID-19's impact on the US economy. Accompanying text boxes provide additional insights into investors' perspectives.
Market Analysis and Trends
Financial Services
Presents investors' beliefs on the diminishing economic impact of COVID-19, relevant for assessing market risks and investment approaches.
COVID-19 Impact, Economic Analysis, Investor Beliefs, Risk Assessment, Market Sentiment, Investment Decisions, Economic Recovery, Pandemic Effects, Health Crisis, Investment Strategies
Single Chart
BCG
Saved
The slide features a line chart showing short-term rental market revenues in Greece from 2019 to 2021 and a column chart showing June-September demand pacing by country in 2022 vs 2021. There are accompanying text explanations and data insights.
Market Analysis and Trends
Hospitality & Tourism
Shows the strong performance of the Greek short-term rental market in 2022, including a revenue rebound in 2021 and demand pacing by country for the June-September period. It discusses occupancy rates and trends across various Greek destinations.
Short-term rental, Greece, Revenue, Demand, Trends
Multiple Chart
EY
Saved
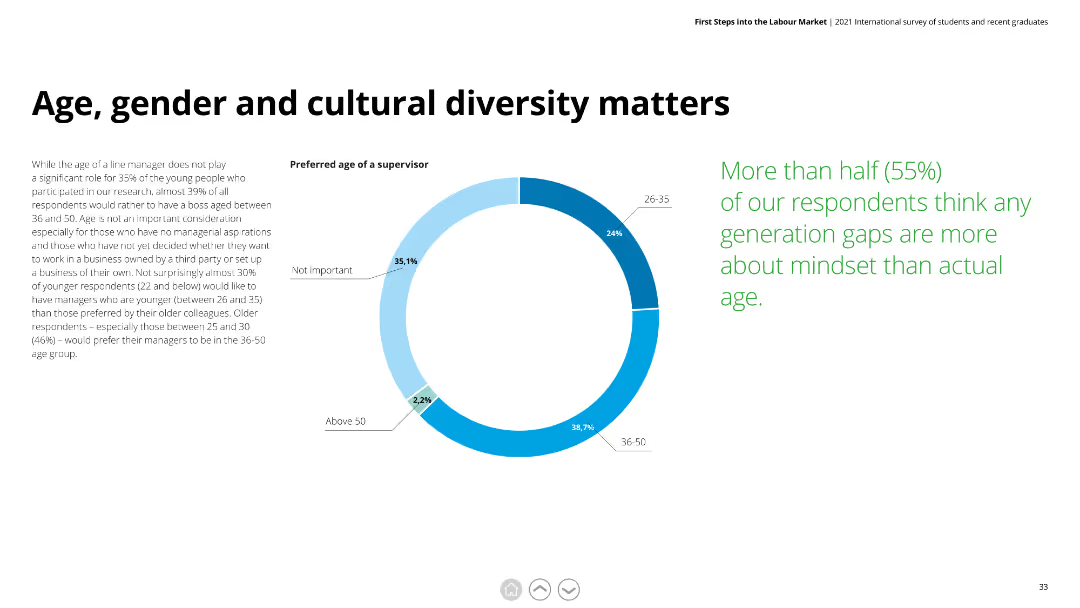
Donut chart showing preferred age of supervisors and detailed text on the importance of age, gender, and cultural diversity in the workplace.
Human Resources and Talent Management
Education & Training
This slide explores preferences for the age of supervisors among young professionals and discusses the significance of mindset over age in workplace diversity.
diversity, age preference, gender, cultural diversity, workplace mindset
Mixed Chart
Deloitte
Saved
The slide features a timeline comparing the carbon neutrality commitments and reduction targets of leading global steel companies, with milestones from 2020 to 2050.
Regulatory and Compliance
Environmental Services & Sustainability
This slide highlights the net-zero commitments of major global steel players, detailing their reduction targets and timelines for achieving carbon neutrality by 2050.
Net Zero, steel players, carbon neutrality, commitments, timelines, reduction targets, global, environmental
Single Chart
BCG
Saved
Slide presents a bar chart comparing investment priorities between larger and smaller companies with emphasis on advanced technology.
Technology and Digital Transformation
Professional Services
Discusses how larger companies prioritize AI and technology investments more compared to smaller companies which focus on diverse operational aspects.
technology, AI, investments, productivity, companies
Single Chart
Deloitte
Saved
The slide features a timeline highlighting key milestones in the development of biomass processing technologies from the late 18th century to the 20th century. Key events are marked along the timeline with brief descriptions.
Technology and Digital Transformation
Energy & Utilities
This slide provides a historical overview of the development of biomass processing technologies, highlighting significant discoveries and commercial developments over time.
biomass processing, history, timeline, technology development, discoveries, commercial development, milestones
Linear Flow
Kearney
Saved
A dark background with column charts showing future technology trends in healthcare, with white and yellow text.
Technology and Digital Transformation
Healthcare & Pharmaceuticals
It predicts future trends such as digital health monitoring, hospital-at-home models, and virtual hospitals.
future technology, healthcare, digital trends, survey, England
Mixed Chart
EY
Saved
The slide uses pie charts and diagram to show how nbn has impacted employment and income outcomes, with specific metrics and examples.
Market Analysis and Trends
Telecommunications
This slide evaluates the impact of nbn on employment and income, detailing the benefits and statistics associated with increased connectivity.
nbn, employment, income, internet impact, connectivity, statistics
Multiple Chart
Accenture
Saved
Contains two gauge charts comparing views between HR Managers and CEOs/GMs. Each chart uses a gradient color scheme to show agreement levels, focusing on managerial perspectives.
Human Resources and Talent Management
Professional Services
Compares HR Managers and CEOs/GMs opinions on certain company policies, useful for understanding different internal viewpoints and fostering discussion on alignment and policy adjustments.
HR, CEO, perspectives, gauge chart
Multiple Chart
PwC/Strategy&
Saved
Light background with yellow title banner, text-heavy content, and a bubble chart comparing 2023 IPO markets with the 5-year average.
Market Analysis and Trends
Financial Services
This slide examines the rise of new IPO markets like Indonesia, Malaysia, and Turkey, while traditional markets like Hong Kong face challenges. It includes a bubble chart visualizing IPO market performance relative to the 5-year average.
IPO markets, high-growth, traditional markets, performance, 2023
Mixed Chart
EY
Saved
A minimalist slide with an agenda list on the left and a vibrant image of shipping containers on the right, suggesting a theme related to logistics or global business.
Strategic Planning
Professional Services
Serves to outline the topics of discussion in a business or strategy meeting, with a visual nod to global operations and logistics.
Agenda, Logistics, Global Business, Meeting, Strategy
Agenda
Morgan Stanley
Saved
The slide features two charts: a scatter plot of realized total return vs. realized volatility, and a bar chart showing risk-adjusted returns by stock allocation.
Investment Analysis
Financial Services
The slide demonstrates the benefits of diversification in reducing volatility and enhancing risk-adjusted returns over different stock allocations.
diversification, risk-adjusted returns, volatility, investment strategy, stock allocation
Multiple Chart
UBS
Saved
This slide includes two main visual elements: a column chart detailing the share of total exports to Ukraine, Russia, and Belarus from 2015-2021, and a column chart depicting trade in goods from January to April in billion ISK at constant exchange rates from 2018-2022. Both charts use distinct colors to represent different commodities and metrics.
Market Analysis and Trends
Financial Services
Analyzes the direct effects of the Ukraine conflict on Iceland's exports, particularly focusing on commodities like seafood and aluminum. It indicates minimal impact on the overall trade, supported by high production prices, and provides a yearly and monthly breakdown of trade volumes and values in the context of geopolitical tensions.
Ukraine, exports, trade, seafood, aluminum, geopolitical impact
Multiple Chart
Deutsche Bank
Saved
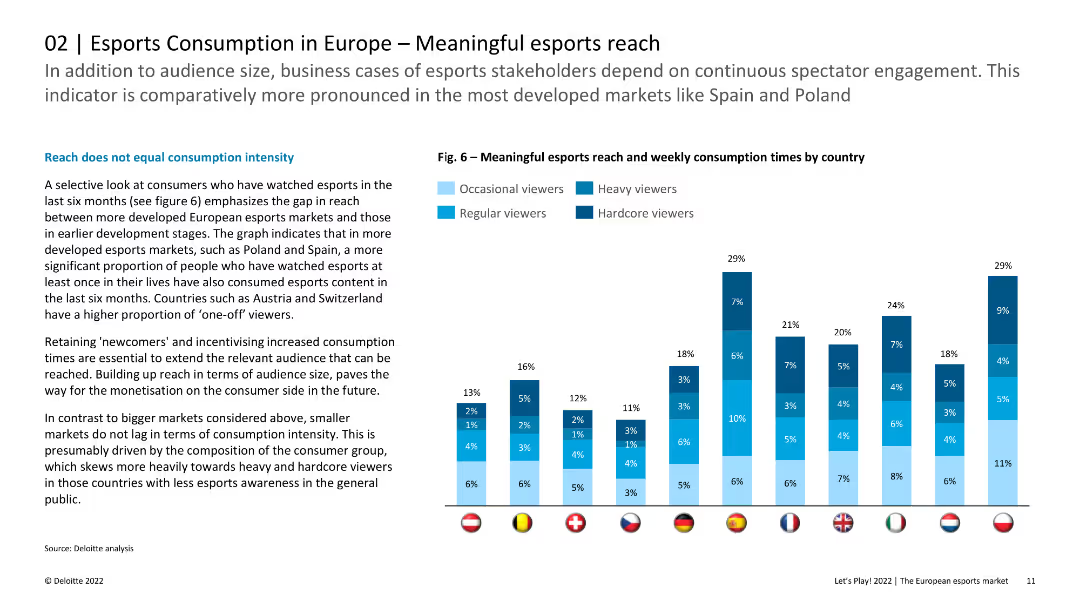
The slide includes a column chart illustrating meaningful esports reach and weekly consumption times by country. The layout is informative with clear data presentation.
Market Analysis and Trends
Media & Entertainment
The slide analyzes the reach of esports content in Europe, emphasizing that larger markets show higher consumption intensity. It highlights the importance of retaining new viewers and incentivizing increased consumption times for monetization.
Esports, Reach, Consumption, Europe, Audience
Mixed Chart
Deloitte
Saved
Flowchart design, icons, circular flow, green accents
Operational Efficiency
Technology & Software
Details the components of CAI and its user interactions
CAI, persona, self service, channels
Linear Flow
Deloitte
Saved
The slide includes two donut charts comparing 2023 and 2022 responses on investment knowledge, with key percentages highlighted.
Market Analysis and Trends
Financial Services
It displays the percentage of Canadians who correctly answered a question about stocks vs. mutual funds, comparing 2022 to 2023.
Stocks, Mutual Funds, Knowledge, Canadians, Percentage, 2023, 2022, Chart, Financial, Trends
Multiple Chart
IPSOS
Saved
Previous
Next
If nothing, comes up, please save your slides first
Create a FREE account to continue browsing
Receive Instant Access to 1,000+ slides from companies like McKinsey, Google, and Goldman Sachs
First Name
Last Name
Email
Password
I agree to all
Terms & Privacy Policy
Thank you! Your submission has been received!
Oops! Something went wrong while submitting the form.
Have an account?
Sign in
Column Chart
Heatmap
Chevron
Org Chart
Infographic
Callouts
Timeline
List
Graphic
Picture
Process Flow
Diagram
Paragraph
Map
Table
Framework
Subtitle
Takeaway Box
Icon
Other Chart
Radar Chart
Waterfall Chart
Mekko Chart
Pie Chart
Scatter Plot
Line Chart
Bar chart
Bullet points