My Account
My Slides
Search by Category
Templates
Leave Feedback
Login
Logout
Get Started
Browse all Slides
Browse all Slides
Create a FREE Account
Instant access to 1,000+ real slides from top companies like McKinsey, BCG, Goldman Sachs, Google and many more!
First Name
Last Name
Email
Password
I agree to all
Terms & Privacy Policy
Thank you! Your submission has been received!
Oops! Something went wrong while submitting the form.
Have an account?
Sign in
Saved Slides
This slide features comparative bar charts and a pie chart. There are two sections: one compares the online spend of HVUs vs. non-HVUs across various verticals, and the other shows the demographic and geographic composition of HVUs. Additionally, there are two column charts depicting changes in spend percentage.
Market Analysis and Trends
Technology & Software
The slide presents data on high-value users' (HVUs) online spending habits in Thailand compared to non-HVUs, indicating that HVUs spend significantly more. Demographic and geographic distributions of HVUs are detailed. Changes in spend over the past 12 months and intentions to increase spend are quantified through column charts, highlighting the growing trend in digital consumer behavior.
HVU, Thailand, Spending Habits, Demographics, E-commerce, Transport, Gaming, Growth, Consumer Behavior, Digital Economy
Multiple Chart
Bain
Saved
Pie chart split into three segments showing the distribution of net sales across personal care, consumer tissue, and professional hygiene. Accompanied by thematic imagery related to consumer products.
Market Analysis and Trends
Consumer Goods
Highlights distribution of Essity's net sales by category for the first half of 2017, useful for market segmentation and analysis in consumer goods.
Sales Distribution, Market Segmentation, Personal Care, Consumer Tissue, Professional Hygiene
Single Chart
Barclays
Saved
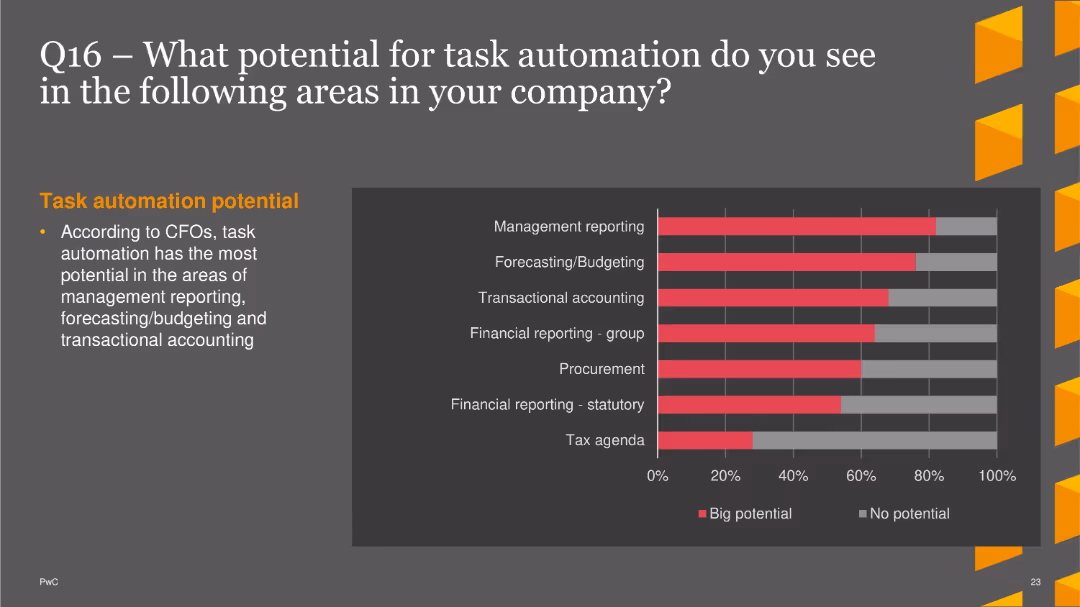
The slide displays a column chart indicating the potential for task automation in various company areas. Areas include management reporting, forecasting/budgeting, transactional accounting, financial reporting (group and statutory), procurement, and tax agenda. The potential is categorized as big potential (red) and no potential (gray). A short text section on the left side explains task automation potential according to CFOs.
Operational Efficiency
Financial Services
This slide shows survey data on the perceived potential for task automation in different company functions, with management reporting and forecasting/budgeting identified as areas with the highest potential. It provides insights for companies looking to enhance operational efficiency through automation.
task automation, management reporting, forecasting, transactional accounting, finance
Single Chart
PwC/Strategy&
Saved
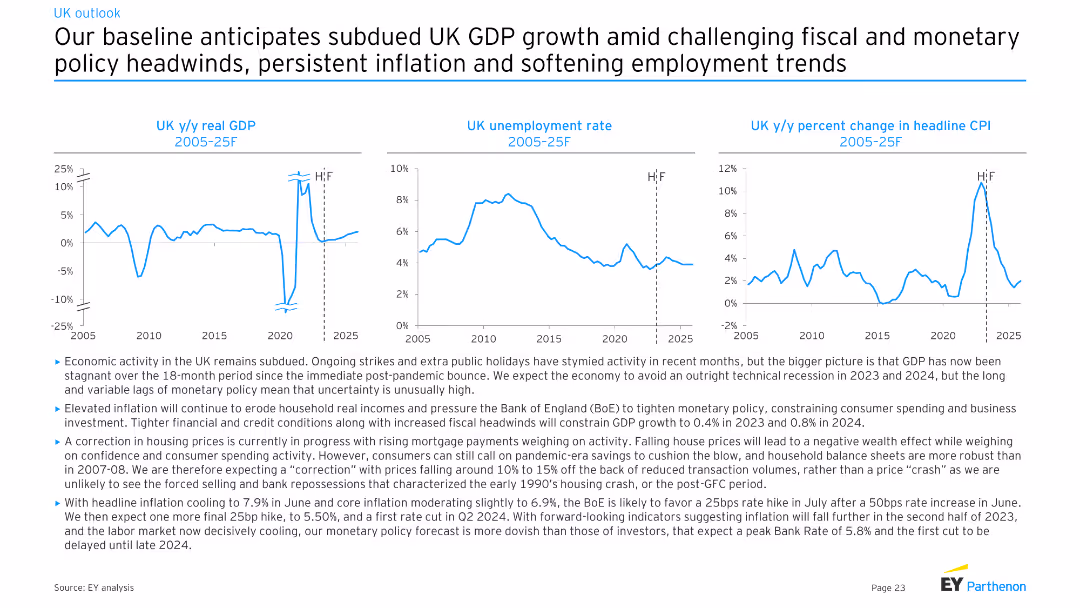
Three line charts depicting UK y/y real GDP, UK unemployment rate, and UK y/y percent change in headline CPI from 2005-25F. Moderate complexity with clear visual representations for economic trends analysis.
Market Analysis and Trends
Financial Services
The slide provides an economic forecast for the UK, projecting subdued GDP growth, persistent inflation, and softening employment trends. It discusses the effects of fiscal and monetary policies, as well as ongoing strikes and public holidays on economic activity.
UK, GDP, unemployment, CPI, forecast
Multiple Chart
EY
Saved
The slide features two line charts showing average spread and annual default rate for high yield corporate, loans, and investment-grade corporate bonds.
Market Analysis and Trends
Financial Services
The slide provides a market update on corporate bonds, detailing spread trends and default rates. Useful for bond market analysis.
corporate bonds, spread, default rate, market update, financial analysis
Multiple Chart
Morgan Stanley
Saved
Slide offers a pie chart and demographic details of a survey, including age, gender, and location distribution of respondents.
Industry Overview
Government & Public Sector
Provides an overview of the survey demographics and methodology used in the National Community Hubs Program evaluation in Belgium.
Survey, demographics, methodology, NCHP, Belgium
Multiple Chart
Deloitte
Saved
The slide features a detailed table listing the most active stock exchanges by number of IPOs and proceeds for 2021 and 2022 YTD.
Financial Performance
Financial Services
The slide shows the rankings of stock exchanges globally by number of IPOs and proceeds, illustrating the market activity across different exchanges.
stock exchanges, IPOs, market activity, rankings, global
Table
EY
Saved
A line chart shows the CAC versus CO2 emissions from electricity generation by 2030 for various countries, comparing costs for grid, grid + wind, grid + solar, and blue hydrogen CAC setups.
Market Analysis and Trends
Energy & Utilities
The slide evaluates the cost-effectiveness of hydrogen from grid-powered electrolyzers for reducing emissions, noting the carbon footprint threshold for competitive cost.
CO2 emissions, CAC, grid, wind, solar, hydrogen, electrolyzer, cost-effectiveness
Mixed Chart
Kearney
Saved
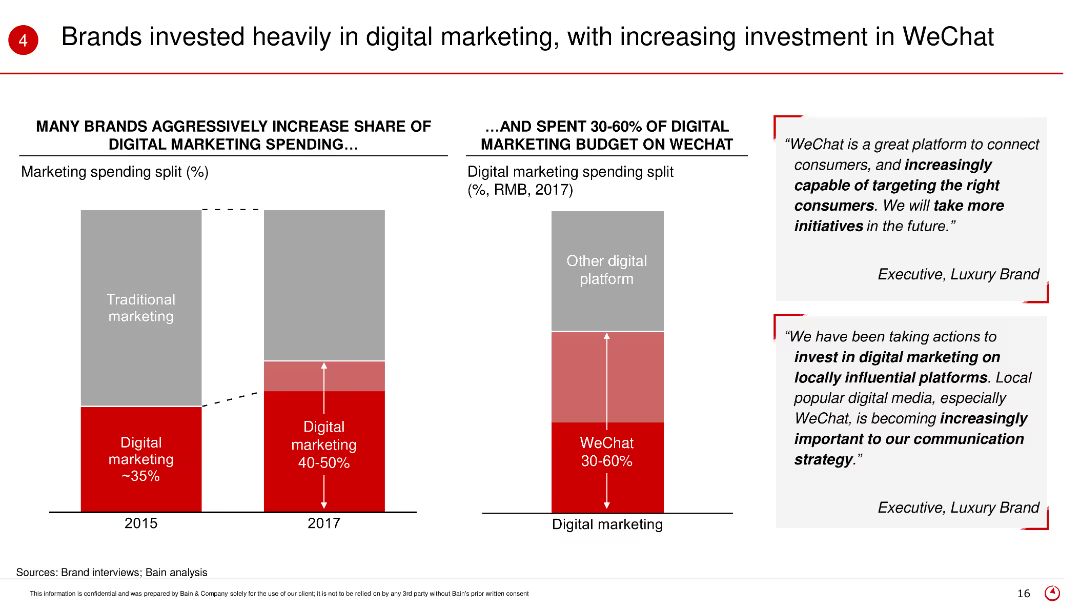
The slide shows bar charts comparing traditional and digital marketing spending in 2015 and 2017, and the proportion of digital marketing budget spent on WeChat. Text boxes include quotes from executives.
Market Analysis and Trends
Retail & E-commerce
This slide highlights the shift in marketing strategies among brands towards digital marketing, particularly emphasizing the significant investment in WeChat as a key platform for engagement.
Digital marketing, WeChat, marketing investment, traditional marketing, brand strategies
Multiple Chart
Bain
Saved
The slide features a complex, data-driven layout with multiple column charts comparing the 2020 and 2027 market sizes of different xEV segments (HEV, PHEV, BEV). It also includes text boxes with key insights, and a map representation of segment growth. Colors are used to differentiate segments.
Market Analysis and Trends
Transportation & Logistics
This slide analyzes the electric vehicle market, highlighting the growth projections for different sub-segments like HEV, PHEV, and BEV by 2027. It emphasizes BEVs as having the highest potential growth, supported by changes in regulations and advancements in technology.
xEV, market growth, HEV, PHEV, BEV, 2027 projections, environmental regulations, technology advancement
Mixed Chart
PwC/Strategy&
Saved
The slide is divided into textual content and infographic elements with percentage figures and pictograms related to agility and talent. Green and grey color highlights are used for emphasis.
Organizational Structure and Change
Professional Services
Discusses the Adaptable Organization (AO) as a shift in management philosophy to increase agility through empowered networks of teams. It points out the current state of digital disruption, organizational agility, leadership, and the need for new talent within professional services.
Adaptable Organization, management, agility, talent, disruption, teams
Linear Flow
Deloitte
Saved
The slide contains two column charts. The left chart shows the contribution to UK real GDP growth by different sectors. The right chart displays UK Purchasing Managers' Indices (PMI) over time. The charts are detailed and use various colors to distinguish data categories.
Market Analysis and Trends
Financial Services
The slide analyzes the UK's GDP growth and business activity through sector contributions and PMI trends, essential for economic analysis and business strategy.
UK GDP, business surveys, PMI, sector growth, economic analysis
Multiple Chart
JP Morgan
Saved
Combination of text, percentage circles, and visual comparisons highlighting differences in optimism about company culture between employees and employers post-pandemic.
Human Resources and Talent Management
Professional Services
This slide examines the impact of the pandemic on company culture, showing increased employee optimism versus declining employer optimism, and significant staff turnover.
Company culture, pandemic impact, employee optimism, employer pessimism, staff turnover
Multiple Chart
EY
Saved
Column chart displaying asset and liability composition. Layout is clean, with each chart and graph clearly labeled.
Financial Performance
Financial Services
Overview of company's assets and liabilities at the end of the year, useful for financial analysis and understanding company structure.
assets, liabilities, financial stability, balance sheet, equity
Multiple Chart
Deutsche Bank
Saved
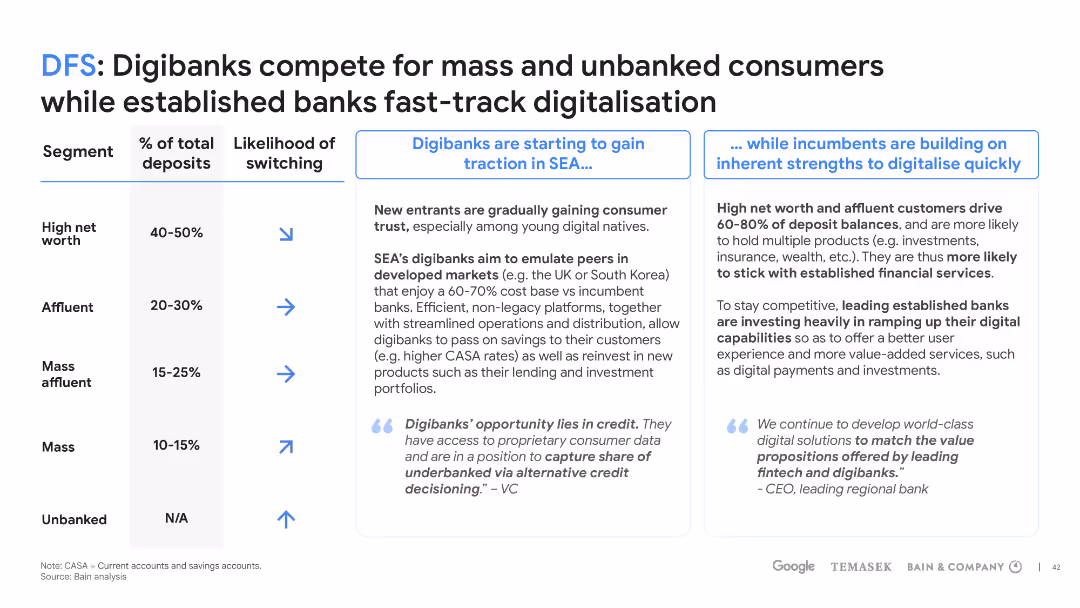
The slide includes a table with segments of net worth categories, percentages of deposits, likelihood of switching to digibanks, and two comparative analyses focusing on the traction of digibanks in SEA and established banks' digitalisation efforts. Symbols and color codes indicate trends or states for each segment.
Market Analysis and Trends
Financial Services
The slide compares the market strategies of digibanks and established banks, detailing the deposit percentages across different wealth segments, their propensity to switch to digital banking, and the differing approaches to capturing the mass and unbanked consumer markets.
digibanks, established banks, digitalisation, market strategy, consumer banking, SEA
Table
Bain
Saved
Slide features column charts comparing electric vehicle (EV) sales over years in various vehicle categories, highlighting trends in a visually straightforward manner.
Market Analysis and Trends
Transportation & Logistics
Discusses the sales trends of electric vehicles in India, with an emphasis on market dynamics, consumer preferences, and infrastructure developments affecting EV adoption.
EV sales, India, market trends, consumer preferences, infrastructure development, electric vehicles
Multiple Chart
PwC/Strategy&
Saved
Pie chart and accompanying text estimating the duration of COVID-19's impact on personal finances. Different time frames are shown as segments of the pie chart.
Market Analysis and Trends
Financial Services
This slide shows Canadian investors' perceptions of how long COVID-19 will affect their personal finances. It includes predictions ranging from a few months to more than 18 months, highlighting uncertainties and differences based on demographics.
COVID-19, Personal Finances, Canadian, Duration, Impact
Mixed Chart
IPSOS
Saved
The slide features a combination of column charts showing top concerns for Gen Zs and Millennials, with text explanations on the left. It uses a clear layout to present statistical data on societal concerns.
Risk Assessment and Management
Financial Services
This slide discusses the primary societal concerns for Gen Zs and Millennials, highlighting the top worries including cost of living, unemployment, and climate change, with statistical comparisons between the two groups.
Societal concerns, cost of living, unemployment, climate change
Multiple Chart
Deloitte
Saved
Presents a column chart tracking investor priorities for financially healthy companies over time, shown in a green gradient, highlighting shifts in investor focus during the COVID-19 pandemic.
Investment Analysis
Financial Services
Details the changing investment priorities among investors, particularly the balance between long-term growth and short-term performance expectations in response to global economic shifts.
investment priorities, COVID-19, long-term growth, short-term performance
Multiple Chart
BCG
Saved
This slide features a pie chart showing the impact of regulations on short-term rental decisions. Segments include no longer purchase (teal), have tenants rent (light blue), and no impact (dark blue).
Regulatory and Compliance
Real Estate & Construction
The slide analyzes survey data on the impact of short-term rental regulations, indicating how regulatory changes affect investment property purchasing decisions.
short-term rentals, regulations, survey, rental decisions, investment property
Single Chart
IPSOS
Saved
This slide features multiple column charts comparing the Total Incident Frequency (TIF) and Total Recordable Incident Frequency (TRIF) of Seadrill against industry benchmarks over several years. The graphs are color-coded to differentiate between TIF, TRIF, and a benchmark, providing a clear visual distinction. The design is clean, with minimal text to allow focus on the trends shown by the graphs. Annotations highlight significant data points and trends.
Operational Efficiency
Energy & Utilities
The slide demonstrates Seadrill's commitment to safety and efficiency, showing a downward trend in incident rates compared to industry standards. It is likely used in safety briefings, regulatory reviews, or investor meetings to underscore Seadrill's strong safety record and operational excellence. The line graphs serve to reassure stakeholders of the company’s adherence to high safety standards and its effectiveness in minimizing operational risks, which is crucial for maintaining trust and fulfilling regulatory requirements.
safety, operational efficiency, Seadrill, line graphs, incident rates, industry benchmarks, safety standards, regulatory compliance, stakeholder reassurance, trust
Multiple Chart
Barclays
Saved
The slide contains a line chart tracking e-commerce as a percentage of core retail sales with estimates and a line graph of warehouse construction spending.
Market Analysis and Trends
Retail & E-commerce
It analyzes the impact of e-commerce on retail sales and correlates it with warehouse construction spending, emphasizing its ongoing influence on the economy.
e-commerce, retail sales, warehouse construction, economy
Multiple Chart
Citigroup
Saved
The slide features column charts depicting additional operational resilience requirements expected from regulators in the next two years. The layout is clear with well-labeled charts.
Regulatory and Compliance
Financial Services
It presents data on expected additional requirements from regulators, including higher standards for cybersecurity, data protection, and monitoring critical third-party service providers.
operational resilience, regulators, column charts
Multiple Chart
EY
Saved
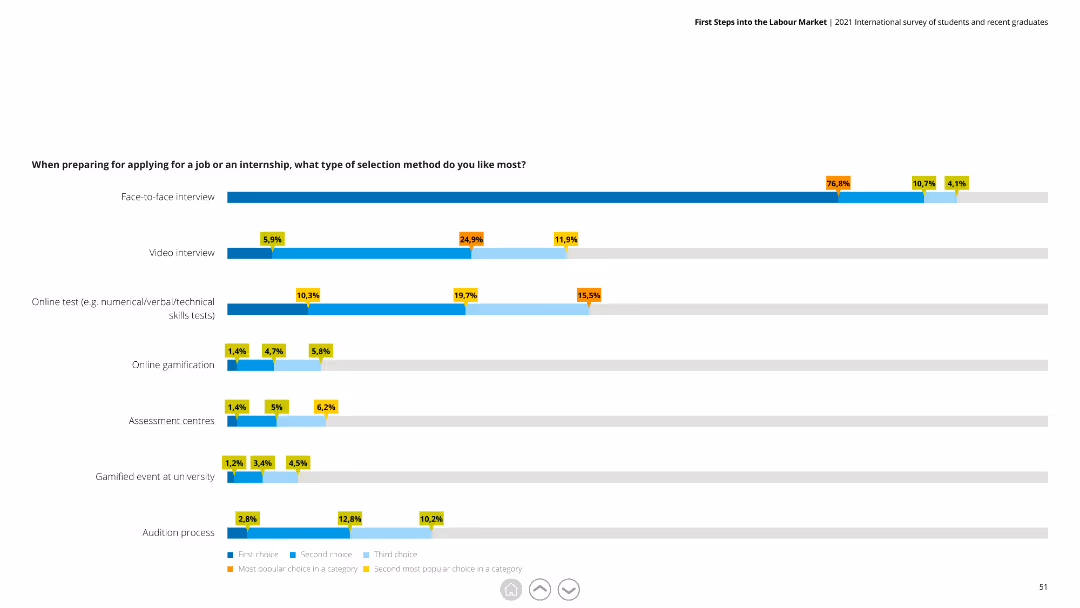
This slide features a horizontal bar chart with data on preferred job application selection methods, including face-to-face interviews and online tests.
Market Analysis and Trends
Professional Services
The slide details preferences for different job selection methods, showing face-to-face interviews as the most favored. It helps in understanding recruitment preferences.
Job applications, selection methods, survey, interviews, recruitment
Single Chart
Deloitte
Saved
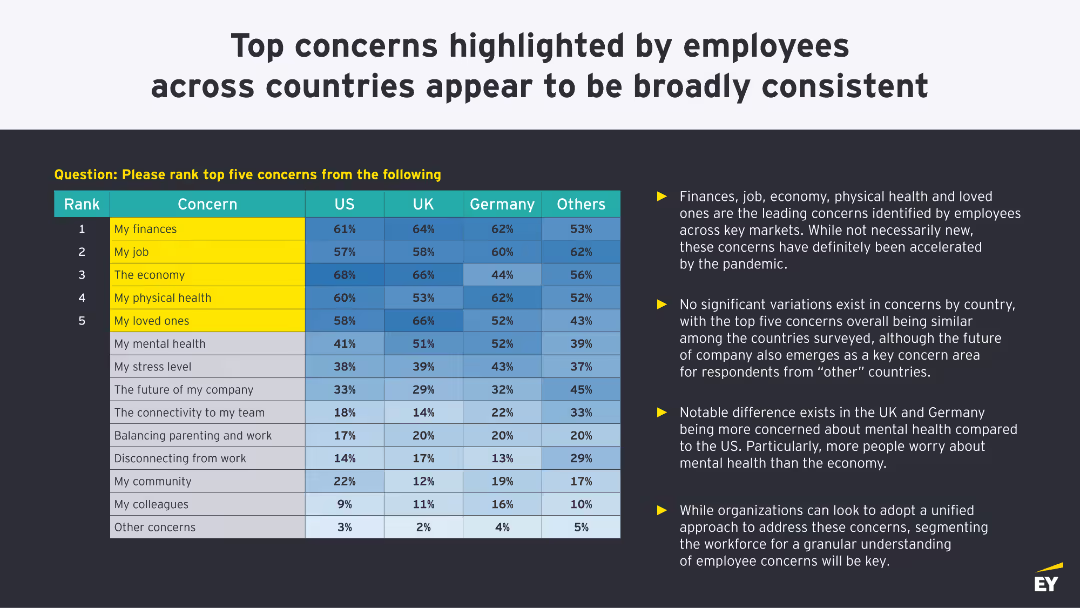
This slide displays a table with a ranking of employee concerns across different countries, accompanied by bullet points summarizing key findings.
Risk Assessment and Management
Professional Services
The slide outlines the top concerns of employees across various countries, emphasizing how these concerns have been influenced by the pandemic, and noting similarities and differences by country.
concerns, employees, countries, pandemic, key findings
Table
EY
Saved
Previous
Next
If nothing, comes up, please save your slides first
Create a FREE account to continue browsing
Receive Instant Access to 1,000+ slides from companies like McKinsey, Google, and Goldman Sachs
First Name
Last Name
Email
Password
I agree to all
Terms & Privacy Policy
Thank you! Your submission has been received!
Oops! Something went wrong while submitting the form.
Have an account?
Sign in
Column Chart
Heatmap
Chevron
Org Chart
Infographic
Callouts
Timeline
List
Graphic
Picture
Process Flow
Diagram
Paragraph
Map
Table
Framework
Subtitle
Takeaway Box
Icon
Other Chart
Radar Chart
Waterfall Chart
Mekko Chart
Pie Chart
Scatter Plot
Line Chart
Bar chart
Bullet points