My Account
My Slides
Search by Category
Templates
Leave Feedback
Login
Logout
Get Started
Browse all Slides
Browse all Slides
Create a FREE Account
Instant access to 1,000+ real slides from top companies like McKinsey, BCG, Goldman Sachs, Google and many more!
First Name
Last Name
Email
Password
I agree to all
Terms & Privacy Policy
Thank you! Your submission has been received!
Oops! Something went wrong while submitting the form.
Have an account?
Sign in
Saved Slides
This slide contains a pie chart on the left, two column charts in the middle, and a text box on the right with bullet points discussing the disciplined risk process and diverse loan portfolio. The visuals are accompanied by descriptions and data points.
Risk Assessment and Management
Financial Services
Highlights the company's disciplined risk management strategy and diverse loan portfolio, contributing to strong credit quality. The data visualizations compare the firm's loan loss rate and variance against peers, illustrating financial stability and risk control.
Risk Management, Credit Quality, Loan Portfolio, Financial Stability, Peer Comparison
Multiple Chart
Goldman Sachs
Saved
The slide features a column chart with different colored sections representing the number of digital transformation projects. Another set of graphical rockets with different colors represents expected impacts of digital investments.
Market Analysis and Trends
Technology & Software
The slide examines how many digital transformation projects organizations have embarked on during the pandemic and the expected impacts of these investments.
digital transformation, investment, local market, projects, pandemic
Multiple Chart
EY
Saved
A line chart depicting the fluctuating contribution of social media to company performance, with annotations for significant changes.
Performance Metrics and KPIs
Professional Services
Evaluates the impact of social media on company performance, essential for performance tracking in consumer services and retail.
social media, performance, consumer services, retail, impact, fluctuation, evaluation, tracking, change, contribution
Mixed Chart
Deloitte
Saved
Contains six sets of column charts representing 3-5 year earnings growth, trailing 12-month P/E, market cap, and other financial metrics by different market cap categories. The bars use shades of gray with significant figures highlighted in pink.
Financial Performance
Financial Services
Analyzes the 1-month performance of the S&P 500 index across various financial metrics, critical for investors' short-term market assessment.
S&P 500, earnings growth, market capitalization, financial metrics, performance analysis, investment, market cap segments
Multiple Chart
Morgan Stanley
Saved
The slide employs a donut chart and a simple table to depict the distribution of commercial real estate loans. It is complemented by a blue and gray color scheme that adds visual clarity to the categorical distribution.
Market Analysis and Trends
Real Estate & Construction
Specialized for real estate professionals and investors, the slide analyzes commercial real estate loan distributions and investment grades, facilitating discussions on portfolio risk and investment opportunities within the commercial real estate sector.
commercial real estate, loans, investment grade, real estate distribution, portfolio risk
Mixed Chart
Goldman Sachs
Saved
A detailed text layout with three columns providing information on Swiss Bank, Share-Backed Lending, and IB Leveraged Finance portfolios. Text boxes highlight forward-looking risk management measures for each portfolio.
Risk Assessment and Management
Financial Services
Provides an in-depth look at selected portfolios, their investment grade ratings, exposure levels, and forward-looking risk management measures. It focuses on high-quality assets, conservative lending standards, and de-risking strategies.
Swiss Bank, Share-Backed Lending, IB Leveraged Finance, risk management, portfolios
Table
Credit Suisse
Saved
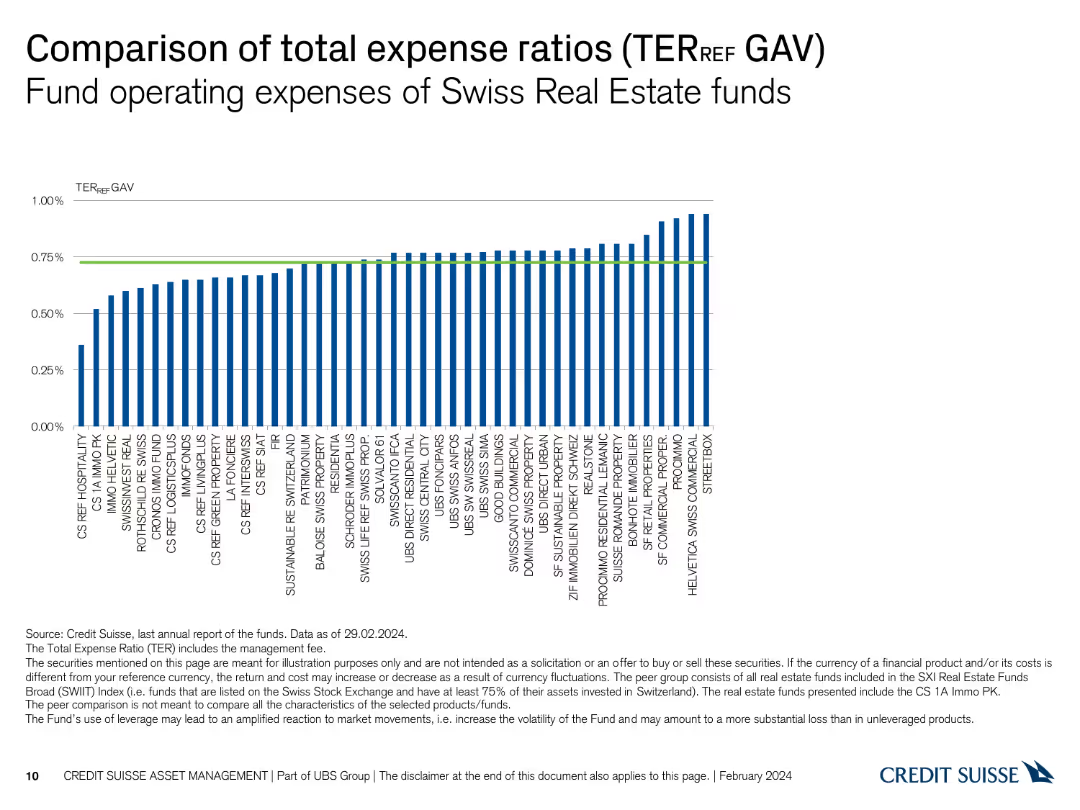
Column chart comparing total expense ratios (TER) for various Swiss real estate funds.
Financial Performance
Real Estate & Construction
Compares the total expense ratios (TER) for different Swiss real estate funds, showing operational expenses.
real estate, expense ratios, TER, operational expenses, comparison
Single Chart
Credit Suisse
Saved
This slide shows a mix of textual content, column charts showing projected revenue growth, and images of diverse people using credit cards. The visual elements are balanced with descriptions of strategic areas such as digital innovation and distinctive brand.
Strategic Planning
Financial Services
Offers a broad overview of the global cards market, emphasizing the strategy focused on client-led growth and showcasing projected revenue increases from various card services. It aims to present Citi's comprehensive approach to maintaining and growing its market share in the cards segment.
global strategy, market growth, revenue projections, client engagement, credit cards
Mixed Chart
Citigroup
Saved
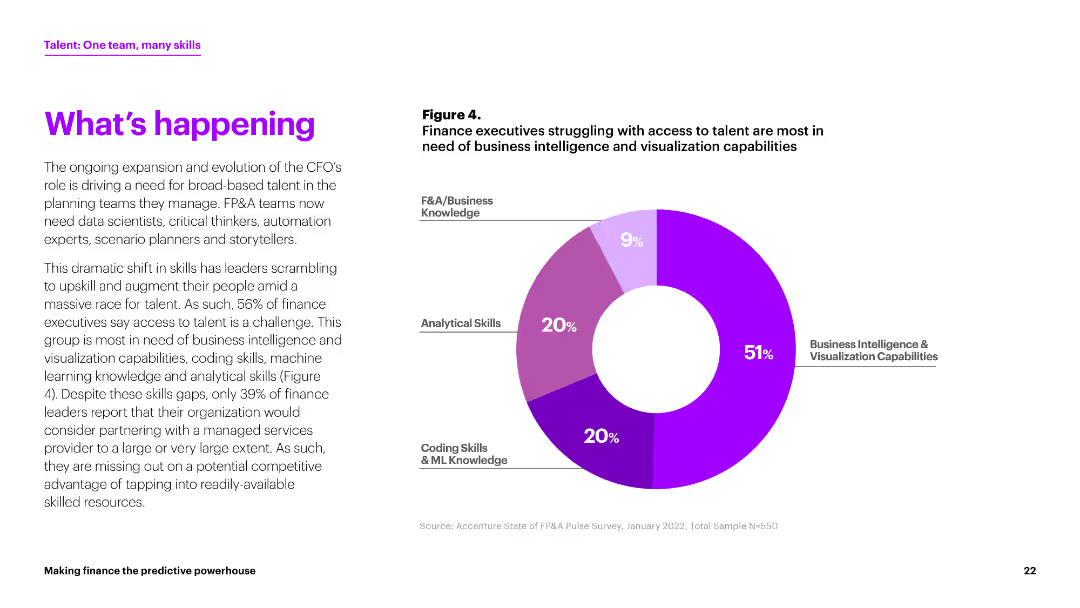
The slide includes a pie chart showing the percentage of finance executives struggling with access to talent in various skill areas. The chart is in shades of purple. The text discusses the implications of these findings.
Human Resources and Talent Management
Financial Services
This slide discusses the need for finance teams to have diverse skills, highlighting that 51% of executives struggle with business intelligence and visualization capabilities.
talent, finance executives, skills, business intelligence, visualization
Mixed Chart
Accenture
Saved
Column chart show deposit amounts and percentages by channels from Q4 2019 to Q1 2022 and deposit target goals for 2024. An arrow indicates a significant increase in deposits through strategic channels, accompanied by explanatory text.
Financial Performance
Financial Services
Showcases the increase in deposits over time, focusing on the strategic channels contributing to growth. It sets forth target goals for consumer and transaction banking deposits by 2024, reflecting the company's ambitions and market analysis efforts.
deposit growth, strategic channels, 2024 targets, market analysis, column chart
Mixed Chart
Goldman Sachs
Saved
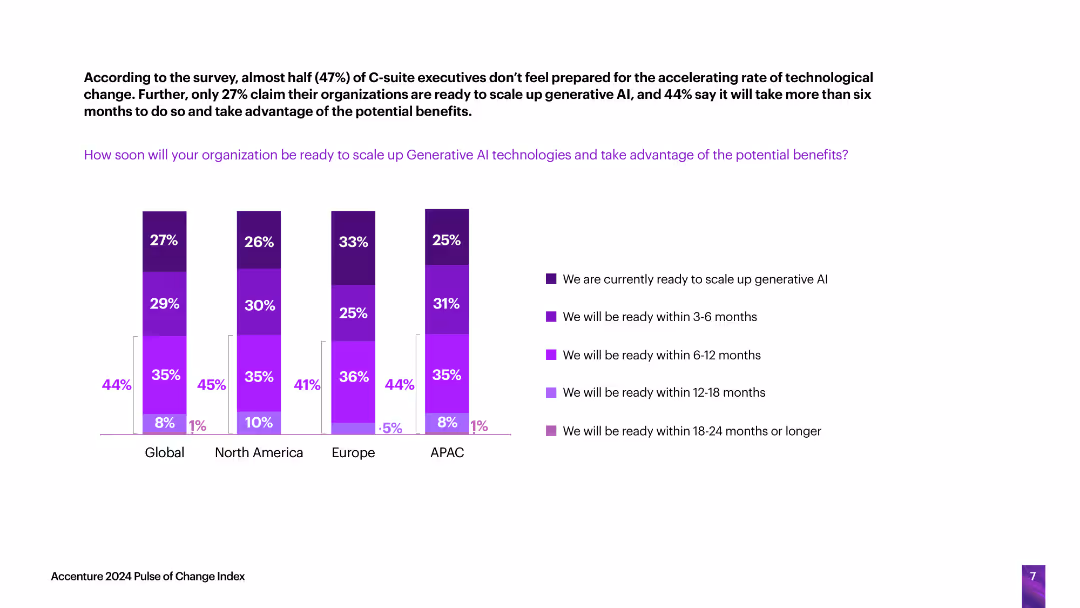
The slide includes vertical column charts indicating how soon organizations in different regions will be ready to scale up generative AI technologies, with readiness categorized by time frames (current, 3-6 months, etc.).
Technology and Digital Transformation
Technology & Software
The slide evaluates the readiness of organizations across various regions to scale up generative AI technologies, highlighting the time frames within which they expect to be prepared.
generative AI, readiness, scaling, technology adoption, time frames
Single Chart
Accenture
Saved
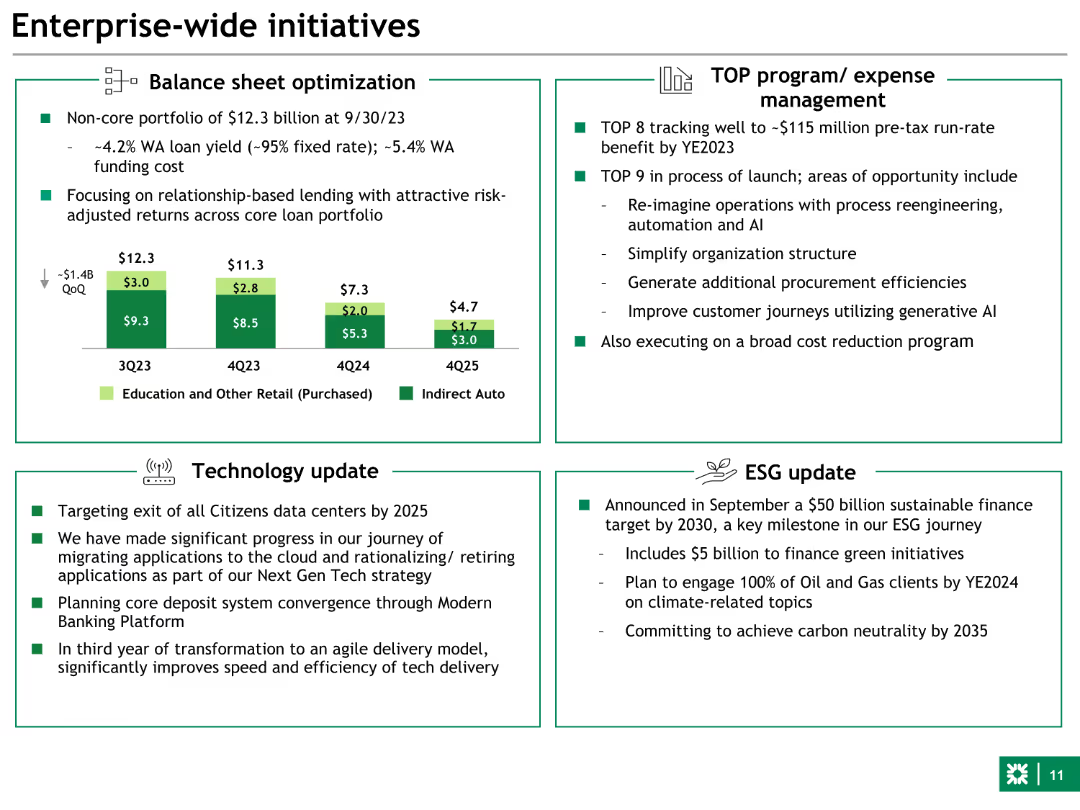
The slide contains a combination of text and a column chart. The layout is divided into four sections: Balance sheet optimization, TOP program/expense management, Technology update, and ESG update.
Strategic Planning
Financial Services
Provides an overview of key initiatives such as balance sheet optimization, expense management programs, technology updates, and ESG targets for the financial year.
Initiatives, balance sheet, ESG, technology, expense management
Mixed Chart
Goldman Sachs
Saved
Flowchart showing the evolution of analytics maturity from data modeling to machine learning, natural language processing, and AI. Includes annotations on data input and human intervention.
Technology and Digital Transformation
Technology & Software
Explains the stages of analytics maturity, from structured data modeling to advanced AI, and their impact on companies' operations and value creation.
analytics maturity, AI, data modeling, machine learning, NLP
Linear Flow
Kearney
Saved
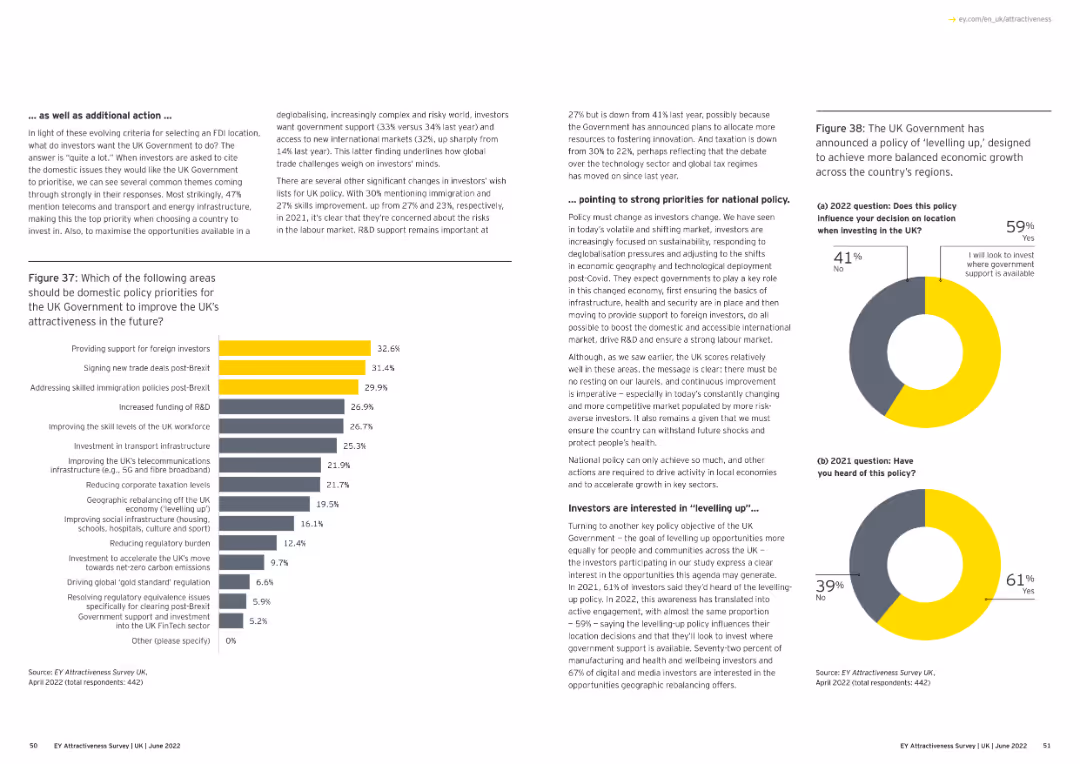
Text and a bar chart. The chart lists policy priorities for the UK government to improve attractiveness post-Brexit.
Regulatory and Compliance
Financial Services
The slide outlines policy priorities for the UK government to enhance attractiveness, focusing on foreign investment and trade deals.
policy priorities, UK government, post-Brexit, foreign investment, column chart
Multiple Chart
EY
Saved
The slide shows a balance sheet summary with column chart for assets and liabilities, emphasizing different categories with color coding. Key highlights offer insights into the balance sheet management strategies.
Operational Efficiency
Financial Services
This slide outlines the structure of a conservatively managed balance sheet, highlighting key asset and liability segments and their implications for financial stability and growth strategies. It underscores the importance of conservative financial management practices.
balance sheet, assets, liabilities, financial, management
Multiple Chart
Deutsche Bank
Saved
Diagram showing a flow from immediate actions to long-term strategy, with icons and descriptions for each stage and related tools.
Strategic Planning
Professional Services
This slide presents a strategy for remote work, from immediate actions to long-term planning, including identifying worker locations, managing compliance, developing frameworks, and continual improvement.
Remote work, strategy, compliance, governance, planning
Table
Deloitte
Saved
Scatter plot correlating the S&P 500 share of oil and gas with Brent oil prices over time, differentiated between 2000-2015 and 2016-June 2019.
Market Analysis and Trends
Financial Services
This slide presents the declining trend of oil and gas industries' share in the S&P 500 index relative to oil prices, suggesting shifts in energy sector valuations influenced by market and price factors.
oil, gas, S&P 500, market trends, Brent oil
Single Chart
BCG
Saved
Slide with column charts showing quarterly leverage exposure and risk-weighted assets, divided into categories like lending and derivatives.
Financial Performance
Financial Services
Provides an overview of the bank's financial exposure and risk through various asset categories, highlighting changes in leverage and risk management.
leverage, risk, assets, financial, banking, exposure, derivatives, management
Multiple Chart
Deutsche Bank
Saved
Purple world map highlighting revenue distribution across countries, with clear annotations and proportional indicators.
Strategic Planning
Technology & Software
Discusses the geographic revenue distribution of Accenture, identifying major revenue-contributing countries and comparing industry revenue.
revenue, global distribution, Accenture, scale, durability, resilience, geographic, countries, industry
Graphic
Accenture
Saved
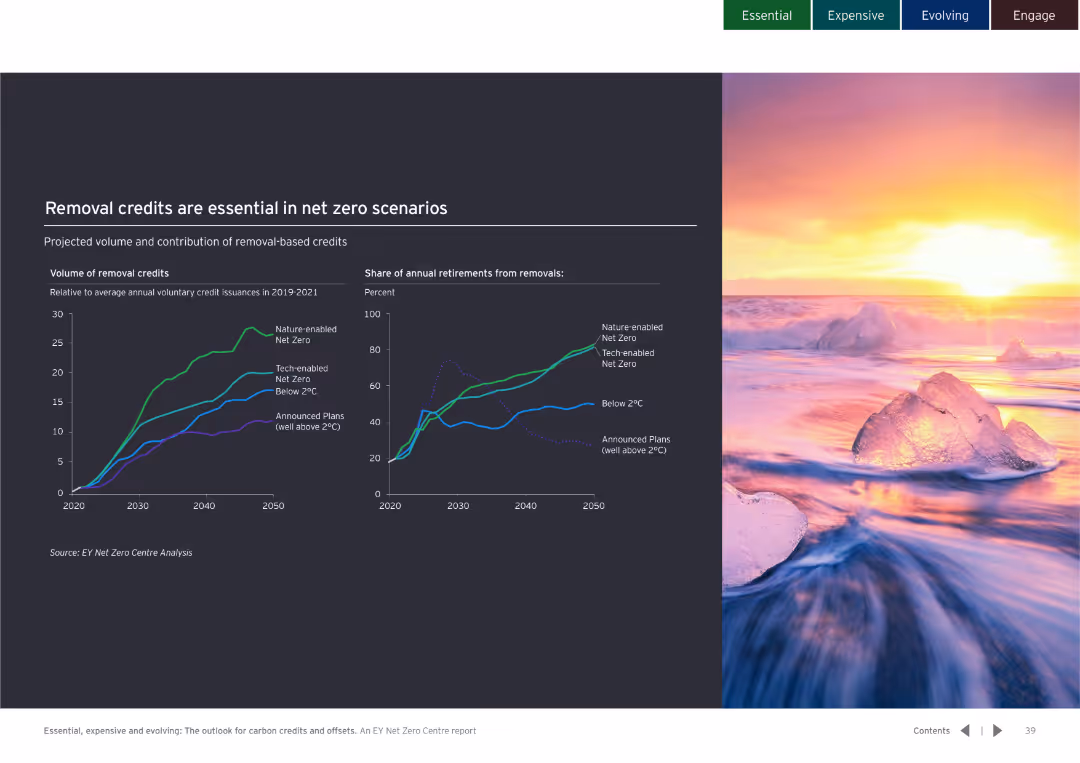
Dark background with line graphs showing the volume of removal credits and their share in annual retirements. Color-coded for clarity.
Financial Performance
Environmental Services & Sustainability
Highlights the essential role of removal credits in achieving net zero scenarios and their projected volumes over time.
removal credits, net zero, volume projections
Multiple Chart
EY
Saved
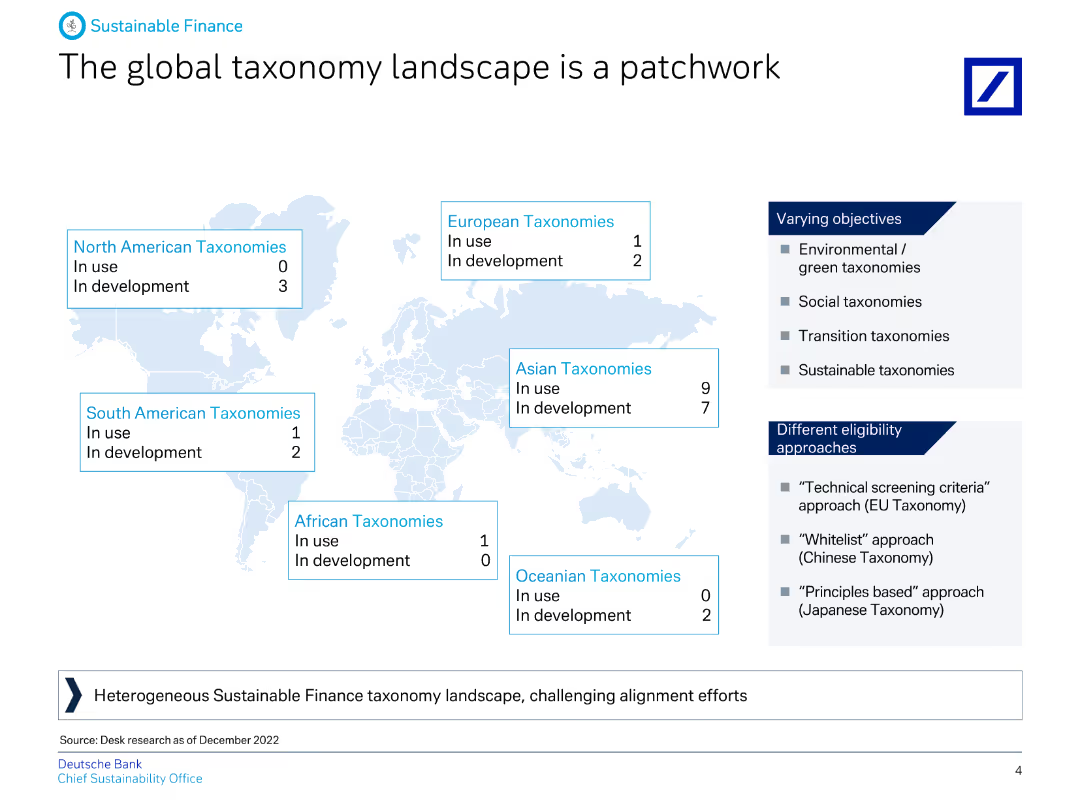
Features a world map showing the status of taxonomies in different regions, with accompanying text explaining the varying objectives and eligibility approaches.
Market Analysis and Trends
Financial Services
This slide provides an overview of the global taxonomy landscape, detailing the status and development of taxonomies in different regions and their varying objectives.
Taxonomy, global, finance, ESG, regions, objectives, eligibility, banking, sustainability, landscape
Graphic
Deutsche Bank
Saved
The slide features a pie chart and several smaller charts detailing the investment focus on cloud security, cyber resilience, and related initiatives.
Risk Assessment and Management
Technology & Software
The slide discusses the increasing investment in cybersecurity, highlighting cloud security and cyber resilience as top priorities for organizations.
cybersecurity, cloud security, resilience, data privacy, cyber initiatives
Multiple Chart
EY
Saved
Triangular diagram depicting 30 elements of value that elevate products and services beyond commodity status, categorized into social, emotional, and functional.
Product and Service Analysis
Professional Services
Outlines a framework for understanding the various elements that add value to products and services, useful in developing marketing and product development strategies.
Value, Product Analysis, Services
Framework
Bain
Saved
Line graph comparing consumer sentiment over time in five countries regarding the ongoing impact of COVID-19.
Market Analysis and Trends
Consumer Goods
Tracks changes in consumer sentiment during the COVID-19 pandemic across different regions, useful for market analysis in consumer goods industries.
COVID-19, consumer sentiment, market analysis, trends, regions
Single Chart
BCG
Saved
Text on the left explaining new consumer behaviors and an image on the right depicting a woman exercising.
Market Analysis and Trends
Consumer Goods
Discusses new consumer behavior trends such as health and wellness, focusing on integrating healthy habits into daily life.
Consumerism, health, wellness, trends, behavior
Mixed Chart
Deloitte
Saved
Previous
Next
If nothing, comes up, please save your slides first
Create a FREE account to continue browsing
Receive Instant Access to 1,000+ slides from companies like McKinsey, Google, and Goldman Sachs
First Name
Last Name
Email
Password
I agree to all
Terms & Privacy Policy
Thank you! Your submission has been received!
Oops! Something went wrong while submitting the form.
Have an account?
Sign in
Column Chart
Heatmap
Chevron
Org Chart
Infographic
Callouts
Timeline
List
Graphic
Picture
Process Flow
Diagram
Paragraph
Map
Table
Framework
Subtitle
Takeaway Box
Icon
Other Chart
Radar Chart
Waterfall Chart
Mekko Chart
Pie Chart
Scatter Plot
Line Chart
Bar chart
Bullet points