My Account
My Slides
Search by Category
Templates
Leave Feedback
Login
Logout
Get Started
Browse all Slides
Browse all Slides
Create a FREE Account
Instant access to 1,000+ real slides from top companies like McKinsey, BCG, Goldman Sachs, Google and many more!
First Name
Last Name
Email
Password
I agree to all
Terms & Privacy Policy
Thank you! Your submission has been received!
Oops! Something went wrong while submitting the form.
Have an account?
Sign in
Saved Slides
The slide features a column chart depicting managers' top three talent management priorities. On the left side, there is an image of a group of professionals in a meeting. The chart uses a mix of orange and red shades to represent different priorities.
Human Resources and Talent Management
Financial Services
The slide highlights that retaining talent is the top priority for managers, followed by hiring/recruiting and ensuring an inclusive culture. It shows that talent retention is critical, particularly in EMEA and Asia-Pacific regions.
Talent retention, recruiting, inclusive culture, diversity, hybrid work, employee productivity
Mixed Chart
EY
Saved
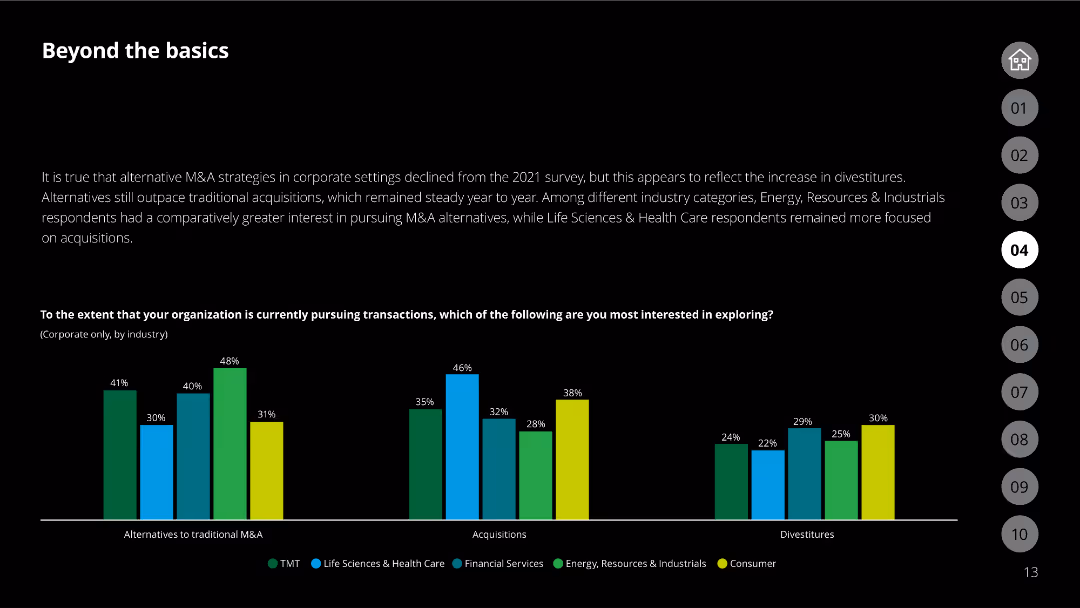
The slide has a column chart comparing interest in different M&A transaction types across various industries.
Market Analysis and Trends
Financial Services
Reflects the interest in alternative M&A strategies by different industry categories compared to 2021.
industry trends, M&A, corporate, acquisitions, divestitures
Single Chart
Deloitte
Saved
Features dynamic market maps and bar charts that analyze the competitive positioning and market dynamics of major FoodTech companies worldwide.
Competitive Landscape
Agriculture & Food Production
Analyzes the competitive landscape and market dynamics in the FoodTech industry, focusing on major players and market shifts. Provides insights into strategic positioning and market opportunities, crucial for competitive analysis.
FoodTech, Market Dynamics, Competitive Analysis, Strategic Positioning, Market Opportunities
Mixed Chart
Accenture
Saved
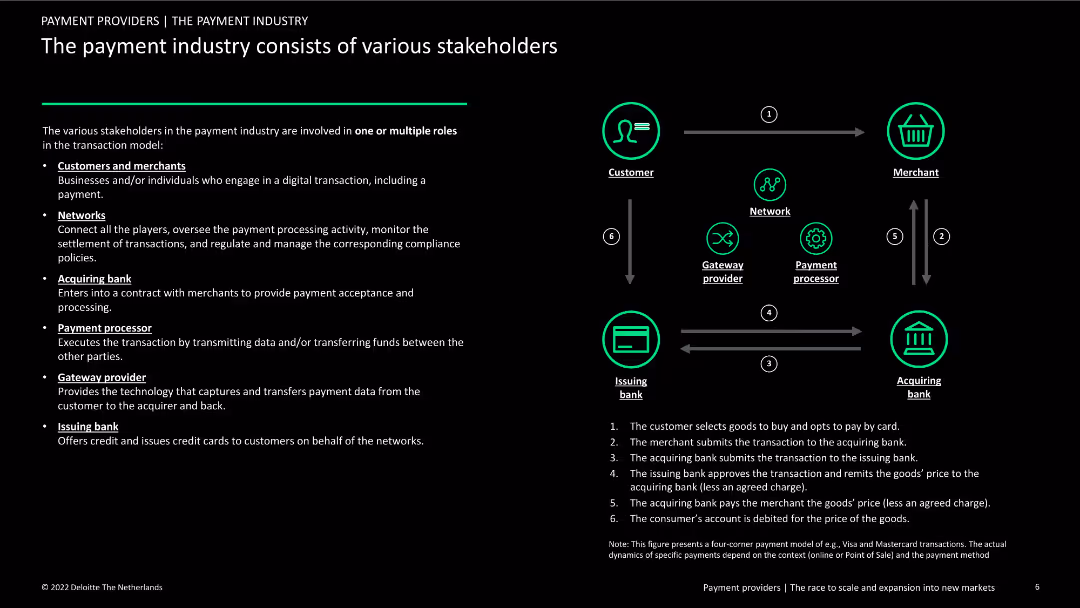
The slide illustrates the roles of various stakeholders in the payment industry with a flow diagram. Text on the left explains the functions of each stakeholder, while the right side shows the transactional process visually.
Organizational Structure and Change
Financial Services
This slide explains the roles and interactions of different stakeholders in the payment industry, including customers, networks, banks, and processors. It uses a flow diagram to depict the payment transaction process step-by-step.
payment industry, stakeholders, roles, transaction process
Diagram
Deloitte
Saved
Features a bar chart and explanatory text sections divided by headers. The chart and text provide analysis on key performance indicators for tax functions.
Performance Metrics and KPIs
Financial Services
Examines key performance indicators crucial for tax functions in the financial services industry, discussing misalignments in priorities and the need for strategic alignment of tax KPIs with overall business objectives.
tax, KPIs, performance, financial services, bar chart, alignment
Mixed Chart
PwC/Strategy&
Saved
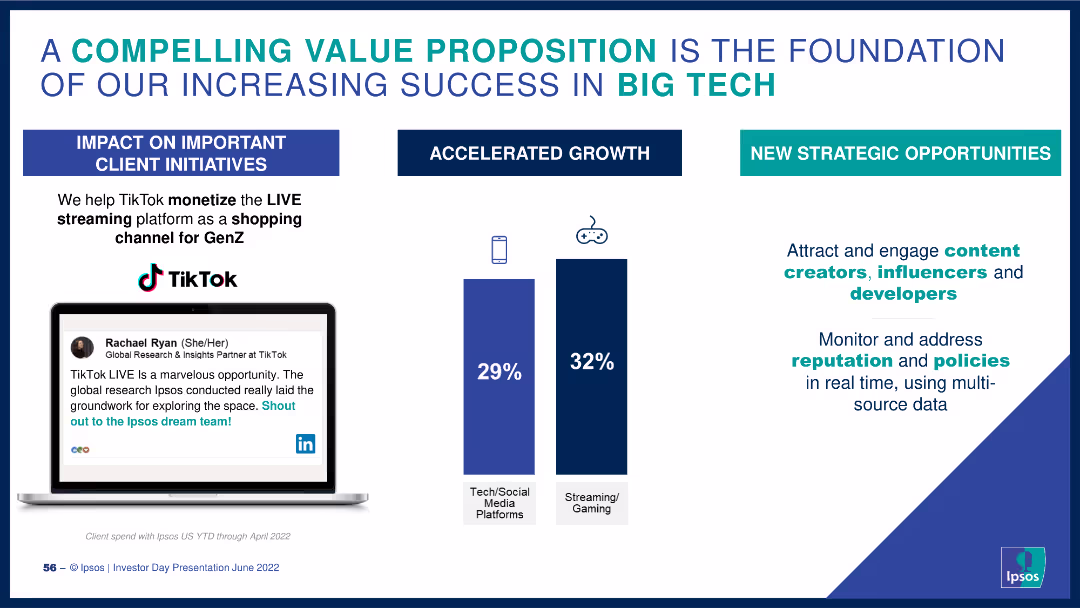
The slide includes a quote from a TikTok partner, bar charts showing growth percentages in tech/social media and streaming/gaming, and key strategic points.
Client Case Studies
Technology & Software
It showcases Ipsos's value proposition, highlighting successful client initiatives with TikTok and growth in tech and gaming sectors, along with strategic opportunities.
value proposition, client success, TikTok, Ipsos, growth
Mixed Chart
IPSOS
Saved
Text-heavy slide with bullet points outlining the demographics, financial literacy, and behavior of crypto asset owners, along with a doughnut chart.
Customer and Market Segmentation
Financial Services
Detailed profile of crypto asset owners, discussing demographics, investment behaviors, financial literacy, and the influence of advertising on ownership decisions.
crypto owners, demographics, financial literacy, investment behavior, advertising influence
Mixed Chart
IPSOS
Saved
A horizontal bar chart listing the most demanding work problems faced by CIOs, with 'Resources/Talent' being the top issue. Each bar represents a different problem and its percentage of respondents.
Human Resources and Talent Management
Professional Services
The slide identifies the top challenges faced by CIOs, with a particular focus on issues related to resources and talent, making it a tool for HR strategy discussions.
CIO Challenges, Talent Management, HR Issues, Professional Services, Workplace Problems
Mixed Chart
Gartner
Saved
Slide displays multiple column charts comparing year-over-year changes in market share and client engagement across banking services such as investments and payments.
Market Analysis and Trends
Financial Services
Details strategies to increase revenue through enhanced client services and market share growth in banking sectors like investment and commercial banking.
banking, revenue, growth, market, services
Multiple Chart
Barclays
Saved
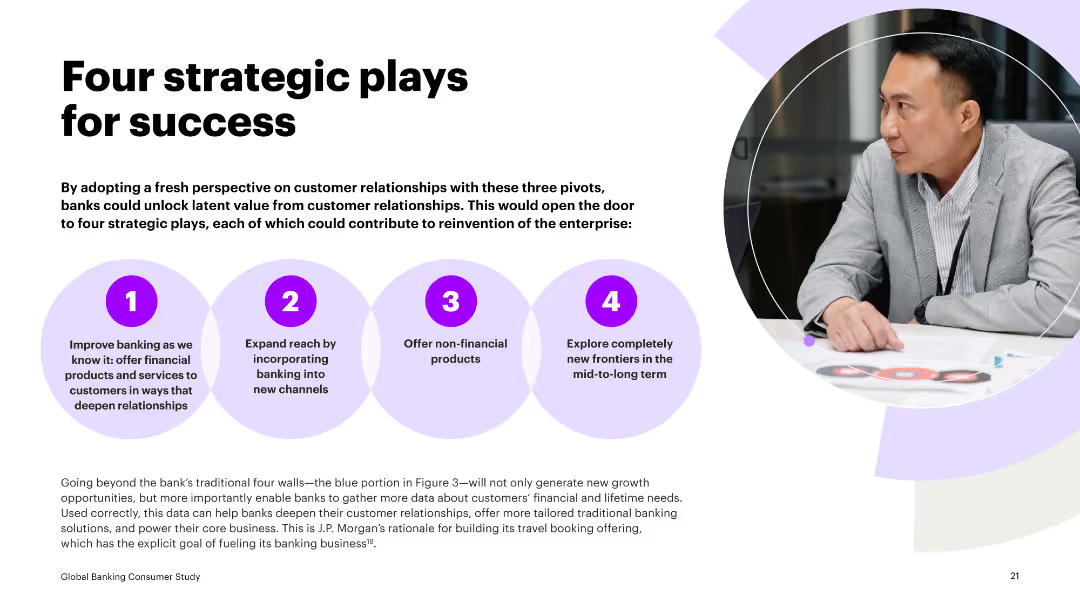
This slide has a three-column layout with icons at the top, text in the middle, and a blue color scheme. Each column has a bullet list. The slide title is at the top with a subtitle beneath.
Strategic Planning
Financial Services
The slide presents a three-pillar strategy for client services in securities. It includes technological investments, leveraging the corporate and investment bank's power, and delivering front-to-back integrated solutions. It suggests a comprehensive, connected, and automated approach to managing clients' investment portfolios.
securities, strategy, technology, investment, efficiency, automation, solutions, clients
Pillar
JP Morgan
Saved
Gartner Hype Cycle diagram for blockchain applications in 2021, showing different stages from innovation trigger to plateau of productivity.
Technology and Digital Transformation
Technology & Software
This slide presents the Gartner Hype Cycle for blockchain applications, illustrating the different stages of technology maturity. It predicts that blockchain will significantly decentralize markets and make trade more efficient, highlighting the expected timeline for various blockchain applications to reach mainstream adoption.
Blockchain, Hype Cycle, Decentralization
Mixed Chart
Roland Berger
Saved
The slide features a black background with a large orange header. It contains a text block and three bar charts displaying the percentage of employees discussing political and social issues at work, segmented by different groups.
Organizational Structure and Change
Government & Public Sector
Discusses the frequency and impact of political and social discussions at work. It examines the positive and negative outcomes of these discussions across various demographic groups, revealing that such interactions can have both beneficial and detrimental effects on workplace dynamics.
workplace discussions, political issues, social issues, demographics
Multiple Chart
PwC/Strategy&
Saved
Circular diagram showing percentage agreement across age groups for the preference of having local bank branches, accompanied by textual insights.
Customer and Market Segmentation
Financial Services
Discusses consumer preference for local bank branches and the role they play in stability and personal service, supported by age group data.
bank branches, consumer preference, age groups, local branches, stability, personal service, insights, survey
Linear Flow
Accenture
Saved
The slide includes two column charts depicting revenue and asset growth in CHF bn, with notable CAGR and net new assets figures. Bullet points detail the record growth and strategic initiatives driving organic expansion in the APAC region.
Market Analysis and Trends
Financial Services
The slide showcases the strong organic growth in APAC wealth management, highlighting significant revenue and asset increases. It discusses the strategic initiatives and market conditions that have contributed to this record growth, emphasizing the region's potential.
APAC, organic growth, wealth management, revenue, assets
Multiple Chart
Credit Suisse
Saved
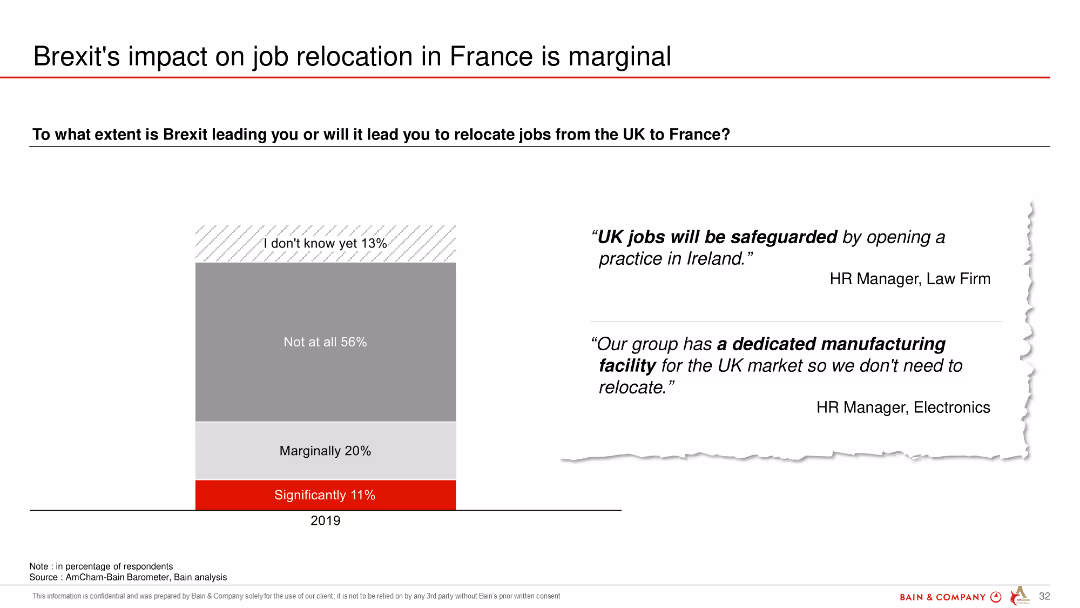
The slide features a column chart showing the extent to which Brexit is expected to lead to job relocations from the UK to France, with a majority indicating no significant impact.
Regulatory and Compliance
Government & Public Sector
The slide illustrates that most respondents do not expect Brexit to lead to significant job relocations from the UK to France, with marginal to no impact.
Brexit, job relocation, UK, France, impact, survey, expectations
Mixed Chart
Bain
Saved
The slide presents a rocket diagram indicating stages of risk management maturity in Mauritius, using percentages and a visual metaphor of a rocket's trajectory.
Risk Assessment and Management
Financial Services
Displays the progression of risk management practices in Mauritius, showing most companies at the basic governance stage. Useful for discussions on improving risk management frameworks within organizations.
risk management, Mauritius, governance, stages
Linear Flow
PwC/Strategy&
Saved
The slide presents a circular graph and a line chart, both using a soothing beige palette, to show spending patterns on Afterpay, with specific focus on Gen Z. The design is clean and effective in highlighting key data points.
Market Analysis and Trends
Retail & E-commerce
Illustrates spending patterns on Afterpay, focusing on the rapid growth among Gen Z consumers. This analysis is valuable for understanding market trends and consumer preferences in digital payment solutions.
Afterpay, Consumer Spending, Gen Z, Growth
Multiple Chart
Accenture
Saved
Comparison of core client relationships and wealth held away from 2019 to 1Q 2022, shown with increase multipliers. Clean design with blue and green color coding.
Market Analysis and Trends
Financial Services
Illustrates the growth of Morgan Stanley's business and the concurrent expansion of market opportunity over time.
Growth, market opportunity, Morgan Stanley, core client relationships, wealth management, expansion
Multiple Chart
Goldman Sachs
Saved
A column chart showing the percentage of people who trust business leaders to tell the truth across various countries, with global averages highlighted.
Market Analysis and Trends
Government & Public Sector
The slide presents data on trust in business leaders globally, showing higher trust in emerging markets compared to developed ones.
business leaders, trust, emerging markets, developed markets, column chart, percentages
Multiple Chart
IPSOS
Saved
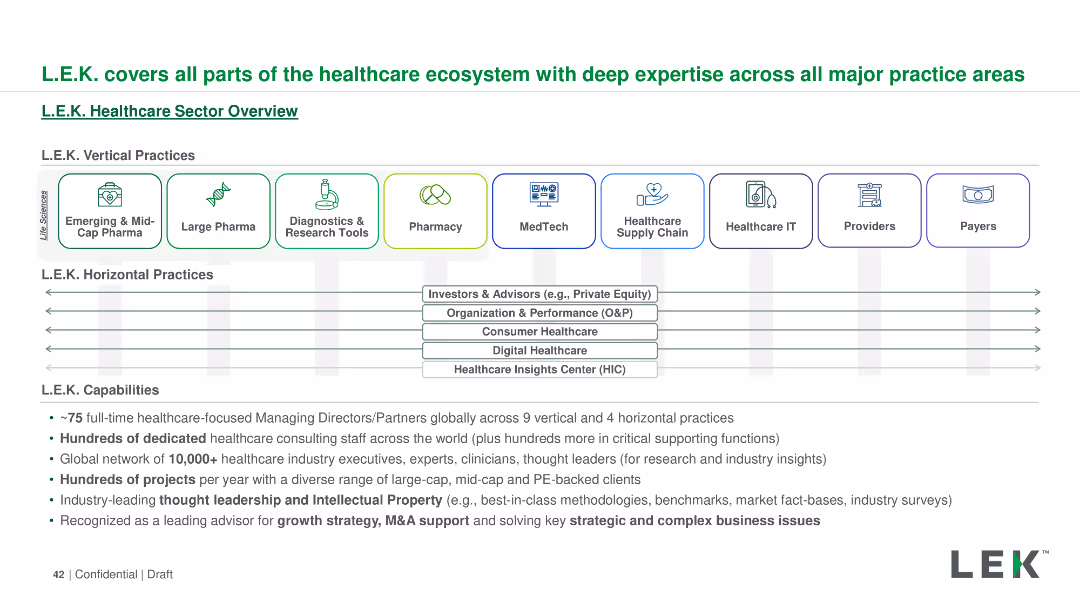
The slide outlines L.E.K.'s healthcare sector capabilities using a horizontal layout. It includes icons and text boxes to detail vertical and horizontal practices, capabilities, and global reach. Colors and icons are used for visual categorization.
Industry Overview
Professional Services
The slide provides an overview of L.E.K.'s comprehensive involvement in the healthcare ecosystem, covering vertical and horizontal practices, capabilities, and their global network. It highlights their expertise and range of services in the healthcare sector.
L.E.K., healthcare, ecosystem, vertical practices, horizontal practices, capabilities, global reach, services
Diagram
LEK
Saved
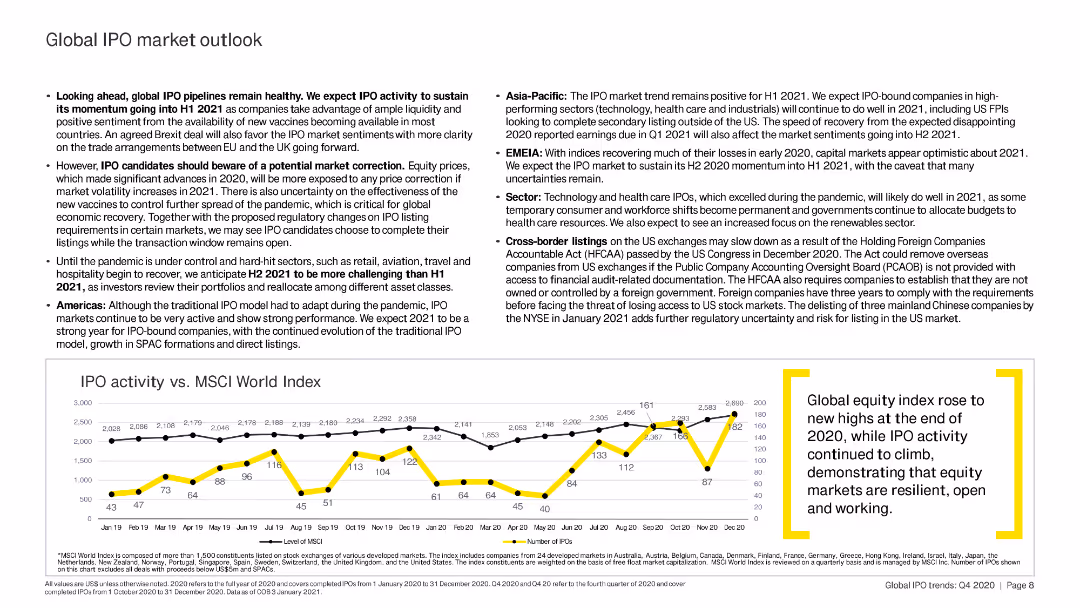
The slide features a line chart comparing IPO activity to the MSCI World Index, and several bullet points summarizing global IPO market outlook and potential risks.
Market Analysis and Trends
Financial Services
The slide offers a comprehensive outlook on the global IPO market, discussing expected trends and potential risks for the first half of 2021. Key points include market momentum, sector performance, and regional highlights.
global IPO, MSCI, market outlook, 2021, risks
Mixed Chart
EY
Saved
The slide has a detailed table with financial data, segmented into two sections for quarterly and year-to-date results. Blue and black text is used to highlight certain figures, with annotations in red text. Percentages and monetary values are prevalent throughout the slide.
Financial Performance
Financial Services
The slide presents a comprehensive view of financial results, including net income, revenues, expenses, and earnings per share. It's used to communicate the company’s financial performance over a quarter and year-to-date to stakeholders.
financial, results, revenue, expenses, EPS, net income, quarterly, year-to-date
Mixed Chart
Citigroup
Saved
This slide is similar to slide 3611 with an updated focus on the latest quarterly data. It has several column charts detailing net interest income by segment and loans by type, along with key metrics, all presented with a clear blue and gray color scheme.
Financial Performance
Financial Services
This is an updated version of a financial overview, detailing net interest income and loan distribution. It's particularly useful for financial reviews, stakeholder briefings, or company quarterly reports.
Quarterly Report, Loan Distribution, Interest Income
Multiple Chart
Goldman Sachs
Saved
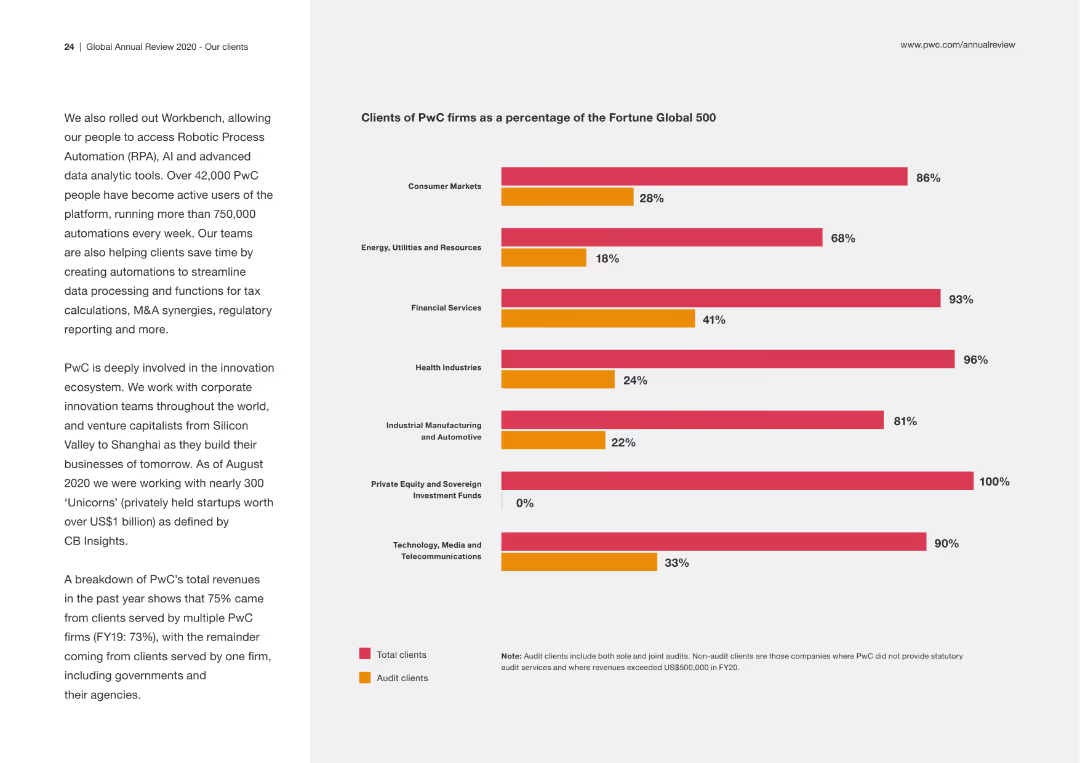
This slide includes a column chart showing the percentage of PwC clients within different industries, using two colors to differentiate between total clients and audit clients. The left side contains a brief description of PwC's involvement in innovation.
Market Analysis and Trends
Professional Services
The slide details the distribution of PwC clients across various industries, highlighting the firm's reach and specialization in different sectors. It underscores PwC's role in driving innovation.
PwC, clients, industries, market analysis, audit clients, innovation
Mixed Chart
PwC/Strategy&
Saved
Contains a pair of column charts with a notable use of color coding to differentiate between various appeal origins. Textual content is balanced with visual data.
Operational Efficiency
Government & Public Sector
This slide explores the typical practices of the Appeal Division, including the use of three-judge benches and statistics on appeal origins, which aids in understanding division operations and decision-making.
appeal division, three-judge bench, case management, practices
Mixed Chart
PwC/Strategy&
Saved
Previous
Next
If nothing, comes up, please save your slides first
Create a FREE account to continue browsing
Receive Instant Access to 1,000+ slides from companies like McKinsey, Google, and Goldman Sachs
First Name
Last Name
Email
Password
I agree to all
Terms & Privacy Policy
Thank you! Your submission has been received!
Oops! Something went wrong while submitting the form.
Have an account?
Sign in
Column Chart
Heatmap
Chevron
Org Chart
Infographic
Callouts
Timeline
List
Graphic
Picture
Process Flow
Diagram
Paragraph
Map
Table
Framework
Subtitle
Takeaway Box
Icon
Other Chart
Radar Chart
Waterfall Chart
Mekko Chart
Pie Chart
Scatter Plot
Line Chart
Bar chart
Bullet points