My Account
My Slides
Search by Category
Templates
Leave Feedback
Login
Logout
Get Started
Browse all Slides
Browse all Slides
Create a FREE Account
Instant access to 1,000+ real slides from top companies like McKinsey, BCG, Goldman Sachs, Google and many more!
First Name
Last Name
Email
Password
I agree to all
Terms & Privacy Policy
Thank you! Your submission has been received!
Oops! Something went wrong while submitting the form.
Have an account?
Sign in
Saved Slides
The slide features a line chart comparing the likelihood of listing investment properties for sale from Fall 2018 to Fall 2020.
Market Analysis and Trends
Real Estate & Construction
This slide presents data on the likelihood of investment property owners listing their properties for sale, comparing trends over three years.
property sale, market trends, investment, likelihood, line chart, historical data, real estate
Single Chart
IPSOS
Saved
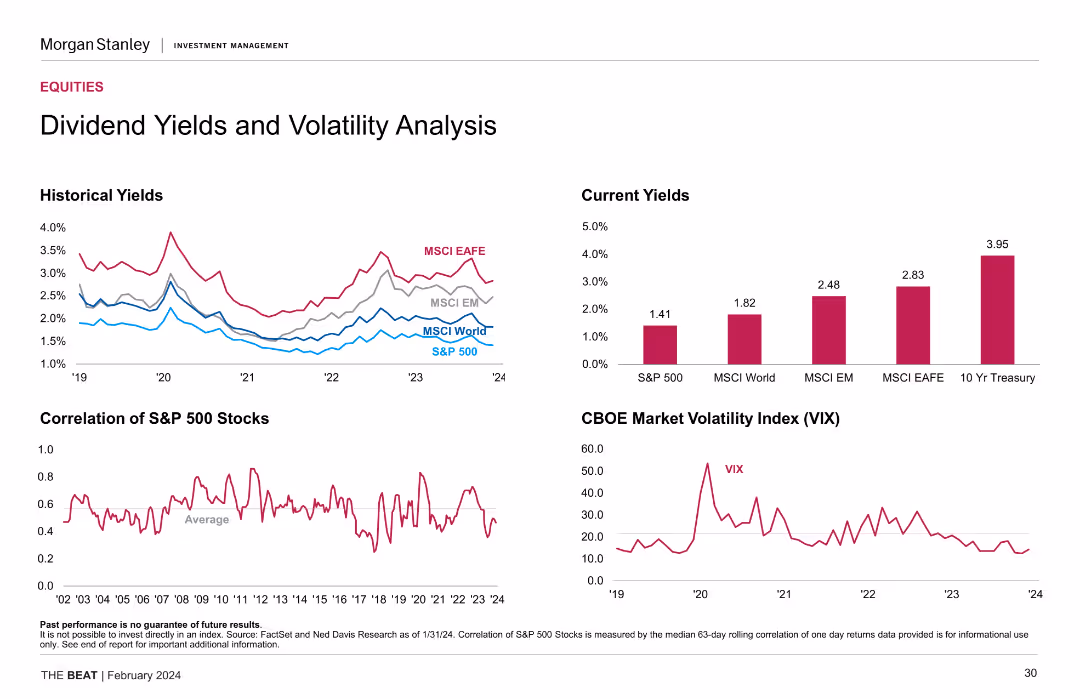
The slide features several charts: a line chart for historical yields, a bar chart for current yields, and a line chart for the CBOE Market Volatility Index.
Financial Performance
Financial Services
This slide analyzes dividend yields and volatility, comparing historical and current yields and showing the market volatility index, aiding investment decisions.
Dividend Yields, Volatility, Historical Yields, Current Yields, VIX
Multiple Chart
Morgan Stanley
Saved
Three column charts comparing the portfolio and EM Index on return on equity, EPS growth, and net debt/EBITDA ratios.
Financial Performance
Financial Services
This slide highlights the key quality and growth metrics of the portfolio versus the EM Index, focusing on return on equity, EPS growth, and debt ratios.
Quality, Growth, Metrics, Portfolio, EM Index, Return on Equity, EPS, Debt, Financial, Comparison
Multiple Chart
Morgan Stanley
Saved
Slide with a black background and a bold red header showcasing a column chart comparing skills gap closure strategies by region, complemented by a quote section in red.
Market Analysis and Trends
Financial Services
Analyzes strategies for closing skills gaps, with a focus on North America's approach via education. Insightful for discussions on global workforce development trends.
Skills gap, North America, CEO, education, retraining, pipeline, workforce, strategy, global comparison, survey
Mixed Chart
PwC/Strategy&
Saved
Contains a map of the U.S. with color-coded regions, table comparing the company to its peers, and a clear textual overview of assets, deposits, and loans.
Industry Overview
Financial Services
Overview of the company's financial standing, market position, and operational scope, suitable for introducing the company to stakeholders or for orientation purposes.
financial overview, market position, company scope, operational reach
Graphic
Goldman Sachs
Saved
The slide is divided into a textual description on the left and a line graph on the right that tracks economic and social/political pessimism over four years, differentiating between millennials and Gen Z. It uses blue and green lines against a white background.
Market Analysis and Trends
Technology & Software
This slide explores the growing economic and social/political pessimism among millennials and Gen Z. The line graph shows an increasing trend in negative outlooks from 2018 to 2021. It suggests a correlation with recent global events and the potential long-term impacts on societal attitudes and business strategies.
Pessimism, Millennials, Gen Z, Economic Outlook, Social Political, Line Graph, Trends, Business Strategy
Mixed Chart
Deloitte
Saved
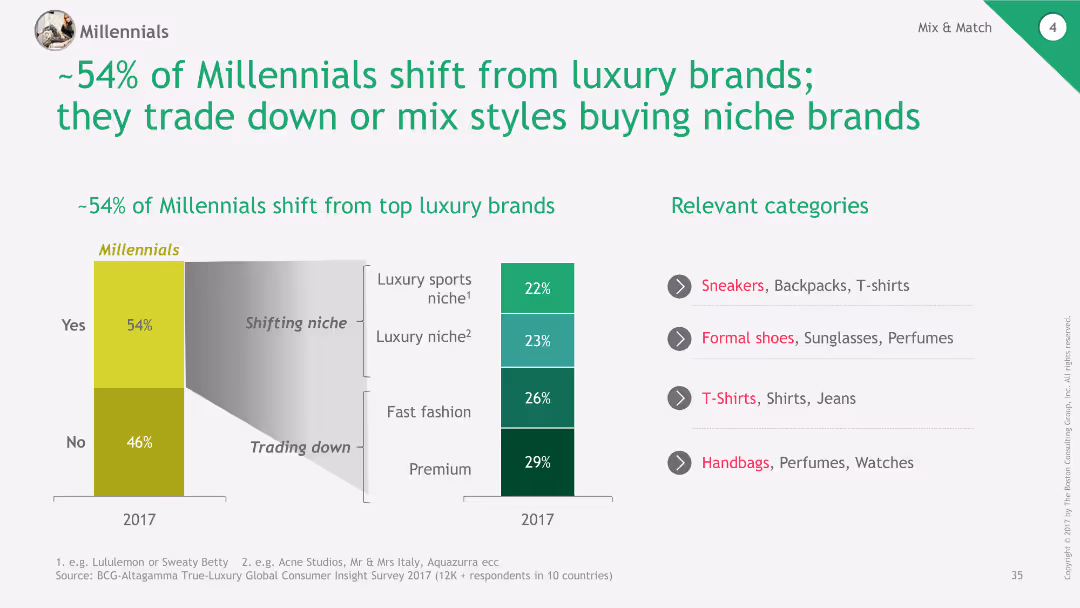
The slide features a column chart on the left showing the percentage of Millennials shifting from luxury brands (54%) and those not shifting (46%). On the right, it shows a breakdown of the niches they are shifting to: Luxury sports niche (22%), Luxury niche (23%), Fast fashion (26%), and Premium (29%). Relevant categories are listed to the right.
Market Analysis and Trends
Consumer Goods
This slide analyzes the trend of Millennials shifting away from top luxury brands, highlighting the niches they are moving towards and listing relevant product categories.
Millennials, luxury, brands, niches, fashion
Multiple Chart
BCG
Saved
The slide contains two charts: a line chart for Brent crude oil spot prices and a column chart for global inventory changes, both from Jan 2021 to Jan 2023.
Market Analysis and Trends
Energy & Utilities
The slide discusses the recent trends in crude oil prices and inventories, emphasizing supply-demand dynamics and future price pressures.
crude oil, prices, inventories, energy, market trends, supply-demand
Multiple Chart
Accenture
Saved
This slide shows a series of column charts comparing the share of quantum patents by country and technology type (QT, QC, QComms, QS). Each chart lists countries such as China, Japan, EU, USA, and others.
Market Analysis and Trends
Technology & Software
The slide highlights the dominance of Chinese companies in obtaining QT patents across various technology types. It compares the patent shares of different countries and provides key takeaways on global patent trends.
QT, Patents, China, Technology, Countries
Multiple Chart
McKinsey
Saved
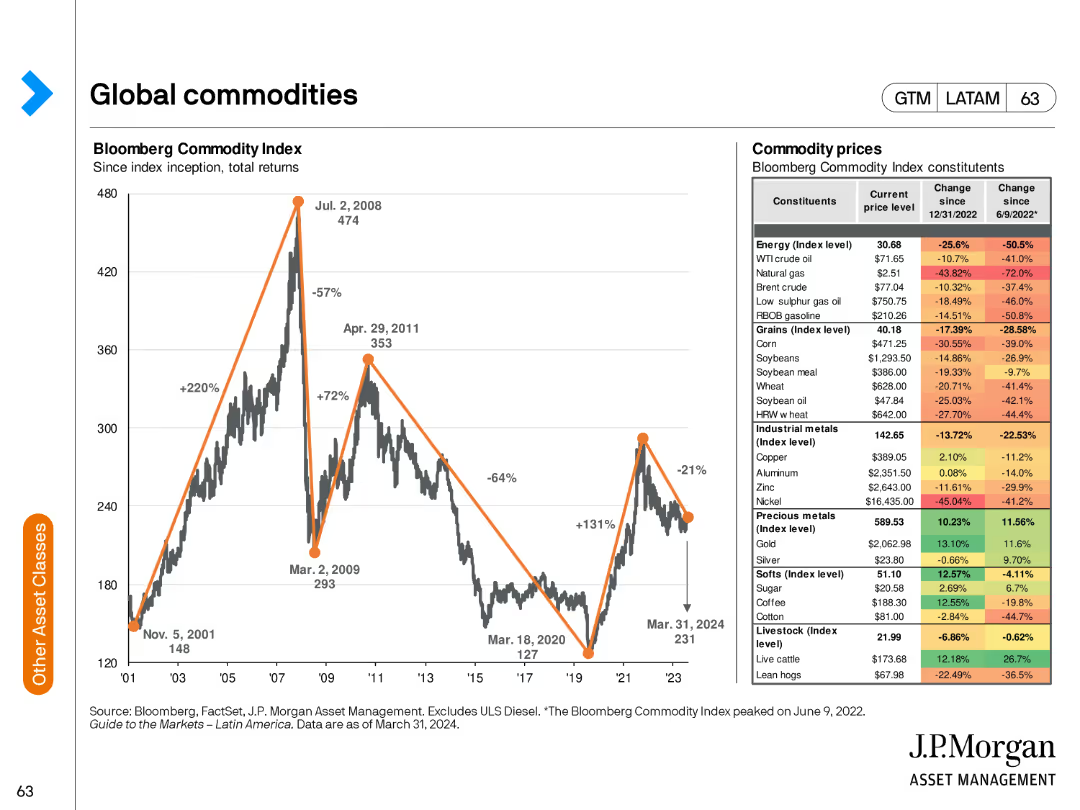
The slide includes a line chart depicting the Bloomberg Commodity Index total returns and a table showing current commodity prices and their changes over time.
Market Analysis and Trends
Financial Services
This slide provides an overview of the global commodities market, focusing on the Bloomberg Commodity Index and the price changes of various commodities.
commodities, Bloomberg Index, total returns, prices, market overview
Mixed Chart
JP Morgan
Saved
Bar chart of liquidity coverage ratio trends and a donut chart of liquidity pool composition, emphasizing high-quality liquid assets and securities.
Financial Performance
Financial Services
Presentation of liquidity coverage ratio and the composition of UBS's liquidity pool, highlighting high-quality liquid assets.
Liquidity, coverage, assets, securities, cash
Multiple Chart
UBS
Saved
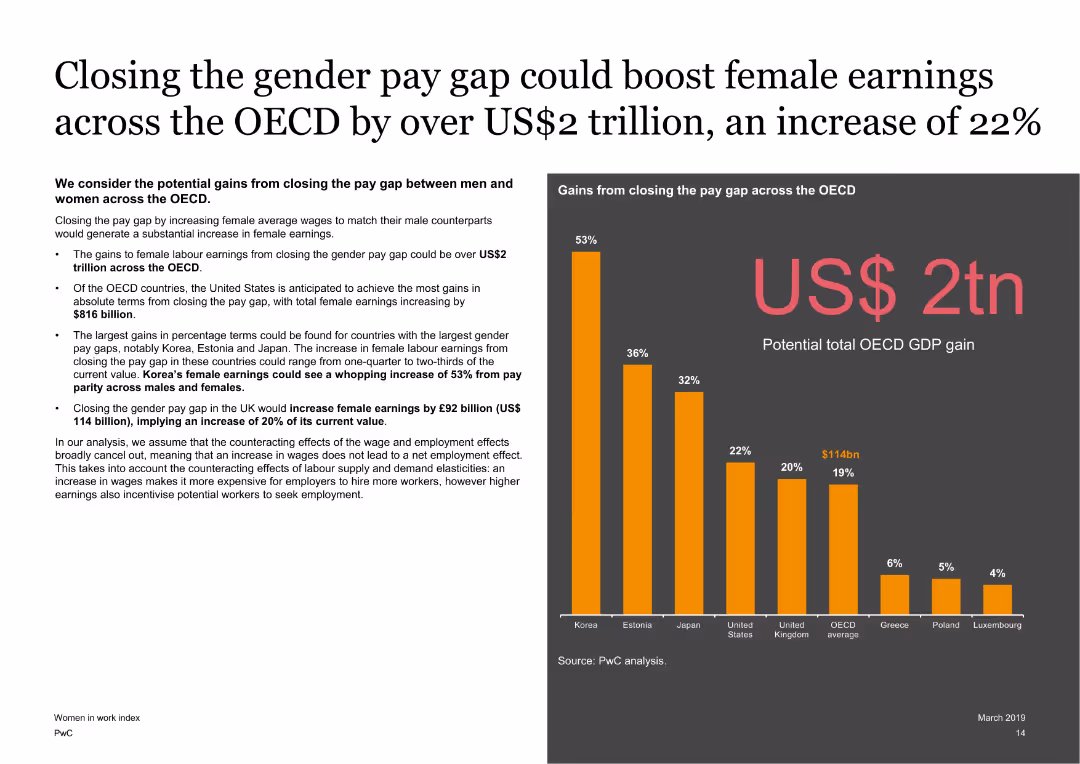
This slide features text on the left and a column chart on the right. The column chart shows gains from closing the gender pay gap across the OECD. The slide is moderately dense with detailed analysis.
Market Analysis and Trends
Government & Public Sector
Examines the potential gains from closing the gender pay gap between men and women across the OECD, highlighting significant gains in female earnings and economic benefits for various countries, especially the US and Korea.
gender pay gap, female earnings, OECD, economic impact, wage equality
Mixed Chart
PwC/Strategy&
Saved
The slide includes line graphs comparing CAC vs CO2 emissions from electricity generation for FCEV and BEV under different scenarios.
Regulatory and Compliance
Energy & Utilities
The slide analyzes the carbon abatement cost and CO2 emissions for fuel cell electric vehicles and battery electric vehicles, considering the impact of grid emissions on savings.
CAC, CO2, FCEV, BEV, emissions, savings
Mixed Chart
Kearney
Saved
The slide contains a timeline indicating the development and testing phases of new drilling technologies. It has arrows pointing to future milestones, suggesting ongoing progress. It is text-heavy with timelines stretching across several quarters.
Technology and Digital Transformation
Financial Services
It illustrates a timeline of the development and commercialization of new technologies. The content is specific to the stages of product testing and market release, useful for updating stakeholders on progress and future plans.
technology, roadmap, development, testing, commercialization, mining, COREVIBE™, MAGHAMMER™, Blast DOG™
Linear Flow
Morgan Stanley
Saved
The slide has basic visual complexity with a text-based list that outlines the sections of a report. The design is straightforward and utilitarian, with a clean white background and clear, readable fonts.
Technology and Digital Transformation
Industrial & Manufacturing
The slide provides an agenda or table of contents for a report on process automation, detailing the various segments to be covered. It gives viewers a clear structure of the topics that will be discussed, such as industry views, megatrend impacts, and market profitability.
Table of contents, Report structure, Automation, Industry segments
Agenda
LEK
Saved
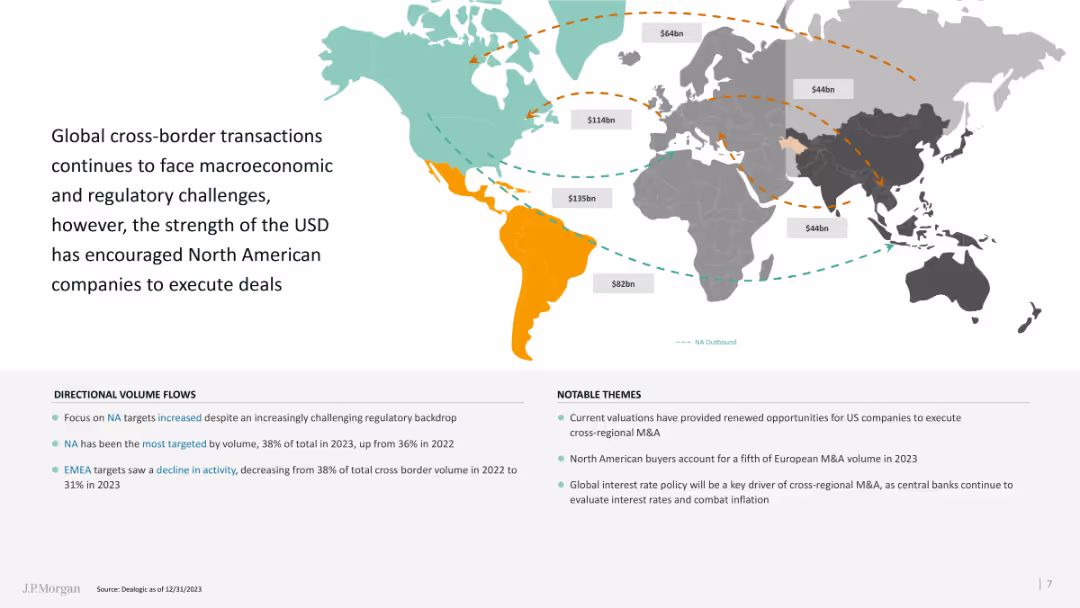
The slide includes a world map with transaction volumes marked and several directional flow arrows.
Market Analysis and Trends
Financial Services
This slide highlights global cross-border M&A activity, focusing on regional trends and the impact of USD strength.
Cross-border, transactions, global, M&A, USD strength
Graphic
JP Morgan
Saved
The slide has a large number "05" and a bar chart. The right side lists ways CROs expect their roles to evolve, while the left provides an overview of the CRO's changing role.
Strategic Planning
Financial Services
This slide explains the evolving role of CROs in the insurance industry, highlighting future expectations and the importance of strategic risk management.
CRO, risk management, insurance, role evolution, strategic planning
Mixed Chart
EY
Saved
This slide features a bar chart under "FIGURE 3" and bulleted points discussing the potential of worker time being augmented/automated by intelligent technologies.
Market Analysis and Trends
Technology & Software
The slide details which roles are most susceptible to automation and augmentation by intelligent technologies, with a focus on how worker activities evolve with these advancements.
Augmentation, Automation, Employment, Trends, AI
Mixed Chart
Accenture
Saved
The slide features a comprehensive diagram summarizing the general overview of processing methods for biofuels. It includes stages from harvesting/collection, conditioning, pretreatment, intermediate, conversion, to biofuel consumption, highlighting different processes at each stage.
Technology and Digital Transformation
Energy & Utilities
This slide provides an overview of the processing methods for biofuels, detailing each stage from harvesting and collection to final biofuel consumption, emphasizing the importance of conditioning, pretreatment, and conversion processes.
processing methods, biofuels, harvesting, conditioning, pretreatment, intermediate, conversion, biofuel consumption
Diagram
Kearney
Saved
Slide uses a comparative layout with text blocks and a central transition arrow.
Strategic Planning
Financial Services
Discusses strategic shifts in UK digital investing and wealth management to enhance market position.
strategy, wealth management, digital investing, market share, UK
Linear Flow
Barclays
Saved
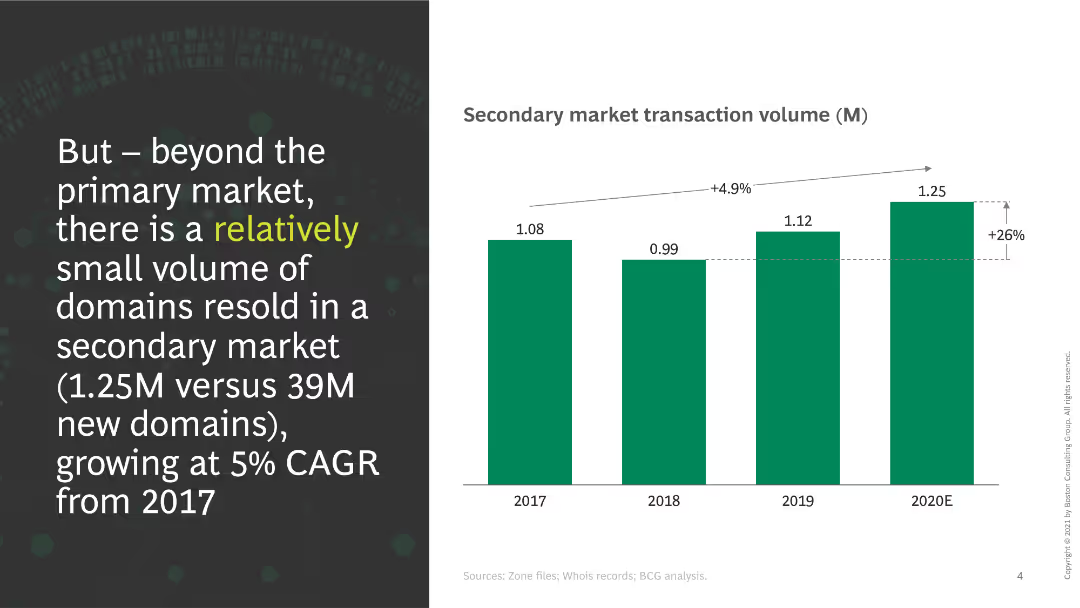
This slide shows a column chart indicating secondary market transaction volumes from 2017 to 2020E. A significant increase in transactions is noted, with a CAGR of 5%.
Market Analysis and Trends
Retail & E-commerce
The slide discusses the volume of domains resold in the secondary market, emphasizing the growth rate and the small volume compared to the primary market.
secondary market, transactions, growth, domains, volume, CAGR
Mixed Chart
BCG
Saved
This slide is a data-rich presentation featuring two complex graphs. The left graph juxtaposes the US federal debt as a percentage of GDP against the inflation rate over an extensive historical period. The right graph shows the 'Deepest real yield declines in a generation' with a declining trend. The graphs are colored in orange and purple and are detailed with timelines, percentage scales, and annotations for specific years.
Financial Performance
Financial Services
The slide discusses the concept of financial repression post-WWII and its recurrence in the context of COVID-19 management strategies. It examines the relationship between US federal debt and inflation, indicating a policy of keeping real interest rates low. Additionally, it presents data on real yield declines of US Treasury yields less CPI, suggesting a historical perspective on current financial trends.
financial repression, COVID-19, debt, GDP, inflation, yield declines, interest rates, treasury, historical data
Multiple Chart
Citigroup
Saved
A slide presenting an external study's findings on the F-150's status as the most American-made full-size pickup.
Product and Service Analysis
Transportation & Logistics
Discusses the significance of the Ford F-150 in the American auto industry, its sales, and its rank as an American-made vehicle.
Ford F-150, American-made, auto industry, truck sales, vehicle classification, market analysis, competitive ranking
Single Chart
BCG
Saved
Slide is a straightforward table layout listing acronyms used in the presentation. Each row has the acronym and its full meaning.
Market Analysis and Trends
Education & Training
Serves as a reference material providing definitions for various acronyms related to green economy and investments used throughout the presentation, facilitating better understanding for the audience.
acronyms, glossary, green economy
Text Only
Bain
Saved
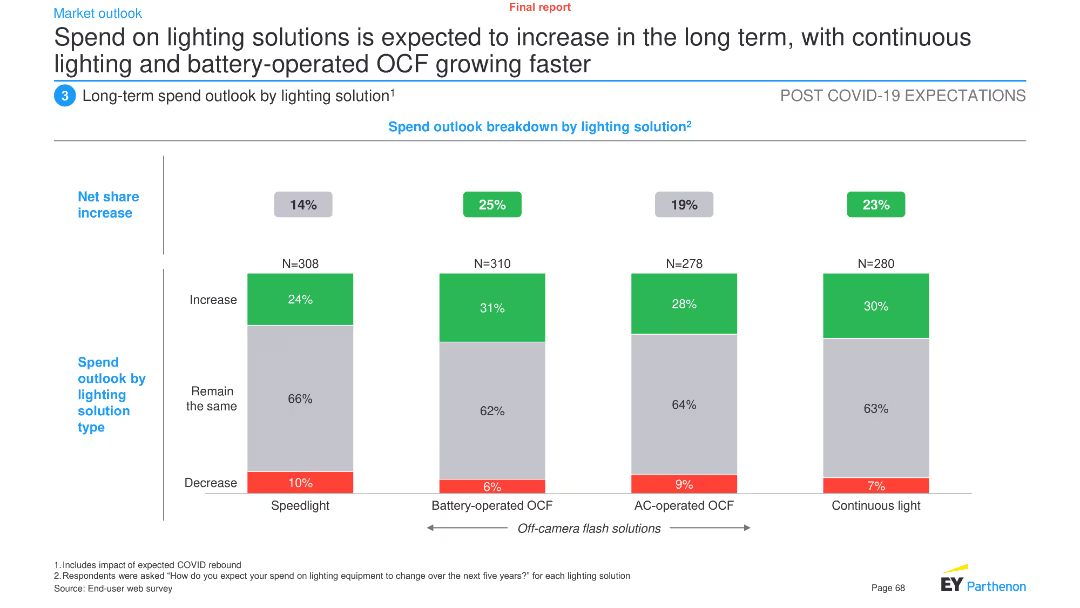
This slide features a column chart showing the net share increase in spend outlook by different lighting solutions: speedlight, battery-operated OCF, AC-operated OCF, and continuous light.
Market Analysis and Trends
Industrial & Manufacturing
The slide projects an increase in spending on lighting solutions, particularly battery-operated and continuous lighting, over the long term. It provides a breakdown of expected changes in spending across various lighting technologies.
Lighting solutions, spend outlook, long-term trends, battery-operated OCF, continuous light, speedlight, AC-operated OCF, market forecast
Single Chart
EY
Saved
Previous
Next
If nothing, comes up, please save your slides first
Create a FREE account to continue browsing
Receive Instant Access to 1,000+ slides from companies like McKinsey, Google, and Goldman Sachs
First Name
Last Name
Email
Password
I agree to all
Terms & Privacy Policy
Thank you! Your submission has been received!
Oops! Something went wrong while submitting the form.
Have an account?
Sign in
Column Chart
Heatmap
Chevron
Org Chart
Infographic
Callouts
Timeline
List
Graphic
Picture
Process Flow
Diagram
Paragraph
Map
Table
Framework
Subtitle
Takeaway Box
Icon
Other Chart
Radar Chart
Waterfall Chart
Mekko Chart
Pie Chart
Scatter Plot
Line Chart
Bar chart
Bullet points