My Account
My Slides
Search by Category
Templates
Leave Feedback
Login
Logout
Get Started
Browse all Slides
Browse all Slides
Create a FREE Account
Instant access to 1,000+ real slides from top companies like McKinsey, BCG, Goldman Sachs, Google and many more!
First Name
Last Name
Email
Password
I agree to all
Terms & Privacy Policy
Thank you! Your submission has been received!
Oops! Something went wrong while submitting the form.
Have an account?
Sign in
Saved Slides
The slide features column charts with different color-coded bars representing total population, radio listeners, and podcast listeners. The chart measures consumer willingness to shop and make purchases.
Market Analysis and Trends
Media & Entertainment
The slide highlights that audio consumers are more willing to engage in various activities like shopping and travel post-pandemic. It compares the willingness of the total population with radio and podcast listeners.
Audio, consumers, recovery, shopping, travel, pandemic, willingness, market trends, Nielsen
Multiple Chart
Nielsen
Saved
With contrasting green column chart for deposits and blue for credit, the slide visually separates the concepts while including percentages and CAGR values.
Financial Performance
Financial Services
The slide showcases JPMorgan’s financial advisory performance, with a focus on deposit inflows and credit portfolio growth, emphasizing balanced financial advising.
financial advisory, deposits, credit, JPMorgan, CAGR, balance sheet, portfolio growth
Multiple Chart
JP Morgan
Saved
The slide includes a waterfall chart depicting changes in tangible book value per share (TBVPS) from 3Q22 to 4Q22.
Financial Performance
Financial Services
This slide explains the impact of the rights issue and net loss on TBVPS, detailing various contributing factors like FX and own credit.
TBVPS, rights issue, net loss, tangible book value, financial impact
Single Chart
Credit Suisse
Saved
Slide contains multiple column charts comparing consumer valuation of autonomous vehicles before and after COVID-19 across several countries. Each country is represented with a flag and percentage changes are shown in blue and black columns.
Market Analysis and Trends
Technology & Software
This slide analyzes the shift in consumer values regarding autonomous vehicles due to the COVID-19 pandemic, highlighting significant regional differences and the impact on technology and transportation industries.
COVID-19, autonomous vehicles, consumer behavior, market analysis, technology, transportation
Single Chart
McKinsey
Saved
Slide with complex column charts depicting Group NII development over several years, alongside key highlights on the right.
Financial Performance
Financial Services
Discusses predictions and strategies for stable net interest income in banking, highlighting impacts from hedge portfolios and deposit volumes.
NII, banking, hedge, deposit, revenue, forecasting, financial stability
Mixed Chart
Deutsche Bank
Saved
Dense text and graphics detailing 'Digital Twins' technology, its maturity, and applicability in industries, alongside sidebars for additional insights.
Technology and Digital Transformation
Technology & Software
Offers a deep dive into the technology of digital twins, explaining its functionality, benefits to companies, and industry applications. The slide also assesses the maturity and future development horizons of this technology.
Digital twins, technology analysis, industry application
Header Horizontal
McKinsey
Saved
Slide includes two column representations. The design is comprehensive with a systematic arrangement of sections, facilitating a clear understanding of complex processes.
Strategic Planning
Environmental Services & Sustainability
Discusses strategies to enhance the viability and scale of projects within the carbon trading sector, emphasizing regulatory improvements and market accessibility. It also highlights key actions for accelerating growth and development in the sector.
scalability, carbon trading, regulations, market access, strategic actions
Header Horizontal
Bain
Saved
Slide features multiple pie charts, and informational text. Predominant colors are blue and grey.
Market Analysis and Trends
Technology & Software
Discusses gaps in harnessing AI to optimize workforce, including leadership roles and investment in AI, contrasting organizations that are advancing in these areas with those that are not.
AI, workforce, leadership, investment, optimization
Multiple Chart
Deloitte
Saved
Circular layout representing a continuous process cycle.
Technology and Digital Transformation
Professional Services
Highlights Deloitte's approach to addressing workforce challenges with a three-part process: imagine, compose, activate.
Workforce, Solutions, Imagine, Compose, Activate
Diagram
Deloitte
Saved
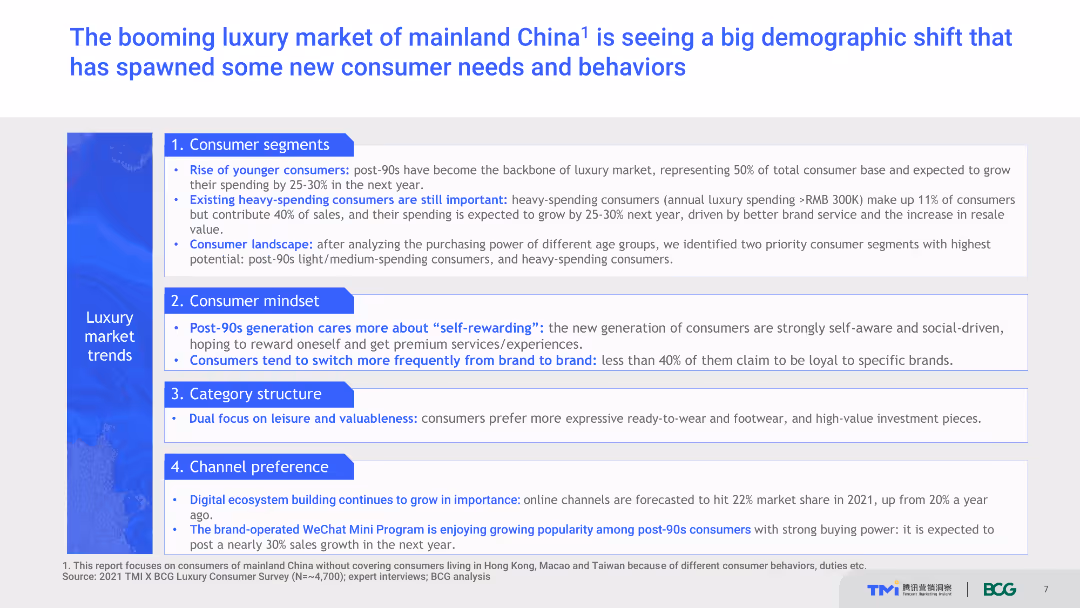
The slide lists consumer segments, mindset, category structure, and channel preference trends in the luxury market of mainland China.
Market Analysis and Trends
Retail & E-commerce
This slide discusses the demographic shifts and emerging trends in the luxury market of mainland China, highlighting new consumer needs and behaviors, particularly among post-90s generation and heavy-spending consumers.
Luxury market, China, consumer trends, demographic shift, spending behavior
Header Vertical
BCG
Saved
This slide features three sections comparing demographic characteristics of employees across different work profiles: Office Optimal, Hybrid Hopeful, Remote Ready.
Market Analysis and Trends
Professional Services
Provides analysis of key demographic characteristics influencing employee choices in different work environments, including office, hybrid, and remote work profiles.
Demographics, Work profiles, Office optimal, Hybrid hopeful, Remote ready
Multiple Chart
EY
Saved
The slide features a red and grey donut chart contrasting "Audio Only" and "Video-Enabled" podcast revenue shares for 2020, with large text highlighting the main statistic.
Market Analysis and Trends
Media & Entertainment
This slide presents the 2020 revenue share between audio-only and video-enabled podcasts, showing a significant majority in audio-only.
podcasts, revenue share, advertising, media, video-enabled, audio-only, 2020, comparison
Single Chart
PwC/Strategy&
Saved
Features a column chart comparing salaries across corporate levels between top corporates and startups, highlighting salary gaps
Human Resources and Talent Management
Technology & Software
Analyzes how salary structures at startups compare with larger corporations, particularly in attracting senior talent
startups, salaries, talent, corporate, HR
Single Chart
McKinsey
Saved
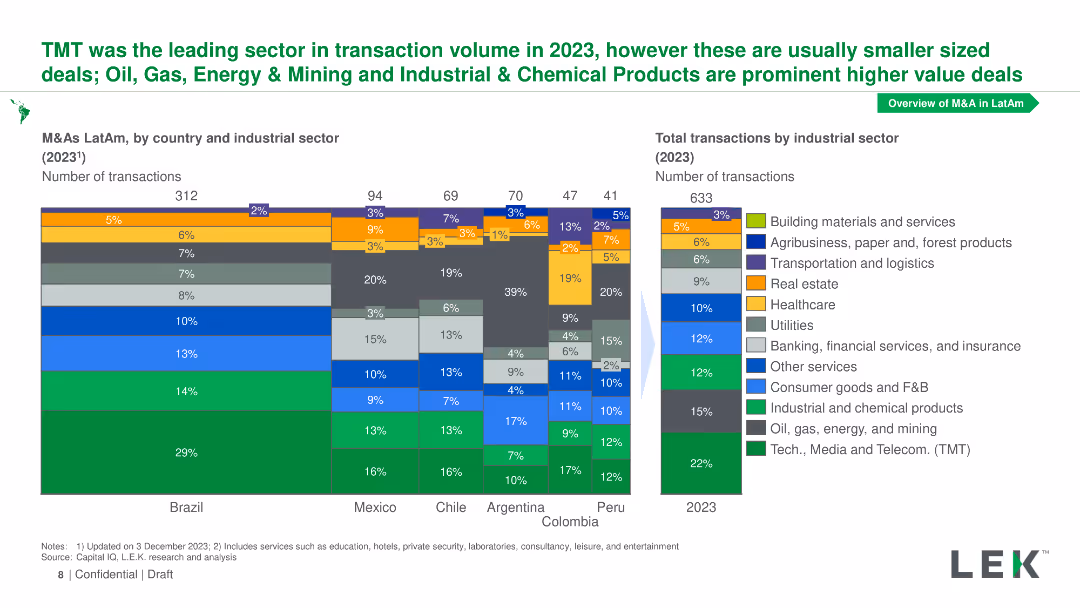
Stacked bar chart showing M&As by industrial sector for several Latin American countries in 2023, with a breakdown of sectors per country and total transactions.
Market Analysis and Trends
Financial Services
Shows M&A transaction volumes by industrial sector for Brazil, Mexico, Chile, Argentina, Peru, and Colombia, highlighting TMT as the leading sector in 2023.
M&As, industrial sector, Latin America, TMT, transaction volumes
Multiple Chart
LEK
Saved
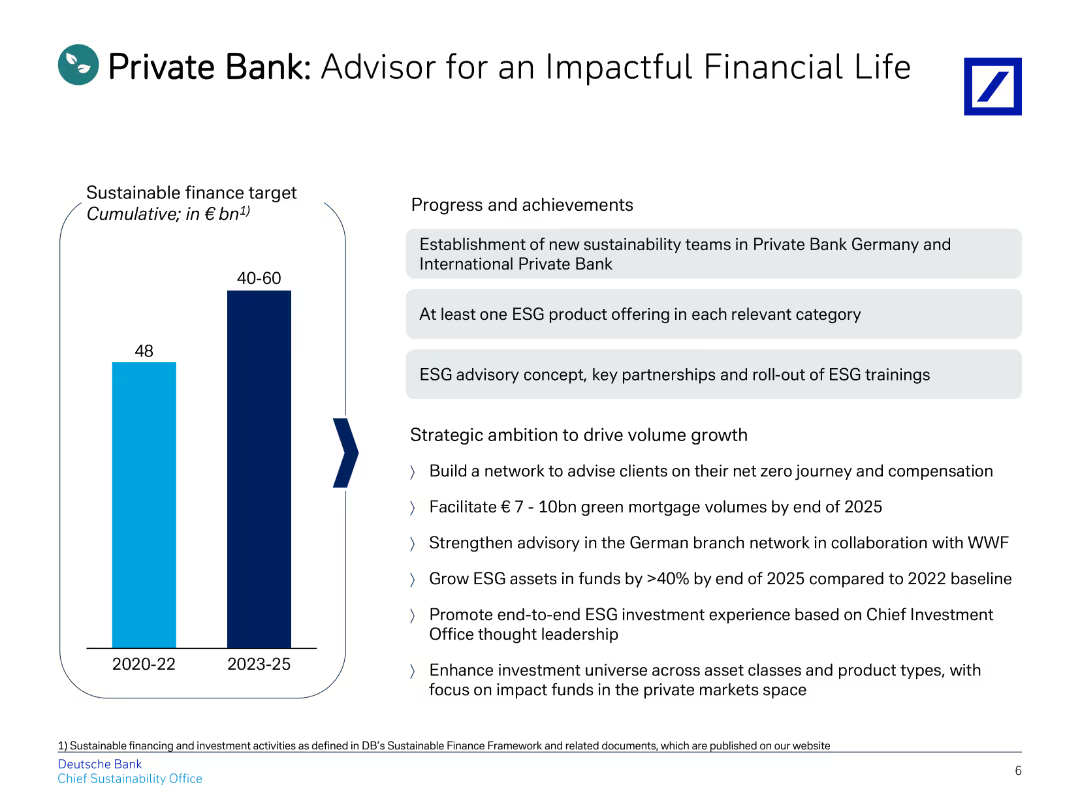
The slide includes a title, a vertical bar chart on the left, and bullet points on the right detailing progress and strategic goals.
Client Case Studies
Financial Services
Describes the progress and strategic ambitions of the Private Bank, emphasizing sustainable finance and ESG advisory services.
private, advisor, financial, ESG, impact
Mixed Chart
Deutsche Bank
Saved
Incorporates icons and split arrows to visualize proposed changes in tax regulations for 2018, focusing on manufacturing, economic zones, and individual tax brackets.
Regulatory and Compliance
Government & Public Sector
Details proposed tax amendments in Namibia and their expected revenue impacts, essential for stakeholders in policy-making and fiscal planning. The slide outlines changes aimed at enhancing revenue through adjustments in tax structures.
Tax, Amendments, Revenue, Policy, Law
Framework
PwC/Strategy&
Saved
A world map pinpointing locations with a legend indicating a $100bn alternatives net inflows target.
Investment Analysis
Financial Services
Outlines Goldman Sachs' aim to scale its alternative investment platform, with a global long-term target of $100 billion in net inflows.
Investment Platform, Global Targets, Net Inflows, Alternative Investments, Goldman Sachs
Graphic
Goldman Sachs
Saved
Multiple line charts display Y/Y growth in four hydraulic markets: Industrial Machinery, Construction Equipment, Farm Machinery, Truck & Bus from 2012 to 2019.
Market Analysis and Trends
Industrial & Manufacturing
Analyzes yearly growth rates across several hydraulic markets, showing trends over time, useful for market analysis and understanding sector health.
hydraulics, industrial, construction, machinery, growth
Single Chart
Deutsche Bank
Saved
The slide includes text and a pie chart showing the impact of returns charges on online shopping behavior, such as increased caution in purchasing and cessation of buying from certain brands.
Risk Assessment and Management
Retail & E-commerce
Examines the effects of returns charges on consumer behavior, highlighting how financial penalties influence shopping habits and the decision to purchase from specific brands.
Returns charges, Online shopping, Consumer behavior, Financial penalties, Brands
Mixed Chart
Roland Berger
Saved
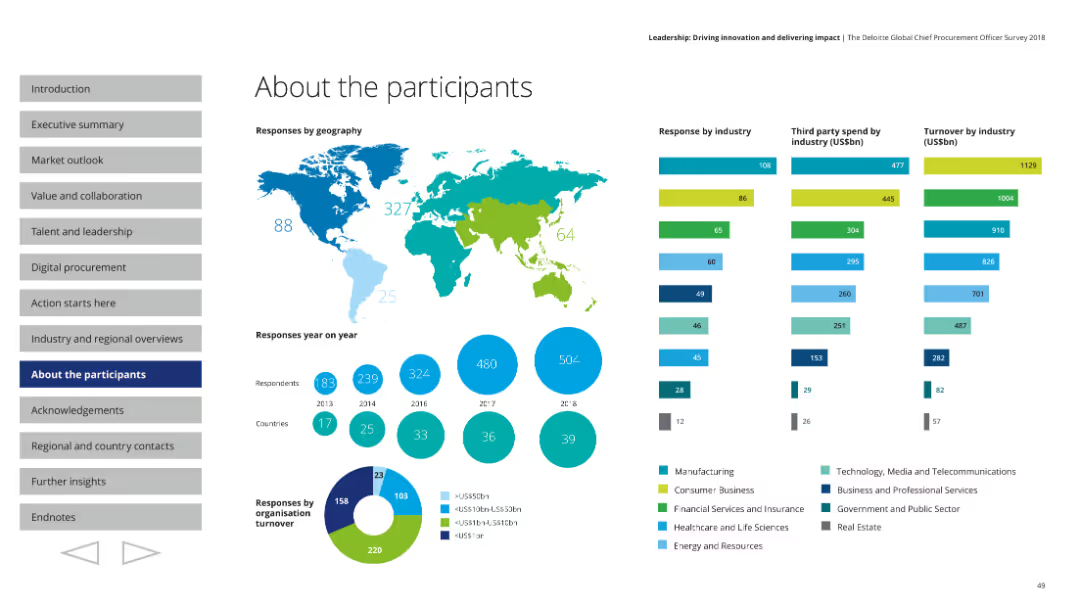
This slide contains various visual elements including a world map, column charts, pie charts, and segmented bars, with detailed information on participant demographics.
Market Analysis and Trends
Professional Services
The slide details the demographic breakdown of survey participants, including their geographic locations, industry sectors, and organizational turnover. It features visual data representations to illustrate responses by geography, industry, third-party spend, and turnover.
Participants, demographics, world map, industry sectors, survey data
Multiple Chart
Deloitte
Saved
This slide uses pie charts and text annotations to present the main barriers to digital adoption, focusing on ease of use, price, and product availability.
Strategic Planning
Technology & Software
Discusses the key barriers to digital adoption, emphasizing the need to improve ease of use, price, and product availability to unlock Indonesia's digital potential.
barriers, digital adoption, ease of use, price, product availability, Indonesia, strategy
Header Vertical
Kearney
Saved
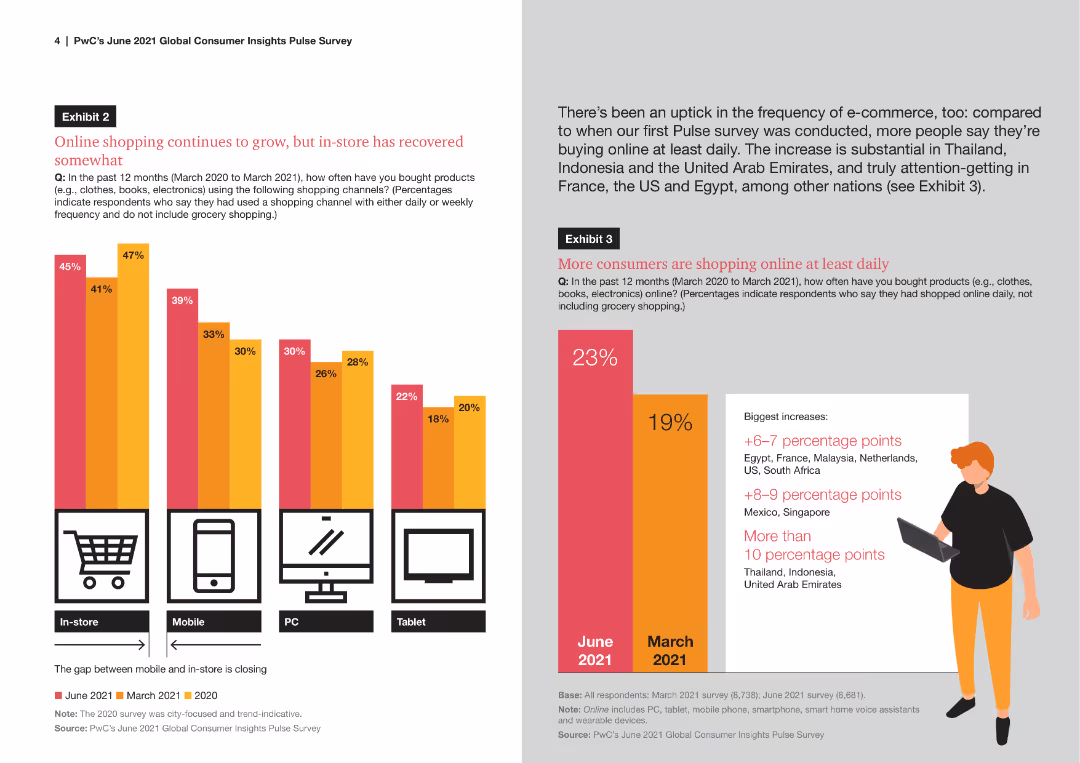
This slide features text and a column chart illustrating consumer behavior changes during the COVID-19 pandemic. The design is detailed yet organized.
Market Analysis and Trends
Consumer Goods
The slide discusses the impact of COVID-19 on consumer behavior, highlighting key trends such as increased online shopping and changes in purchasing habits.
consumer behavior, COVID-19, online shopping, purchasing habits, survey results, 2021 trends
Multiple Chart
PwC/Strategy&
Saved
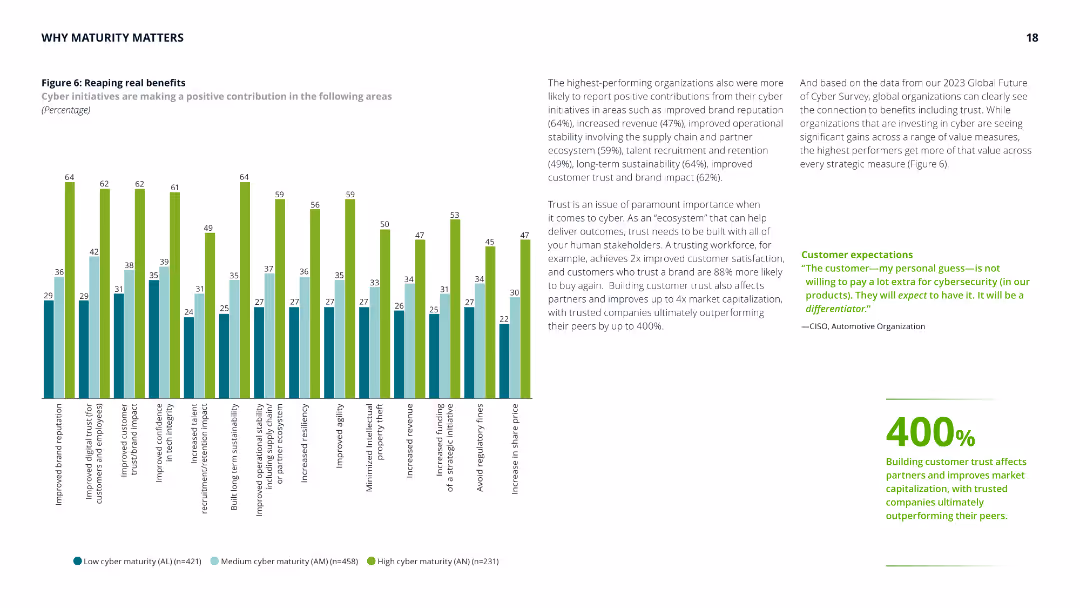
This slide contains a column chart with green and blue bars representing different maturity groups. Text on the right elaborates on the benefits of cyber initiatives.
Performance Metrics and KPIs
Technology & Software
Highlights the positive contributions of cyber initiatives, such as improved brand reputation and revenue, supported by survey data and commentary on trust and performance.
Cyber benefits, brand reputation, revenue, customer trust, performance
Mixed Chart
Deloitte
Saved
Column charts for revenue by reporting unit, bulleted lists, textual content
Financial Performance
Financial Services
Performance results for institutional clients, revenue and net income analysis
Institutional, Clients, Revenue, Column Chart, Performance, Financials
Mixed Chart
Citigroup
Saved
Features two line graphs overlapping, with one indicating the change in CEO confidence and the other showing projected and actual global GDP growth, accompanied by explanatory text.
Risk Assessment and Management
Financial Services
Details a regression analysis showing the predictive relationship between CEO confidence and GDP growth, implying a continued GDP decline in 2020.
CEO confidence, GDP growth, regression analysis, prediction, decline
Mixed Chart
PwC/Strategy&
Saved
Previous
Next
If nothing, comes up, please save your slides first
Create a FREE account to continue browsing
Receive Instant Access to 1,000+ slides from companies like McKinsey, Google, and Goldman Sachs
First Name
Last Name
Email
Password
I agree to all
Terms & Privacy Policy
Thank you! Your submission has been received!
Oops! Something went wrong while submitting the form.
Have an account?
Sign in
Column Chart
Heatmap
Chevron
Org Chart
Infographic
Callouts
Timeline
List
Graphic
Picture
Process Flow
Diagram
Paragraph
Map
Table
Framework
Subtitle
Takeaway Box
Icon
Other Chart
Radar Chart
Waterfall Chart
Mekko Chart
Pie Chart
Scatter Plot
Line Chart
Bar chart
Bullet points