My Account
My Slides
Search by Category
Templates
Leave Feedback
Login
Logout
Get Started
Browse all Slides
Browse all Slides
Create a FREE Account
Instant access to 1,000+ real slides from top companies like McKinsey, BCG, Goldman Sachs, Google and many more!
First Name
Last Name
Email
Password
I agree to all
Terms & Privacy Policy
Thank you! Your submission has been received!
Oops! Something went wrong while submitting the form.
Have an account?
Sign in
Saved Slides
This slide has moderate visual complexity with a mix of graphical elements and text. A timeline graph depicts the evolution of maintenance regimes with various icons representing different stages of sophistication. Colored blocks and arrows organize the information, and side text adds detailed explanations.
Technology and Digital Transformation
Industrial & Manufacturing
This slide discusses the increasing sophistication in asset maintenance, moving from basic, scheduled maintenance to more advanced predictive approaches based on asset health indicators. It outlines the evolution from reactive to proactive maintenance strategies, highlighting the benefits of adopting such advanced methodologies in asset management.
Predictive maintenance, Asset management, Maintenance evolution, Sophistication
Linear Flow
LEK
Saved
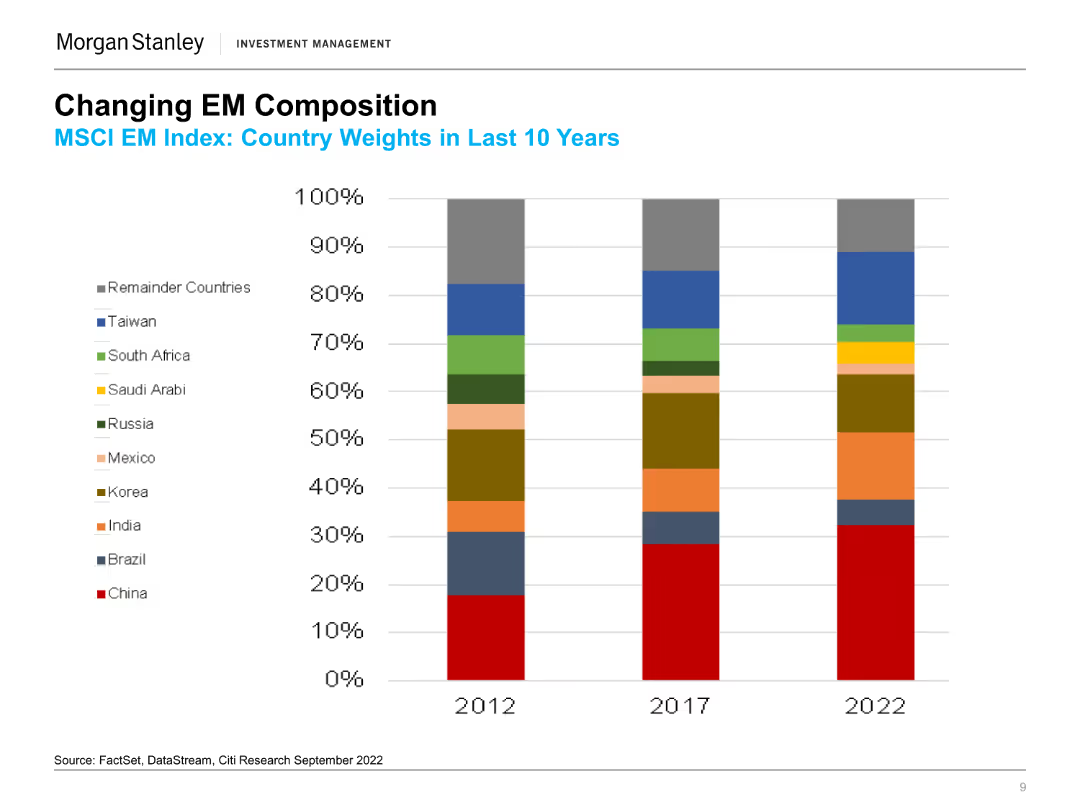
The slide features a stacked column chart comparing the country weights in the MSCI EM Index for the years 2012, 2017, and 2022, with various colors representing different countries.
Market Analysis and Trends
Financial Services
This slide examines how the country weights in the MSCI EM Index have evolved over the last 10 years, focusing on the proportion of different emerging markets.
MSCI, EM Index, Country Weights, China, India, Brazil, Market Trends, Country Comparison, Emerging Markets, Weight Distribution, Regional Analysis
Single Chart
Morgan Stanley
Saved
Slide contains a combination of graphs and lists detailing revenue enabled, growth rates, and data utilization across Europe.
Market Analysis and Trends
Technology & Software
Analyzes the economic benefits derived from satellite data by intermediate users in Europe, highlighting growth rates and revenue across different sectors.
Satellite data, revenue, growth rate, Europe, economic impact
Multiple Chart
PwC/Strategy&
Saved
Pie chart showing the allocation of training budgets across sectors with a clear "79% Yes" indication.
Human Resources and Talent Management
Education & Training
Highlights the allocation of annual budgets for formal training purposes across different sectors.
budget, training, allocation, sectors, annual
Multiple Chart
PwC/Strategy&
Saved
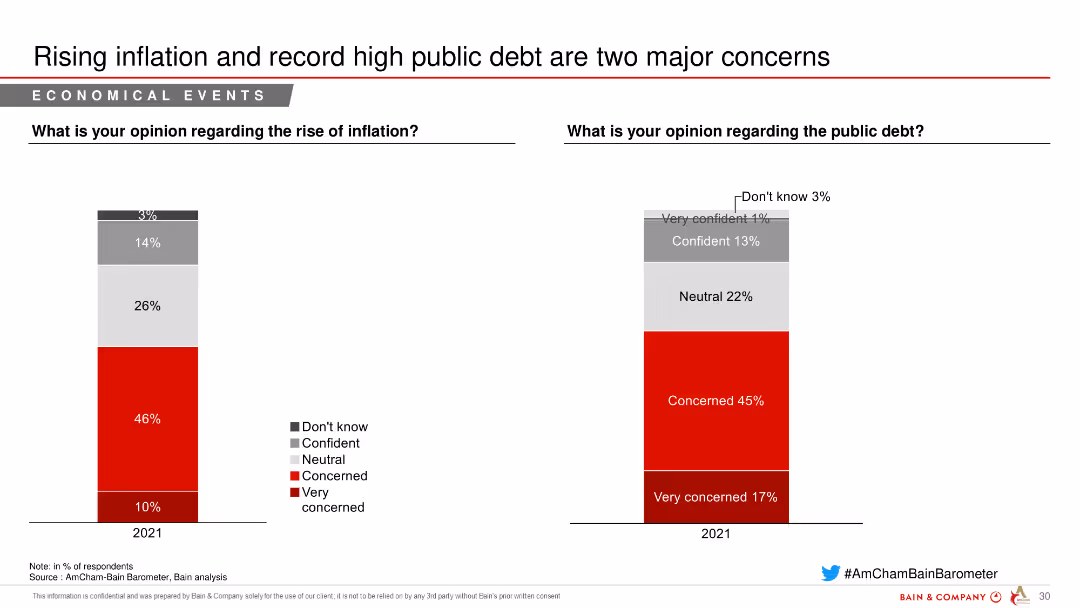
This slide includes column charts showing opinions on inflation and public debt, indicating levels of concern and confidence among respondents.
Risk Assessment and Management
Financial Services
The slide examines concerns about rising inflation and public debt, presenting respondents' opinions on these economic issues and highlighting the levels of concern and confidence.
inflation, public debt, concerns, confidence, economic issues, financial services, risk assessment
Multiple Chart
Bain
Saved
This slide juxtaposes graphical trends with textual imperatives, offering a visual and narrative guide on the concurrent management of the pandemic and economic implications. The design is straightforward with effective use of space.
Strategic Planning
Professional Services
It delineates the dual imperatives of managing the health crisis and safeguarding the economy, presenting a timeline that visually correlates the spread of the virus with economic trends, serving as a strategic guide for leaders.
Health Crisis, Economic Trends, Strategic Guide, Leadership, Pandemic Management, Timeboxing, Dual Imperatives, Graphical Representation
Mixed Chart
McKinsey
Saved
This slide is divided into two halves, one showing a column chart of healthcare expenditures, and the other showing pharmaceutical forecasts in column charts.
Financial Performance
Healthcare & Pharmaceuticals
Covers healthcare expenditures and pharmaceutical sales and exports, projecting growth and providing market insights for the Philippines.
healthcare, pharmaceuticals, expenditures, forecast, growth
Multiple Chart
Deloitte
Saved
Contains a column chart depicting levels of customer trust across different economic sectors, with a data table beneath summarizing the results. The chart is straightforward with a clear, color-coded categorization of ratings, complemented by a descriptive insights section that provides analysis on the data shown.
Client Case Studies
Professional Services
This slide offers an analysis of customer trust levels across various sectors, revealing high trust ratings for brands compared to industry averages. It's useful for case studies in marketing strategy, showcasing the effectiveness of brand management practices and consumer relationship strategies.
customer trust, brand management, marketing, industry comparison, insights
Mixed Chart
Deloitte
Saved
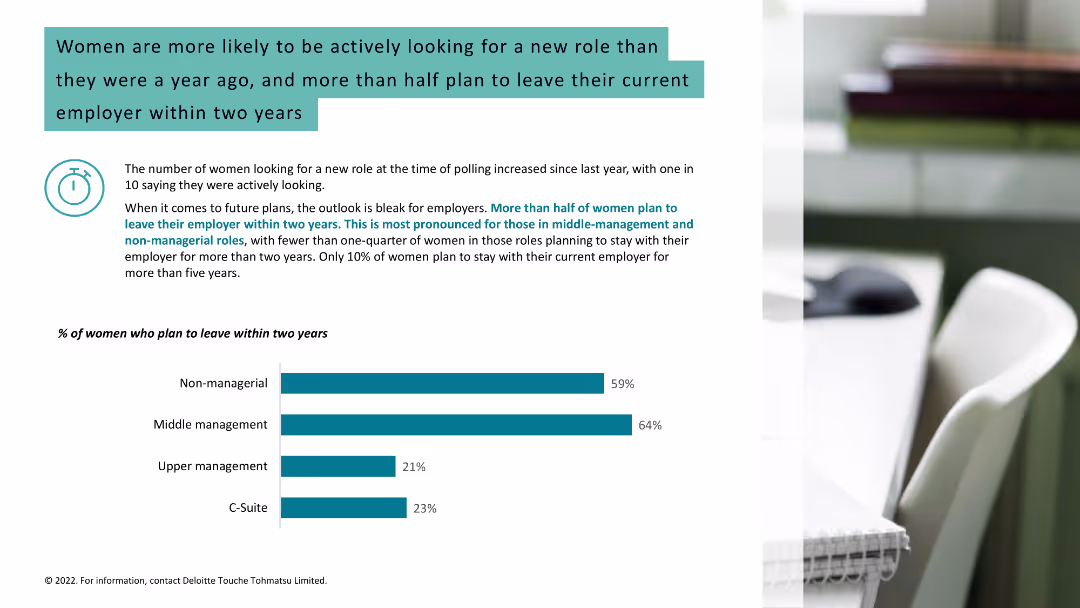
Light background with teal and black text. It features a column chart showing the percentage of women planning to leave their employer within two years, alongside a workspace image.
Human Resources and Talent Management
Healthcare & Pharmaceuticals
Highlights that more women are actively seeking new roles and planning to leave their employers within two years, with statistics on different management levels.
job search, women, career change, employer, workplace
Mixed Chart
Deloitte
Saved
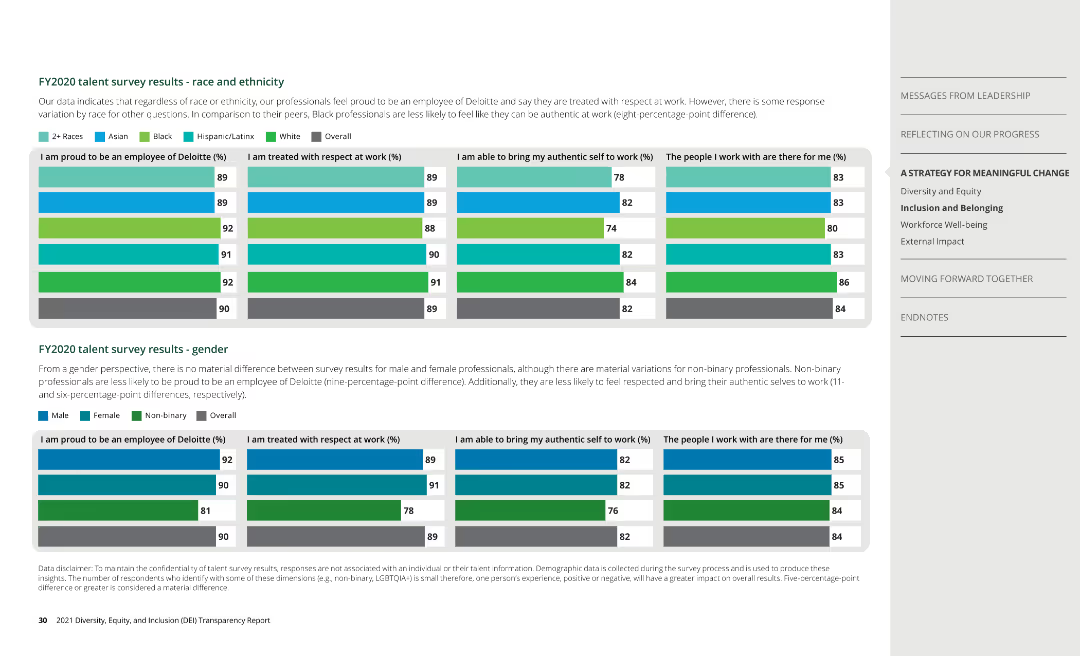
Column charts show survey results by race, ethnicity, and gender, covering aspects of employee experience at Deloitte.
Human Resources and Talent Management
Professional Services
Analyzes survey data on employee satisfaction, highlighting differences in experiences among diverse groups.
talent survey, employee experience, Deloitte
Multiple Chart
Deloitte
Saved
The slide includes a gradient purple background with three phases of AI evolution (Diagnostic, Predictive, Generative) represented in a timeline format. Icons and brief descriptions mark each phase, providing a visual and textual overview of AI's development through the years.
Technology and Digital Transformation
Technology & Software
Provides an overview of the phases of AI development, highlighting key characteristics and advancements in each phase.
AI, Technology, Evolution, Diagnostic, Predictive, Generative, Development, Phases, Software
Table
Accenture
Saved
Five icons with descriptions for leading countries' investments in frontier technologies. Countries include the US, EU, France, Germany, and China, with respective investment plans in technologies.
Technology and Digital Transformation
Technology & Software
The slide highlights significant investments in frontier technologies by leading countries, including the US, EU, France, Germany, and China. It showcases various initiatives, such as the US investment in EV infrastructure and China's commitment to AI and 5G development, emphasizing the centrality of technology to their economic strategies.
Investments, Frontier Technologies, Leading Countries
Pillar
Roland Berger
Saved
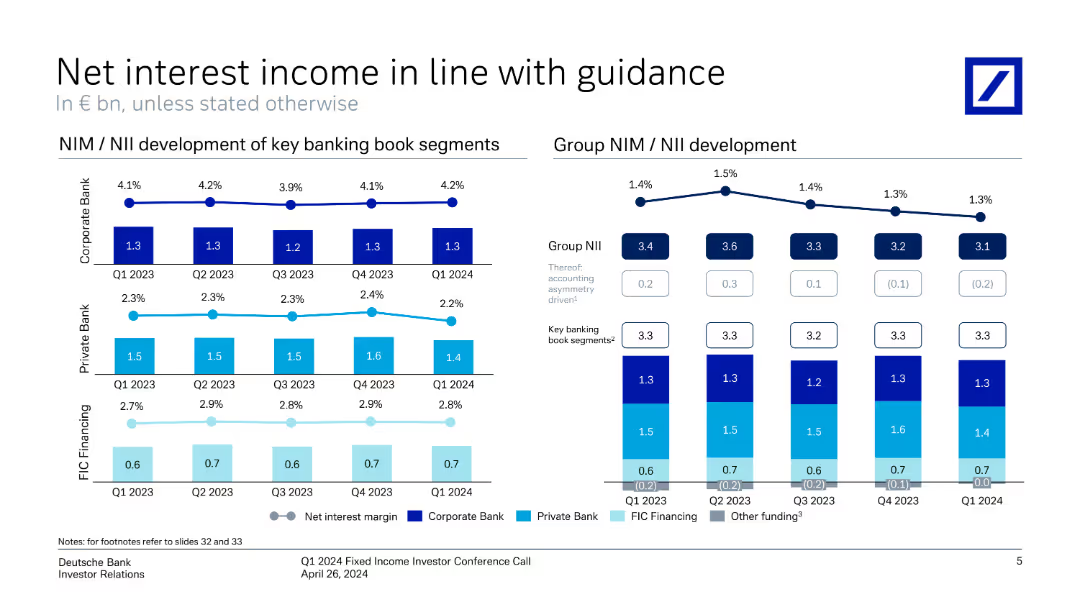
The slide features line charts and vertical column charts showing the development of net interest income and margins for different banking segments.
Financial Performance
Financial Services
The slide presents Deutsche Bank's net interest income and margin trends, showing alignment with guidance and segment performance from Q1 2023 to Q1 2024.
net interest income, financial guidance, banking segments, performance, Deutsche Bank, Q1 2024, investor relations, financial metrics, quarterly trends
Multiple Chart
Deutsche Bank
Saved
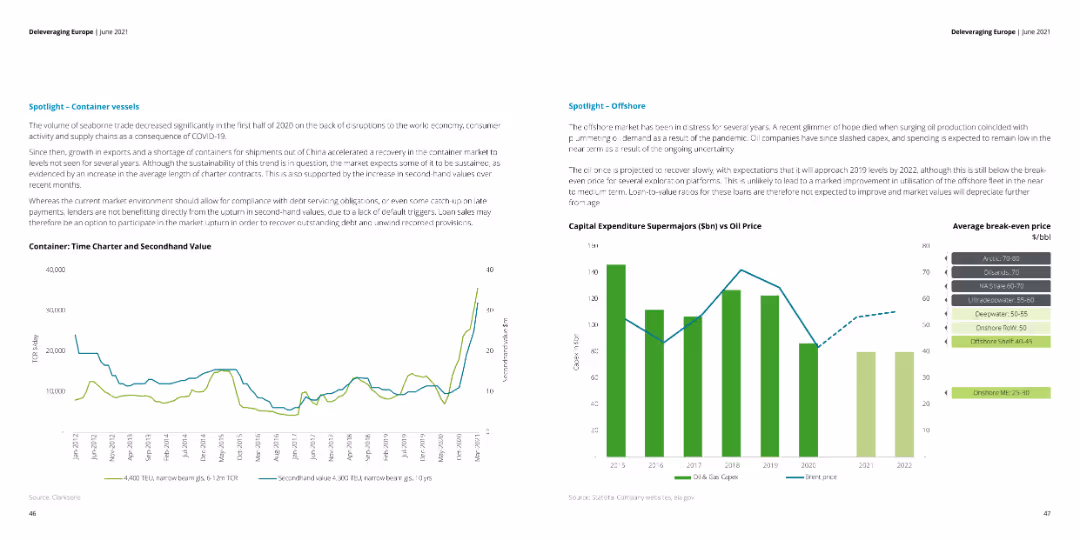
The slide contains two line charts: one for container vessel time charter and secondhand value, and another comparing capital expenditure for supermajors with oil prices.
Market Analysis and Trends
Transportation & Logistics
This slide examines the container vessel market and offshore industry trends, highlighting the recovery in container shipping and the impact of oil price fluctuations on capital expenditures for supermajors.
container vessels, offshore, oil prices, trends
Multiple Chart
Deloitte
Saved
Contains a stacked column chart showing market size by segment and a bulleted list on the left, with annotations and a footnote.
Industry Overview
Technology & Software
Summarizes the internet economy's expected growth in Southeast Asia by 2025, breaking down the market into ecommerce, travel, and online media segments with a focus on the significant share of ecommerce and travel in online retail spend.
Internet economy, SEA, market size, ecommerce, travel, online media
Single Chart
Bain
Saved
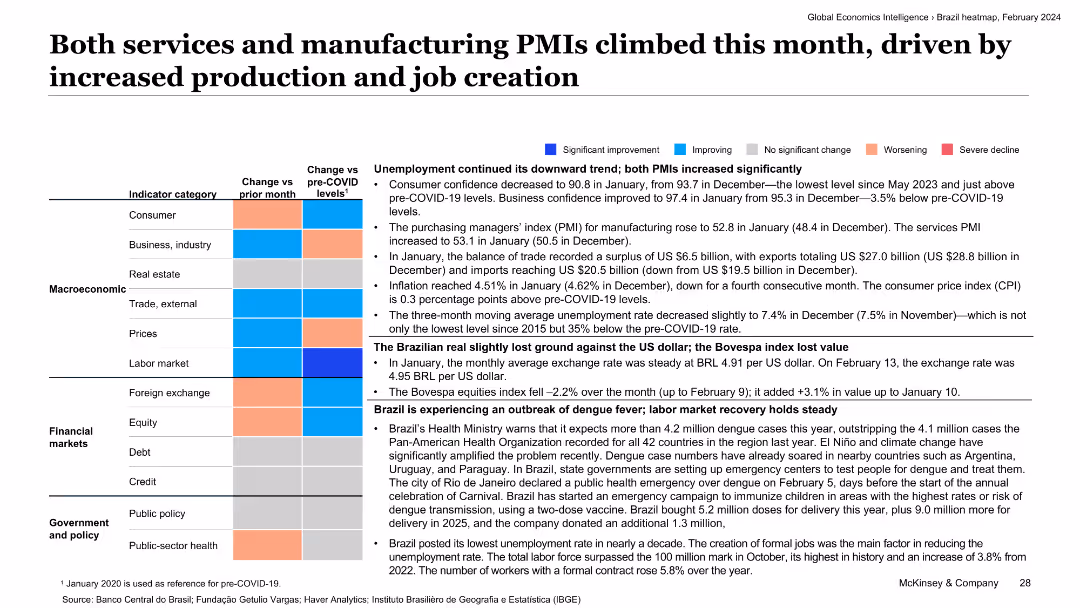
The slide features a detailed text-based analysis with color-coded economic indicators. It covers categories like consumer confidence, trade balance, inflation, and labor market in Brazil.
Market Analysis and Trends
Industrial & Manufacturing
This slide discusses the rise in both services and manufacturing PMIs, driven by increased production and job creation. It provides a comprehensive view of Brazil's economic activities and trends for the month.
services PMI, manufacturing PMI, consumer confidence, trade balance, job creation
Table
McKinsey
Saved
Features six circle icons representing countries, accompanied by text detailing sales figures, organic growth rates, and years of market presence.
Market Analysis and Trends
Consumer Goods
This slide provides a snapshot of Nestlé's longstanding market presence and sales performance in six major emerging markets. Useful for understanding geographical distribution of sales and historical market penetration.
market presence, sales, emerging markets, growth, Nestlé
Table
Deutsche Bank
Saved
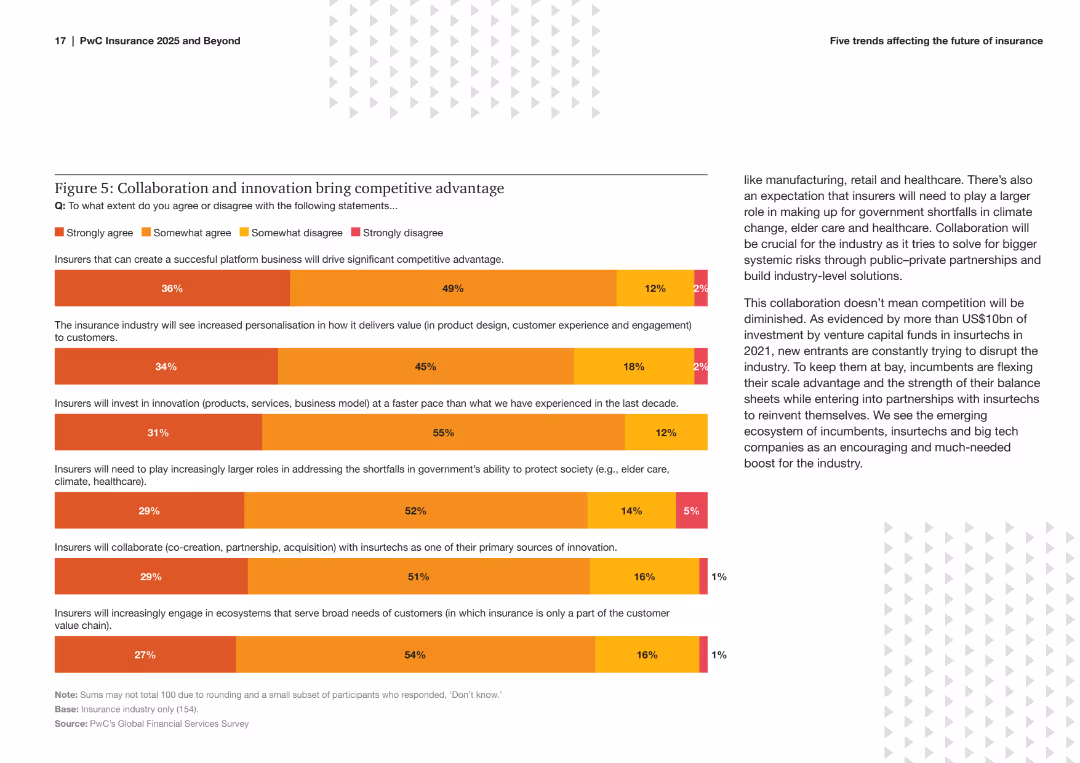
The slide includes a bar chart showing survey results on the extent to which insurers agree with statements about collaboration, innovation, and competitive advantage. It uses color coding to differentiate levels of agreement.
Strategic Planning
Financial Services
This slide highlights survey findings on the importance of collaboration and innovation in gaining competitive advantage within the insurance industry. It presents the percentage of respondents agreeing with various strategic statements.
Collaboration, Innovation, Competitive Advantage, Insurance, Survey, Strategic Planning, Bar Chart, Trends, Industry Insights, Analysis
Mixed Chart
PwC/Strategy&
Saved
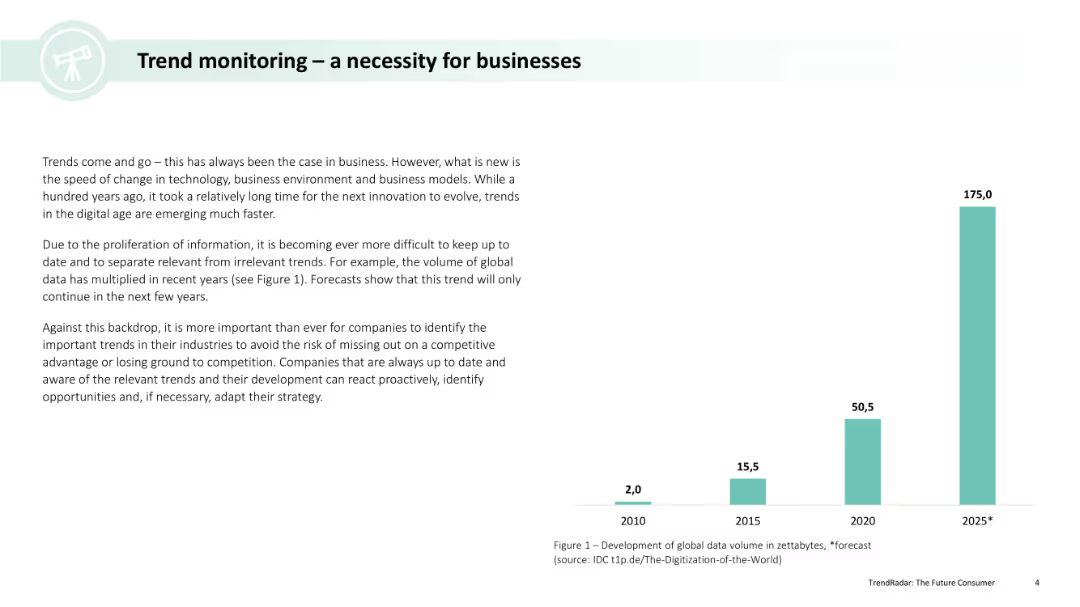
A vertical layout with a column chart showing the development of global data volume in zettabytes from 2010 to 2025. The slide includes a textual explanation of the importance of trend monitoring.
Market Analysis and Trends
Professional Services
This slide discusses the importance of trend monitoring for businesses, emphasizing the rapid increase in global data volume and the need for companies to stay updated with relevant trends to remain competitive.
Trend monitoring, business, data volume, column chart, trends
Mixed Chart
Deloitte
Saved
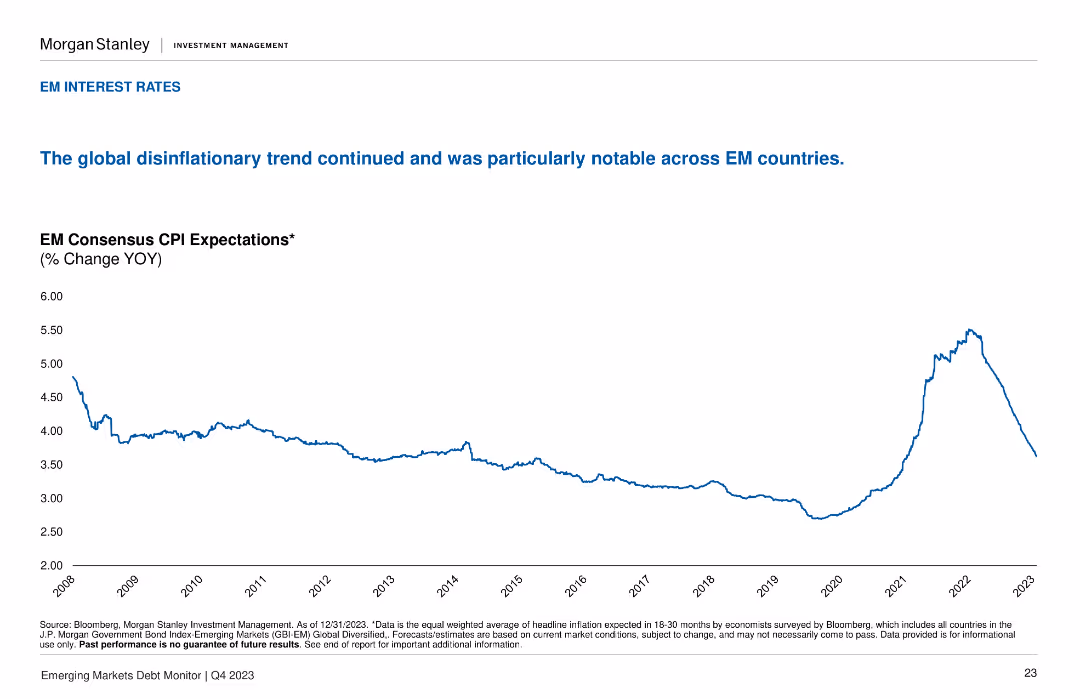
The slide presents a line chart showing EM consensus CPI expectations over time. The layout is simple and focused on the data trend.
Market Analysis and Trends
Financial Services
The slide highlights the ongoing disinflationary trend across emerging markets, with detailed data on CPI expectations and implications for interest rates.
interest rates, disinflation, CPI expectations, emerging markets, economic trends
Single Chart
Morgan Stanley
Saved
The slide has a title at the top, text in the middle, and a column chart at the bottom depicting changes in working situations or hours due to the pandemic.
Operational Efficiency
Professional Services
Provides data on changes in working situations due to the pandemic, with 43% reporting changes. Details include working from home, decrease/increase in hours, and furlough.
Working Situation, Pandemic, Survey, Work, Data
Mixed Chart
IPSOS
Saved
Images depicting industry applications of immersive tech, with short text descriptions underneath.
Technology and Digital Transformation
Technology & Software
Insights on how immersive reality could change operations within various industries, focusing on specific applications like AR for operational safety.
Immersive reality, industry operations, AR, VR, applications
Pillar
McKinsey
Saved
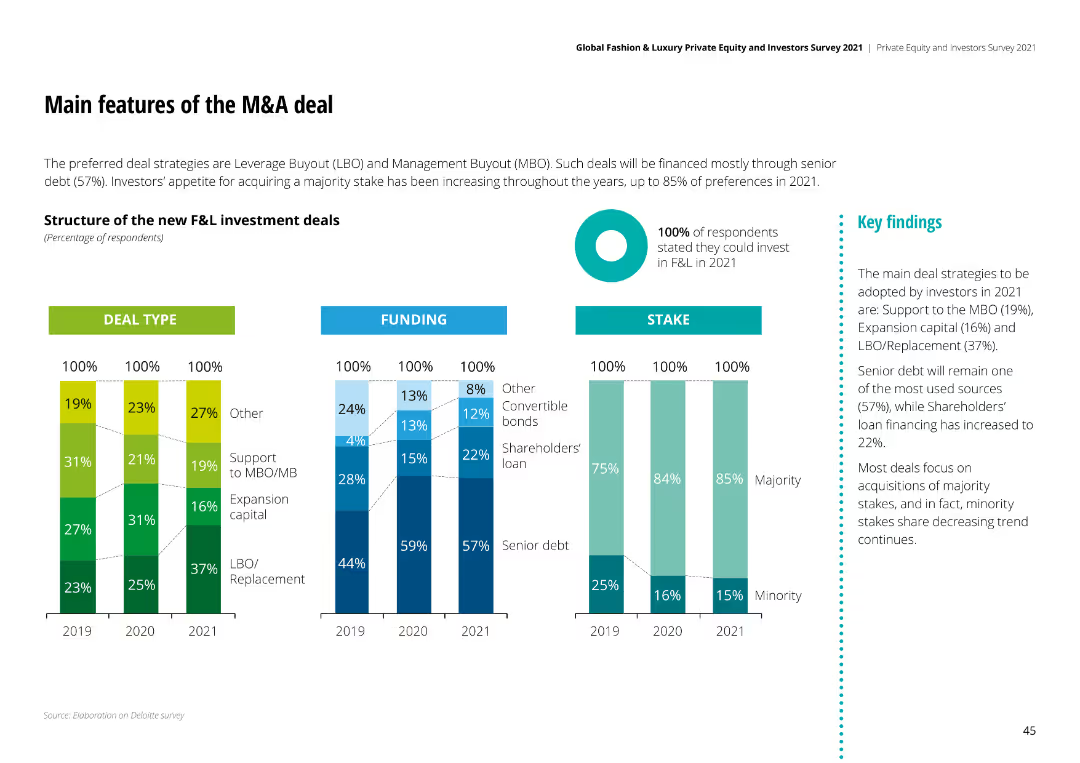
Column charts showing deal types, funding structures, and stake preferences for F&L investment deals, highlighting Leverage Buyouts and Management Buyouts.
Mergers and Acquisitions
Financial Services
Preferred deal strategies are Leverage Buyout (LBO) and Management Buyout (MBO), with senior debt being the primary funding source and majority stakes preferred.
M&A deals, investment strategies, funding structures, stake preferences, Leverage Buyouts
Multiple Chart
Deloitte
Saved
Line graph showing the yearly variance of NCDOT's cash balance from forecasts, marking a shift in FY19 with a detailed analysis of trends over time.
Regulatory and Compliance
Government & Public Sector
Analyzes the shift in cash balance variance for NCDOT in FY19, highlighting issues in fiscal management. Useful for government finance and policy analysis.
fiscal management, variance, government, NCDOT, trends
Single Chart
McKinsey
Saved
This slide features two column charts and text descriptions comparing year-over-year changes. The colors orange, blue, and grey dominate, with clear labels and percentage values.
Financial Performance
Transportation & Logistics
Discusses Faurecia's H1 2018 financial results, emphasizing sales growth, operating income, and performance across different business groups and regions. Useful for assessing financial trends and operational efficiency within the automotive sector.
Sales Growth, Operating Income, Automotive, Global, Profitability
Multiple Chart
Deutsche Bank
Saved
Previous
Next
If nothing, comes up, please save your slides first
Create a FREE account to continue browsing
Receive Instant Access to 1,000+ slides from companies like McKinsey, Google, and Goldman Sachs
First Name
Last Name
Email
Password
I agree to all
Terms & Privacy Policy
Thank you! Your submission has been received!
Oops! Something went wrong while submitting the form.
Have an account?
Sign in
Column Chart
Heatmap
Chevron
Org Chart
Infographic
Callouts
Timeline
List
Graphic
Picture
Process Flow
Diagram
Paragraph
Map
Table
Framework
Subtitle
Takeaway Box
Icon
Other Chart
Radar Chart
Waterfall Chart
Mekko Chart
Pie Chart
Scatter Plot
Line Chart
Bar chart
Bullet points