My Account
My Slides
Search by Category
Templates
Leave Feedback
Login
Logout
Get Started
Browse all Slides
Browse all Slides
Create a FREE Account
Instant access to 1,000+ real slides from top companies like McKinsey, BCG, Goldman Sachs, Google and many more!
First Name
Last Name
Email
Password
I agree to all
Terms & Privacy Policy
Thank you! Your submission has been received!
Oops! Something went wrong while submitting the form.
Have an account?
Sign in
Saved Slides
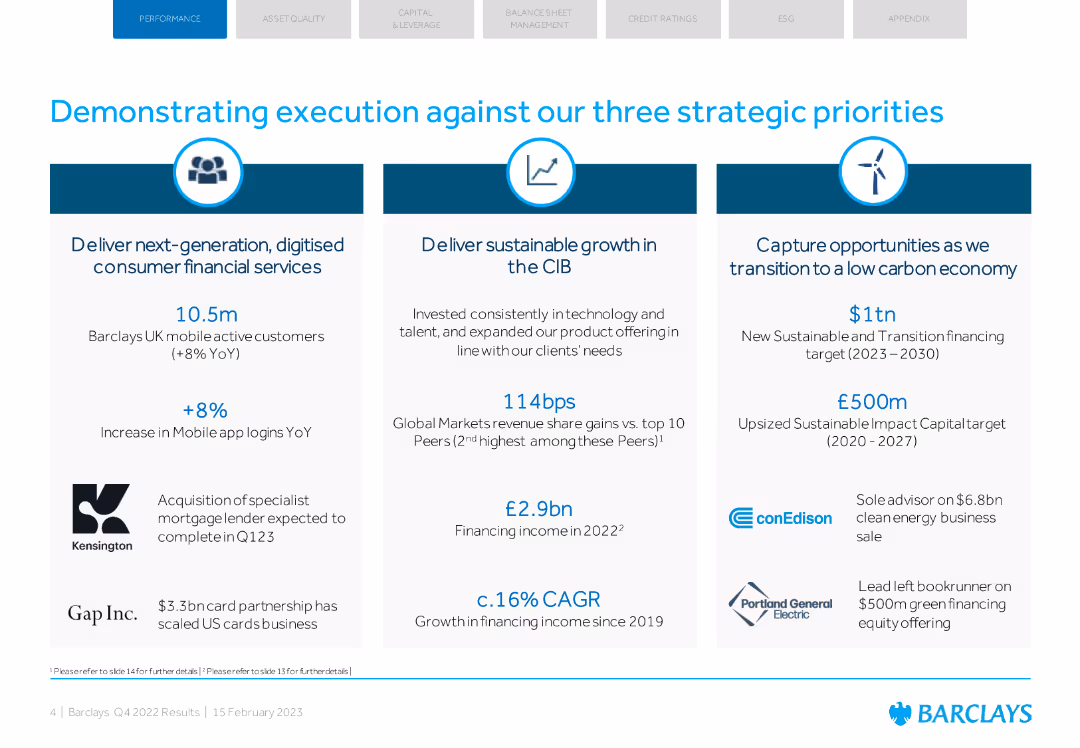
The slide is divided into three sections, each outlining a strategic priority with bullet points and supporting icons. The layout is clean with a blue and white color scheme.
Strategic Planning
Financial Services
This slide explains Barclays' strategic priorities: digitized consumer financial services, sustainable growth in CIB, and transitioning to a low carbon economy.
strategic priorities, execution, growth, financial services, Barclays
Pillar
Barclays
Saved
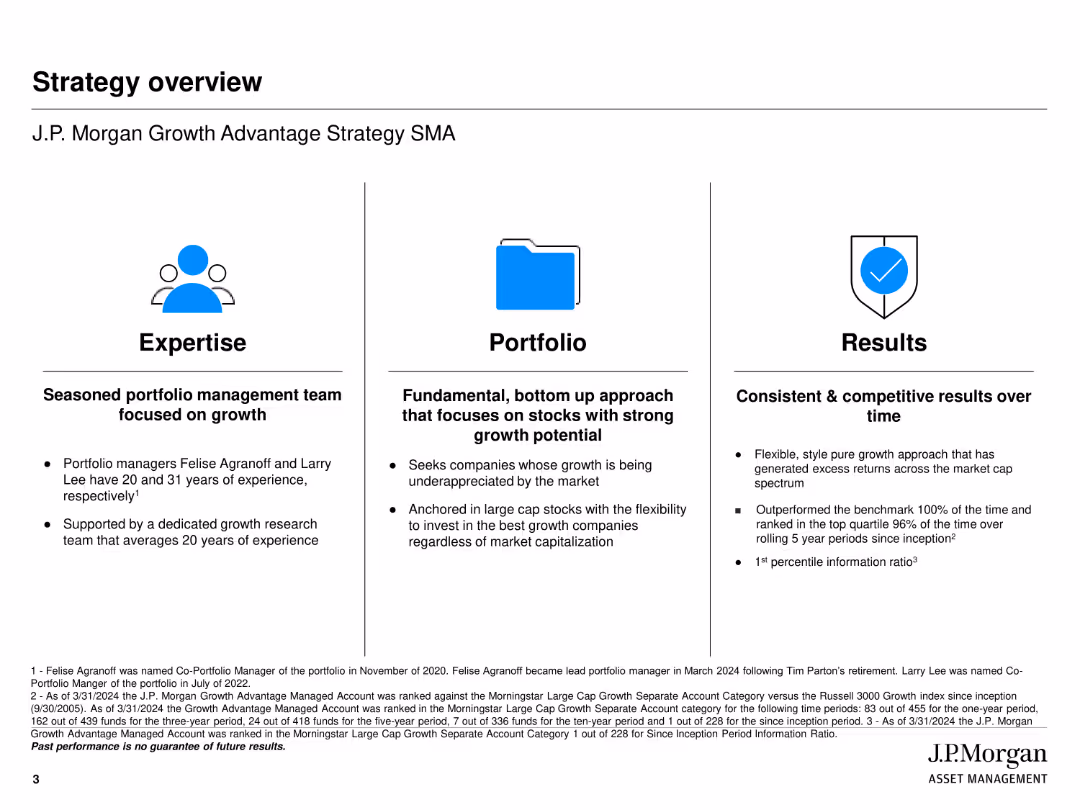
The slide is divided into three sections: Expertise, Portfolio, and Results. Each section includes icons and brief descriptions of the investment team's focus, strategy, and performance.
Strategic Planning
Financial Services
Provides an overview of J.P. Morgan's Growth Advantage Strategy, detailing the expertise of the management team, the portfolio's approach, and the results achieved over time.
strategy, growth, portfolio, expertise, results
Pillar
JP Morgan
Saved
The slide features a bar chart on the left depicting the ratio of companies with net cash by region, and a line chart on the right showing return on equity over time for different regions. The charts use color coding to differentiate between regions.
Regulatory and Compliance
Financial Services
This slide discusses corporate governance by illustrating the ratio of companies with net cash and their return on equity across different regions. It is useful for understanding financial health and governance standards in various markets.
Corporate governance, net cash, return on equity, financial health, Europe, U.S., Korea, Japan
Multiple Chart
JP Morgan
Saved
Features column charts displaying hypothetical shifts in net interest income due to changes in the yield curve.
Risk Assessment and Management
Financial Services
This analytical slide explores the sensitivity of net interest income to changes in interest rates, presenting data projections up to 2026. It's designed for financial risk managers and analysts to assess the potential impact of interest rate fluctuations on the bank's earnings, aiding in strategic financial planning and risk mitigation efforts.
Interest Rates, Financial Risk, Projections, Banking, Sensitivity Analysis
Multiple Chart
Deutsche Bank
Saved
Contains bullet points explaining industry-wide solvency ratios for Mexico, a table with top 10 Mexican life insurers' data, and column charts showing ratios.
Market Analysis and Trends
Financial Services
This slide analyzes the solvency ratios of Mexican life insurers, highlighting data inconsistencies, volatility, and proposing a subset for company data inclusion.
Mexico, solvency ratios, insurers, analysis, company data, financial services, market trends
Mixed Chart
Oliver Wyman
Saved
Features bar charts and diagrams related to grid optimization and energy aggregation technologies, including real-time data platforms.
Technology and Digital Transformation
Energy & Utilities
Analyzes how digital solutions like real-time load balancing and energy aggregation can enhance grid efficiency and resilience.
grid optimization, energy aggregation, digital solutions, real-time balancing, electricity grid, efficiency, resilience
Mixed Chart
Accenture
Saved
An advanced slide that features four sets of line graphs depicting total net charge-offs and non-performing loans, complemented by text summaries on the right-hand side. The graphs are detailed, using blue tones to represent different data points over time. The right side of the slide provides bullet points highlighting key actions taken since the financial crisis to improve credit profile.
Risk Assessment and Management
Financial Services
This slide aims to demonstrate the significant improvements in the company's credit profile, featuring historical data on net charge-offs and non-performing loans, as well as selected actions taken since the financial crisis. The goal is to show effective risk management and financial stability to stakeholders.
Credit Profile, Risk Management, Net Charge-Offs, Non-Performing Loans, Financial Stability, Strategic Actions, Financial Crisis
Multiple Chart
Morgan Stanley
Saved
Features a complex set of tables and column chart detailing financial results for asset management. Graphs and tables are arranged for a comparative analysis of management fees, investments, and net revenues. Graphs are in blue and purple.
Financial Performance
Financial Services
Details financial performance in asset management, including management fees and investment results. It's suitable for financial analysts or investors looking at asset management efficiency and revenue generation capabilities.
Asset Management, Fees, Investments, Net Revenue
Mixed Chart
Goldman Sachs
Saved
The slide contains two charts: a bar chart showing the price-to-earnings ratios for various Latin American countries and a line chart depicting earnings per share (EPS) trends. The charts use multiple colors for different countries and time periods.
Market Analysis and Trends
Financial Services
It compares valuations and earnings across Latin American countries, providing insights into market performance and potential investment opportunities in these regions.
Latin America, valuations, earnings, price-to-earnings, EPS
Multiple Chart
JP Morgan
Saved
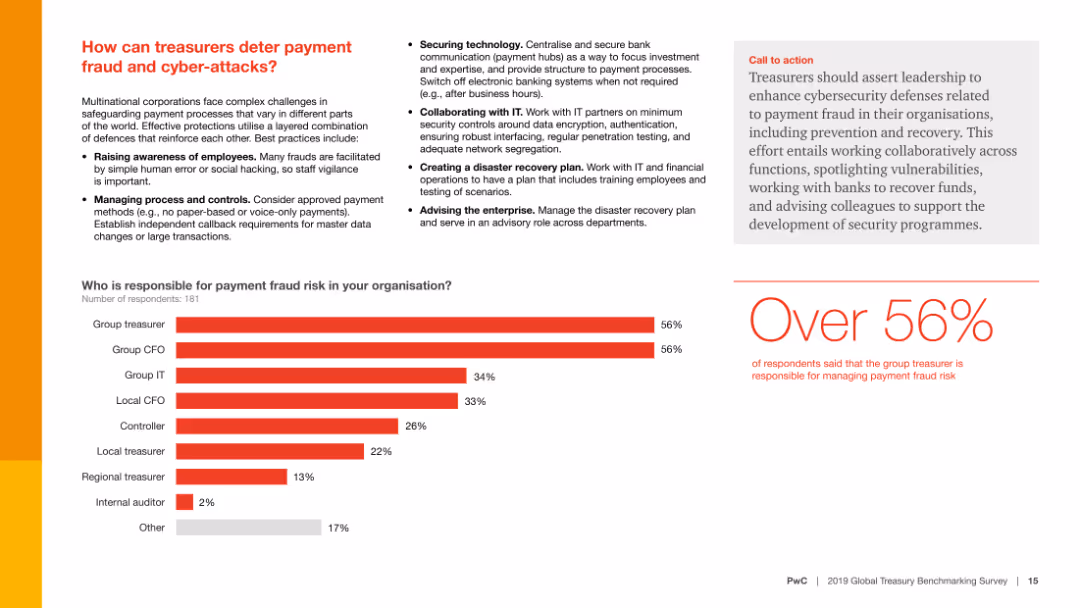
Contains text, a column chart, and a call-to-action section. The column chart shows who is responsible for managing payment fraud risk.
Risk Assessment and Management
Financial Services
This slide presents strategies for preventing payment fraud and cyber-attacks and identifies who within an organization is responsible for managing these risks.
Fraud prevention, cyber-attacks, risk management, survey, responsibility
Mixed Chart
PwC/Strategy&
Saved
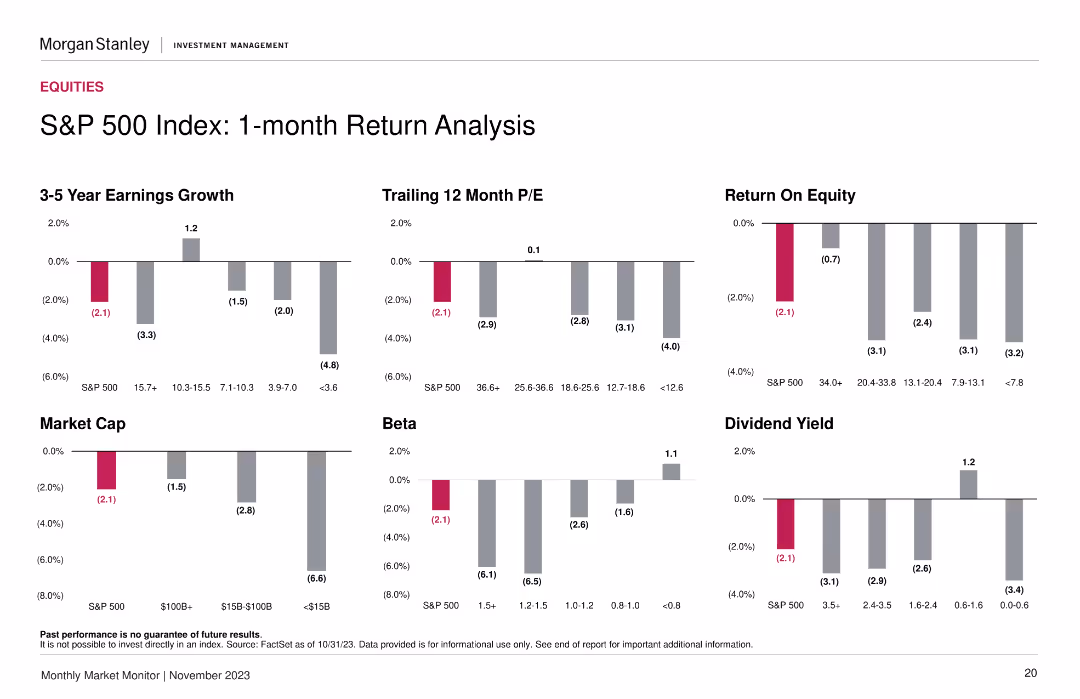
The slide contains six column charts detailing the S&P 500 index's 1-month returns in areas such as earnings growth, P/E ratio, ROE, market cap, beta, and dividend yield.
Performance Metrics and KPIs
Financial Services
This slide provides a 1-month return analysis of the S&P 500 index, breaking down performance in various financial metrics such as earnings growth, P/E ratio, and dividend yield.
S&P 500, return analysis, earnings growth, P/E ratio, financial metrics
Multiple Chart
Morgan Stanley
Saved
A split design with infographics and key statistics.
Technology and Digital Transformation
Professional Services
The slide presents a comparative analysis of how technology is changing work practices and the implications for organizations.
Future of Work, Technology, Organizations, Change, Comparative Analysis
Framework
Deloitte
Saved
Slide with circular icons and bullet points, contrasting significant and limited progress in key areas.
Market Analysis and Trends
Technology & Software
Analyzes factors driving the Internet economy's momentum, with an emphasis on talent as a critical element.
momentum, drivers, Internet economy, talent, funding, logistics, SEA
Header Vertical
Bain
Saved
Features title, multiple bar charts showing potential impacts of digital initiatives in Denmark with values for "Total Value at Stake" and "Trapped Value".
Investment Analysis
Technology & Software
Highlights specific digital initiatives in Denmark and their economic impact, focusing on sectors like e-commerce, connected travel, and assisted driving.
Denmark, digital initiatives, economic impact, e-commerce, connected travel
Mixed Chart
Accenture
Saved
The slide features two bar charts comparing loan and deposit figures across multiple quarters.
Financial Performance
Financial Services
Examines year-on-year and quarter-on-quarter changes in loan and deposit volumes within the bank's various divisions, providing insights into lending trends and deposit fluctuations.
loan development, deposit growth, banking, trends
Multiple Chart
Deutsche Bank
Saved
Contains bar charts and a narrative section. The charts illustrate media coverage trends focusing on AI-related topics like job displacement and privacy, using different shades of purple to represent varying amounts of media mentions over time.
Technology and Digital Transformation
Technology & Software
Discusses shifts in public and media focus regarding AI, from job displacement concerns to privacy and job creation opportunities.
AI, Media, Job Displacement, Privacy, Trust, Public Perception, Coverage, Trends, Technology
Multiple Chart
Accenture
Saved
Contains bullet point lists in three content blocks, color-coded to differentiate between maintaining discipline, optimizing current models, and transforming for the future.
Strategic Planning
Financial Services
This slide outlines the strategic initiatives for growth in the financial services sector, including maintaining operational discipline, optimizing the current business model, and investing in future transformations such as ML & AI.
growth, strategy, optimization, financial, discipline, AI, ML
Boxed
JP Morgan
Saved
Moderate visual complexity, this slide contains text blocks and icons representing various megatrends affecting the process industries. The design is organized to facilitate easy reading and identification of each megatrend and its impact.
Technology and Digital Transformation
Industrial & Manufacturing
The slide discusses the major global megatrends impacting process industries and the challenges they pose. It outlines the areas such as environmental sustainability and health & safety where these industries need to adapt and innovate, offering a strategic perspective on navigating these shifts.
Megatrends, Process industries, Environmental sustainability, Safety
Header Vertical
LEK
Saved
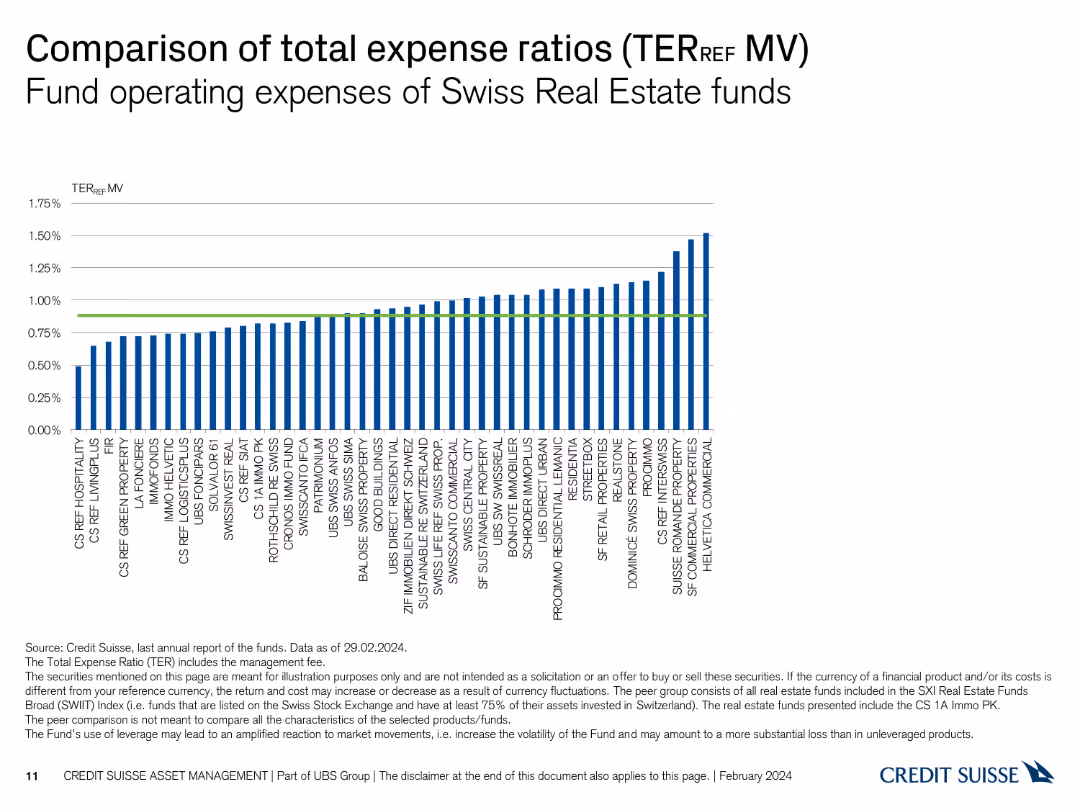
This slide features a column chart displaying the total expense ratios of various Swiss Real Estate funds. The chart uses vertical bars to represent each fund's TER_REF.
Financial Performance
Financial Services
The slide compares the operating expenses of different Swiss Real Estate funds, illustrating their total expense ratios. It helps in analyzing and comparing fund expenses.
expense ratios, Swiss Real Estate, funds, TER_REF, operating expenses
Single Chart
Credit Suisse
Saved
Two donut charts showing the distribution of podcast campaign types by revenue in 2015 and 2016, with a shift towards brand awareness and the emergence of branded content.
Market Analysis and Trends
Media & Entertainment
Discusses the evolution of revenue-generating campaign types in podcasting, highlighting shifts towards brand awareness and branded content. Key for strategic discussions on content and advertising models in media.
podcast, campaign types, revenue, media
Multiple Chart
PwC/Strategy&
Saved
Contains a line graph comparing generational spending, and a column chart showing the growth of new accounts. The visual elements are clearly labeled and contrasted by colors.
Market Analysis and Trends
Financial Services
Focuses on credit card spending across generations and acquisition growth. Useful in marketing strategy or generational market analysis discussions.
generational spending, market acquisition, credit cards, Millennials, Gen Z
Multiple Chart
JP Morgan
Saved
Three-column layout with headings: Corporates, Investors, Government. Each column lists action items with icons and text, over a starry night background.
Strategic Planning
Environmental Services & Sustainability
The slide outlines specific actions for corporates, investors, and government to support ecosystem participants in achieving climate goals.
Action items, Climate tech, Corporates, Investors, Government
Pillar
BCG
Saved
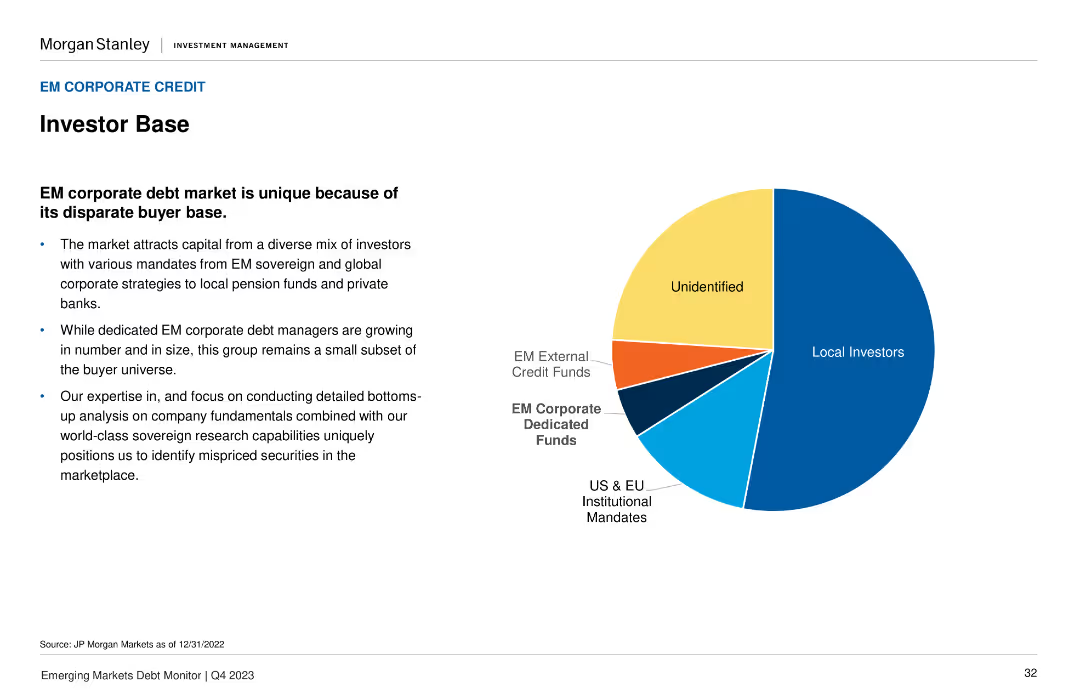
The slide features a pie chart displaying the composition of the EM corporate debt market investor base, with segments for Local Investors, US & EU Institutional, and others.
Market Analysis and Trends
Financial Services
It describes the diverse mix of investors in the EM corporate debt market and emphasizes the unique buyer base. Useful for understanding the investor landscape in emerging markets.
investor base, corporate debt, EM, market composition, analysis
Mixed Chart
Morgan Stanley
Saved
The slide uses column charts to present fundraising and fee trends, with additional information on specific funds.
Investment Analysis
Financial Services
Showcases the robust performance of alternative investments and their contribution to asset under supervision growth, with data on fundraising and fee generation, highlighting recent successful fund closures.
alternatives, investment performance, fundraising, fees, growth
Multiple Chart
Goldman Sachs
Saved
This slide is populated with a series of flow diagrams and small graphs detailing the distribution of solar radiation on Earth, showing how much energy is absorbed by land, oceans, and the atmosphere.
Market Analysis and Trends
Energy & Utilities
Explores the distribution of solar energy on Earth and its potential to meet global energy demands. The slide emphasizes the significant surplus of solar energy available compared to current fossil fuel consumption, underlining the importance of solar energy in future energy strategies.
solar energy, distribution, consumption, Earth, potential
Diagram
Roland Berger
Saved
Previous
Next
If nothing, comes up, please save your slides first
Create a FREE account to continue browsing
Receive Instant Access to 1,000+ slides from companies like McKinsey, Google, and Goldman Sachs
First Name
Last Name
Email
Password
I agree to all
Terms & Privacy Policy
Thank you! Your submission has been received!
Oops! Something went wrong while submitting the form.
Have an account?
Sign in
Column Chart
Heatmap
Chevron
Org Chart
Infographic
Callouts
Timeline
List
Graphic
Picture
Process Flow
Diagram
Paragraph
Map
Table
Framework
Subtitle
Takeaway Box
Icon
Other Chart
Radar Chart
Waterfall Chart
Mekko Chart
Pie Chart
Scatter Plot
Line Chart
Bar chart
Bullet points