My Account
My Slides
Search by Category
Templates
Leave Feedback
Login
Logout
Get Started
Browse all Slides
Browse all Slides
Create a FREE Account
Instant access to 1,000+ real slides from top companies like McKinsey, BCG, Goldman Sachs, Google and many more!
First Name
Last Name
Email
Password
I agree to all
Terms & Privacy Policy
Thank you! Your submission has been received!
Oops! Something went wrong while submitting the form.
Have an account?
Sign in
Saved Slides
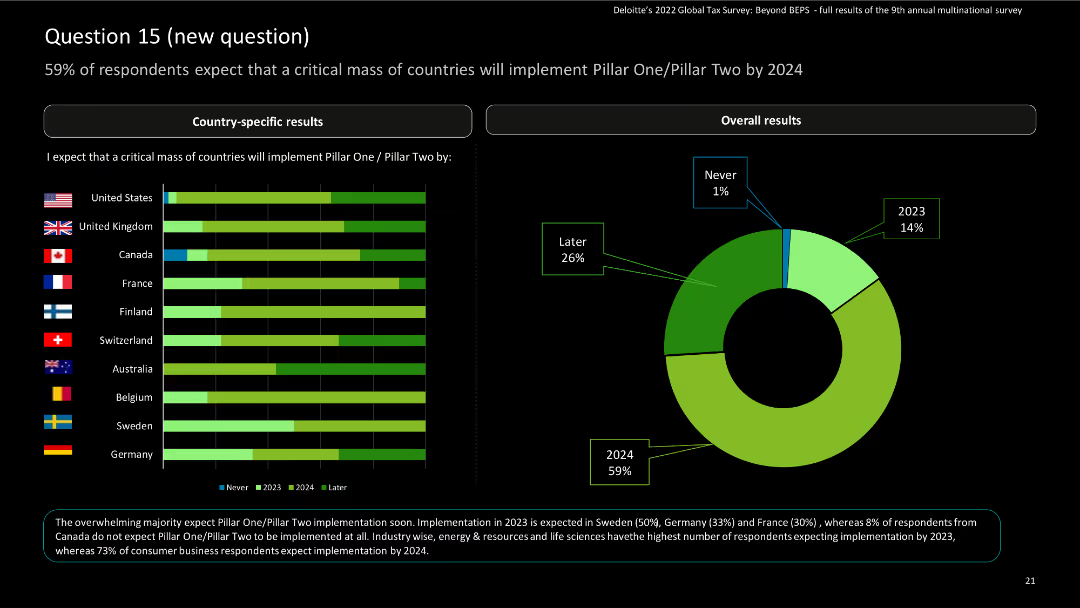
This slide includes horizontal bar charts for country-specific results and a donut chart for overall results, showing implementation expectations.
Risk Assessment and Management
Financial Services
The slide presents survey responses on the expected implementation of Pillar One/Pillar Two by 2024, with country-specific and overall data. It highlights percentages and timeline expectations.
Pillar One, Pillar Two, implementation, survey, financial services
Multiple Chart
Deloitte
Saved
Features a central image of a human figure overlaid with technology icons, detailed labels for "Think", "Feel", "Do", "Learn".
Technology and Digital Transformation
Professional Services
Discusses how various technologies enhance professional skills in areas like cognition, communication, and empathy, specifically in the context of professional services.
professional services, technology, human capabilities, cognition, communication
Diagram
Accenture
Saved
This slide includes comparative lists and block diagrams detailing the benefits of onsite and remote work, as well as levers for successful smart work like office space usage and policies. It features a green and gray color scheme and includes a pie chart for visual data representation.
Operational Efficiency
Professional Services
Discusses benefits of onsite versus remote work including cost savings, safety, productivity, and effectiveness with examples from an insurance company. Explores strategies to make smart work effective using various levers like technology infrastructure.
Smart work, Remote work, Onsite benefits, Productivity, Cost savings
Header Vertical
BCG
Saved
The slide features column charts, lists with bullet points, and icons. The layout is clean with clear division between textual information and graphical data on the right.
Financial Performance
Financial Services
This slide summarizes the achievements in sustainable finance for Q4 2023, showing financial volumes in sustainable projects and detailed commitments in various financial services, aimed at enhancing sustainability. It provides an overview of strategic financial commitments, investments in renewable energy, and the inclusion of sustainability in corporate operations.
Sustainability, Finance, Renewable Energy, Corporate Strategy, Investments
Mixed Chart
Deutsche Bank
Saved
Left side shows percentage bubbles, right side has a column chart and text
Technology and Digital Transformation
Technology & Software
Insights into the use of synthetic data for model improvement and efficiency, highlighting challenges
model accuracy, efficiency, synthetic data, challenges
Multiple Chart
Gartner
Saved
A bubble chart similar to the previous slide but focused on 'Buy' versus 'Build' strategies. It compares the CARG and growth rates of various IT services, with bubbles sized by market impact.
Strategic Planning
Technology & Software
The slide compares the 'Buy' and 'Build' approaches in IT services, showing growth trends and CARG for different service categories, helping organizations decide on strategic investment directions.
Buy vs Build, IT Services, Growth Rates, Strategic Planning, Market Impact
Single Chart
Gartner
Saved
The slide features a column chart depicting a reduction in investment bank RWA and LE. It also includes labeled segments showing various market and business adjustments.
Risk Assessment and Management
Financial Services
The slide illustrates the strategy for reducing risk-weighted assets and leverage exposure by about 40% through various strategic initiatives within the investment bank.
investment, risk, RWA, LE, reduction
Single Chart
Credit Suisse
Saved
Pie chart and bar chart showing survey results on data analytics utilisation and confidence in data accuracy among respondents.
Technology and Digital Transformation
Technology & Software
The slide presents survey findings on the maturity of data analytics utilisation and confidence in data reliability among organizations. It includes key success factors for a data analytics ecosystem.
data analytics, survey, utilisation, confidence, maturity
Multiple Chart
Deloitte
Saved
World map in purple shades, percentage yields by country, clearly labeled.
Market Analysis and Trends
Financial Services
Displays global equity yields, offering a geographic perspective for investment opportunities.
Equity Yields, Global, Investment Opportunities, Map, Geographic Distribution, Morgan Stanley, Market Monitor
Graphic
Morgan Stanley
Saved
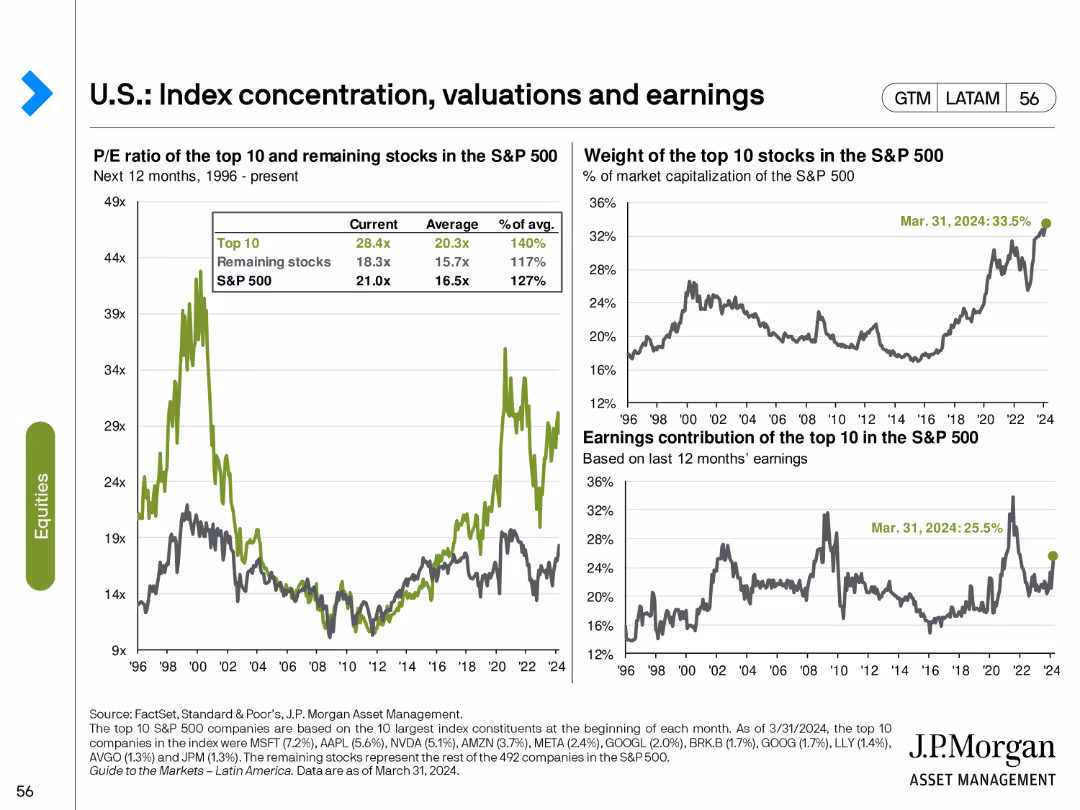
The slide includes two line charts and one column chart. The line charts compare P/E ratio of top 10 stocks and remaining stocks in S&P 500. The column chart shows the weight and earnings contribution of top 10 stocks.
Financial Performance
Financial Services
This slide examines the concentration, valuations, and earnings of the top 10 stocks in the S&P 500 compared to the remaining stocks, providing insights into market dynamics.
index concentration, P/E ratio, earnings, S&P 500, stocks
Multiple Chart
JP Morgan
Saved
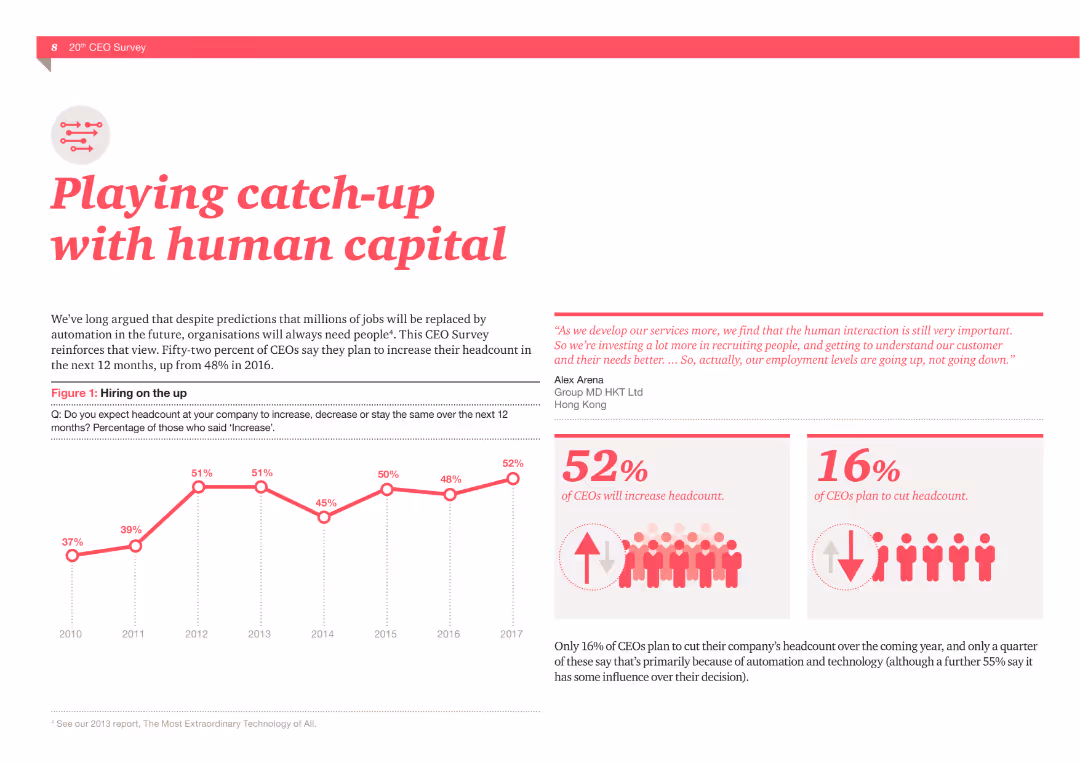
A column chart showing hiring trends from 2010 to 2017, and two statistics: 52% of CEOs plan to increase headcount, 16% plan to cut headcount. Includes a quote about the importance of human interaction.
Human Resources and Talent Management
Professional Services
The slide presents data from a CEO survey about hiring plans and the importance of human capital in the age of automation, supported by visual data and quotes.
Human capital, Hiring, CEOs, Headcount, Automation, Survey, Talent, Interaction, Recruitment, Employment
Multiple Chart
PwC/Strategy&
Saved
This slide includes a map and bar graphs illustrating school connectivity rates across different regions, highlighting areas with significant connectivity issues.
Strategic Planning
Education & Training
Focuses on the challenges of improving internet connectivity in schools across Indonesia's less populated islands, underlining the geographical disparities.
school connectivity, internet access, sparsely populated, Indonesia, structural challenges
Graphic
BCG
Saved
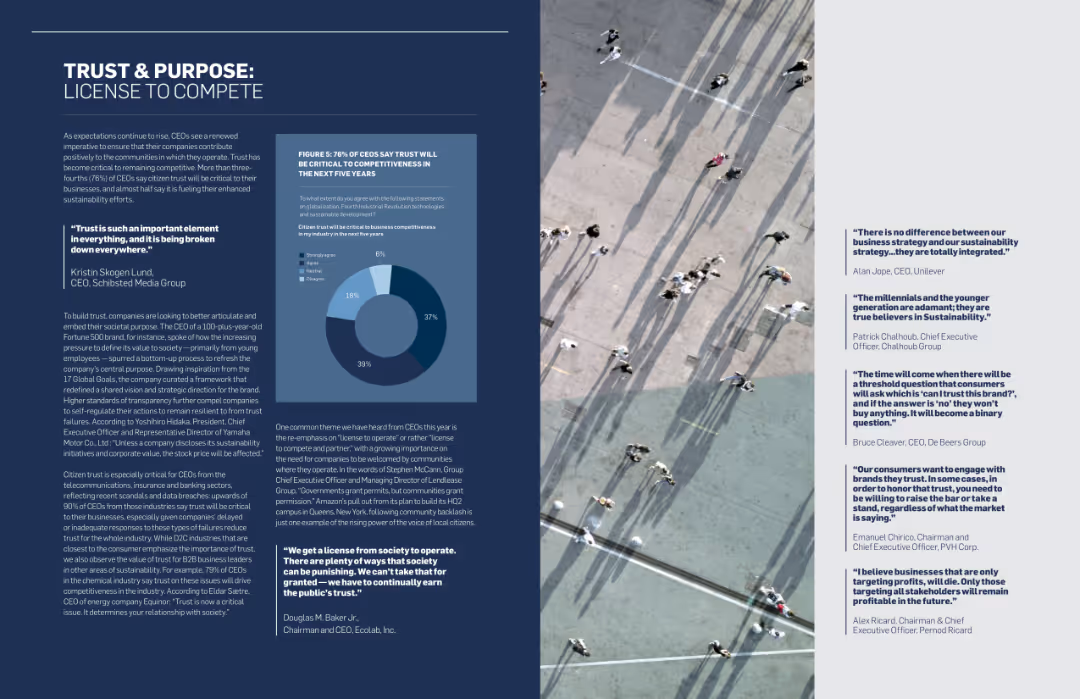
The slide features a combination of text and a column chart. The background shows an aerial view of people walking on a large surface. Quotes from various CEOs are highlighted on the right side.
Strategic Planning
Professional Services
The slide discusses the importance of trust for CEOs, emphasizing how it impacts their business competitiveness and sustainability strategies. It includes quotes from CEOs and a column chart showing survey data.
Trust, CEOs, Competitiveness, Sustainability, Business Strategy, Survey Data, Professional Services, Strategic Planning
Mixed Chart
Accenture
Saved
The slide displays horizontal bar charts with data points and forecast ranges for GDP growth in multiple countries from 2020 to 2021.
Market Analysis and Trends
Financial Services
Focuses on GDP growth forecasts versus baseline for different countries, projecting economic downturns and recoveries with forecast ranges and baseline comparisons.
GDP, forecast, economic downturn, baseline, 2020, 2021, recovery
Multiple Chart
BCG
Saved
Displays a comparative table of hydrogen use cases across different countries, including industrial feedstock, FCEV manufacturing, electricity generation, and heating.
Strategic Planning
Energy & Utilities
Compares how different countries are developing hydrogen use cases across various sectors, focusing on strategic planning and implementation.
Hydrogen, use cases, strategy, comparative, countries, industrial feedstock, manufacturing, electricity generation
Table
Kearney
Saved
A bar chart showing the timeline of various power plant projects incorporating CCUS technology.
Market Analysis and Trends
Energy & Utilities
Details the timeline and progress of power plant projects using CCUS equipment for emissions reduction.
CCUS, power plants, projects, timeline, emissions
Single Chart
Kearney
Saved
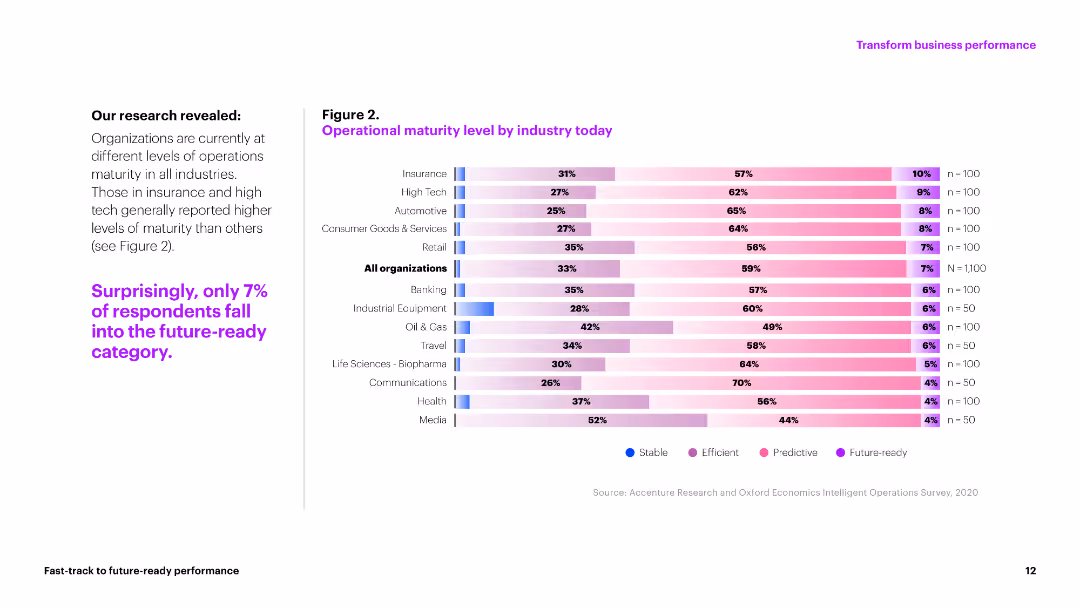
A column chart showing operational maturity levels across various industries, with detailed text explanations.
Market Analysis and Trends
Technology & Software
This slide presents data on the operational maturity levels of different industries, indicating areas of stability, efficiency, and readiness.
operational maturity, industry analysis, stability, efficiency, future-ready
Mixed Chart
Accenture
Saved
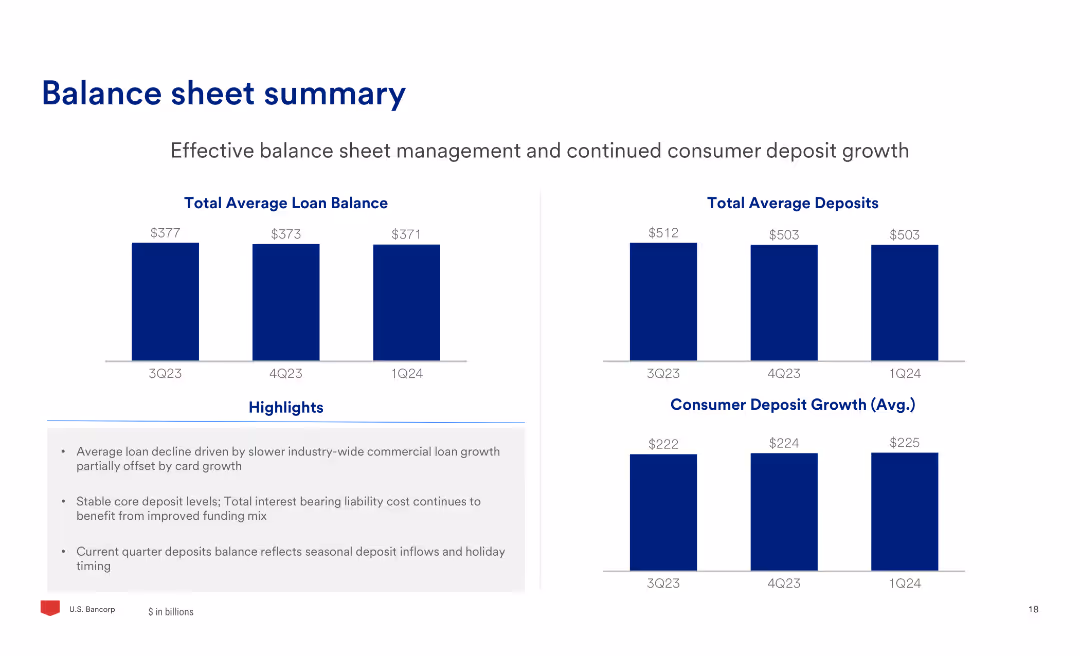
The slide includes two column charts showing total average loan balance and total average deposits over three quarters, along with text highlights on balance sheet management.
Financial Performance
Financial Services
The slide provides an overview of the balance sheet, focusing on effective management of loans and deposits, highlighting the trends in average balances and deposit growth.
Balance, Sheet, Loans, Deposits, Management, Growth
Multiple Chart
Barclays
Saved
Includes column charts comparing the implementation of digital technologies like Cloud, BI, RPA, and Cognitive & AI across regions.
Operational Efficiency
Technology & Software
Discusses the lagging adoption of digital technologies in the Nordics for cost reduction compared to other regions, projected implementation over the next 24 months, and the success outcomes of these technologies.
Digital Adoption, Cost Reduction, Technology Implementation, Nordic
Multiple Chart
Deloitte
Saved
Contains a large red and black pie chart with labels, detailing the percentage split between tax and non-tax revenue, accompanied by three colored triangles representing different non-tax revenue sources.
Regulatory and Compliance
Government & Public Sector
This slide visually differentiates the proportions of tax and non-tax revenue for a fiscal year, highlighting major sources like administrative fees and entrepreneurial income.
tax, revenue, non-tax, administrative fees, entrepreneurial, finance, government, analysis, proportion, sources
Mixed Chart
PwC/Strategy&
Saved
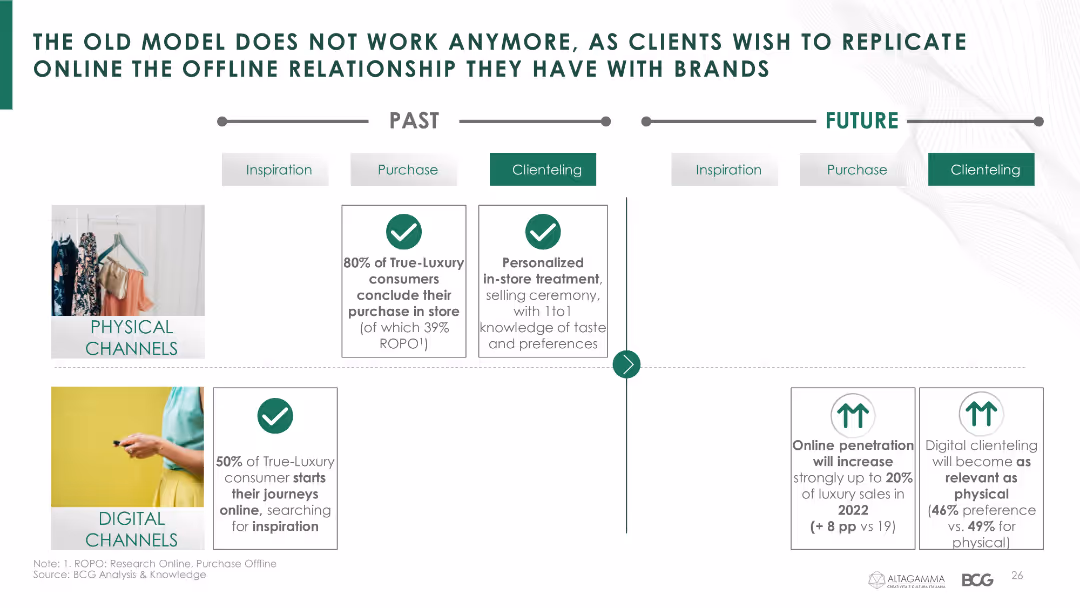
This slide has a comparative layout showing past and future models for physical and digital channels. It includes icons, images, and text boxes to differentiate key points.
Market Analysis and Trends
Retail & E-commerce
The slide highlights the shift in consumer behavior from physical to digital channels, emphasizing the need for brands to replicate offline relationships online.
Consumer behavior, physical channels, digital channels, luxury market, online penetration, digital clienteling, purchasing journey, clienteling, trends
Table
BCG
Saved
The slide showcases multiple column charts with financial metrics such as invested assets, deposits, loans, and revenues across different business units. It features clear numerical data and graphical elements.
Strategic Planning
Financial Services
It highlights the commercial momentum by presenting key financial metrics, emphasizing growth in invested assets, net new money, and other financial indicators.
commercial momentum, financial metrics, assets, deposits, loans
Multiple Chart
UBS
Saved
Features a complex diagram showing the interconnected elements of the procurement value chain, including arrows and blocks.
Strategic Planning
Professional Services
Explains the complexity and interconnectedness of modern procurement value chains with detailed breakdowns of each element.
procurement, value chain, complexity, interconnected, diagram, analytics, management, strategy, operations
Diagram
Kearney
Saved
The slide presents four numbered strategic imperatives with icons, each on differently colored banners (blue, light blue, red, and green). The layout is clean and uses large, bold fonts for emphasis.
Strategic Planning
Financial Services
This slide outlines strategic imperatives focused on profitability, brand value, narrative about student lending, and capital allocation for shareholder value. Used for presenting core business strategies.
Strategy, Profitability, Brand Value, Capital Allocation, Shareholder Value
Pillar
Morgan Stanley
Saved
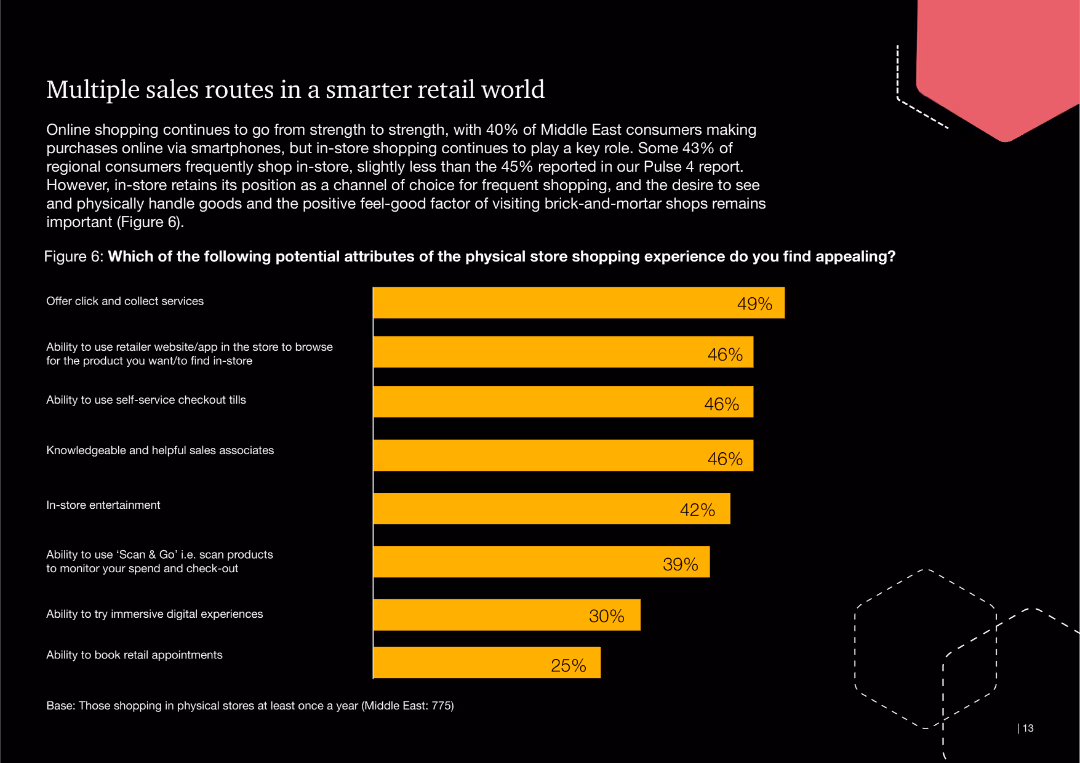
This slide includes a bar chart listing potential attributes of the physical store shopping experience that consumers find appealing, such as click-and-collect services and self-service checkouts.
Technology and Digital Transformation
Retail & E-commerce
The slide discusses the importance of various physical store features that appeal to consumers, emphasizing the role of digital tools and services in enhancing the retail experience.
retail, sales routes, physical store, consumer, click-and-collect, self-service
Single Chart
PwC/Strategy&
Saved
Previous
Next
If nothing, comes up, please save your slides first
Create a FREE account to continue browsing
Receive Instant Access to 1,000+ slides from companies like McKinsey, Google, and Goldman Sachs
First Name
Last Name
Email
Password
I agree to all
Terms & Privacy Policy
Thank you! Your submission has been received!
Oops! Something went wrong while submitting the form.
Have an account?
Sign in
Column Chart
Heatmap
Chevron
Org Chart
Infographic
Callouts
Timeline
List
Graphic
Picture
Process Flow
Diagram
Paragraph
Map
Table
Framework
Subtitle
Takeaway Box
Icon
Other Chart
Radar Chart
Waterfall Chart
Mekko Chart
Pie Chart
Scatter Plot
Line Chart
Bar chart
Bullet points