My Account
My Slides
Search by Category
Templates
Leave Feedback
Login
Logout
Get Started
Browse all Slides
Browse all Slides
Create a FREE Account
Instant access to 1,000+ real slides from top companies like McKinsey, BCG, Goldman Sachs, Google and many more!
First Name
Last Name
Email
Password
I agree to all
Terms & Privacy Policy
Thank you! Your submission has been received!
Oops! Something went wrong while submitting the form.
Have an account?
Sign in
Saved Slides
This slide includes two line charts comparing the historical levelized cost of energy for unsubsidized wind and solar PV from 2009 to 2023.
Market Analysis and Trends
Energy & Utilities
The slide analyzes historical cost trends for unsubsidized wind and solar PV energy, showing significant cost reductions and potential areas for further improvements and competitiveness.
Historical LCOE, Wind Energy, Solar PV, Cost Trends, Unsubsidized Energy
Multiple Chart
Roland Berger
Saved
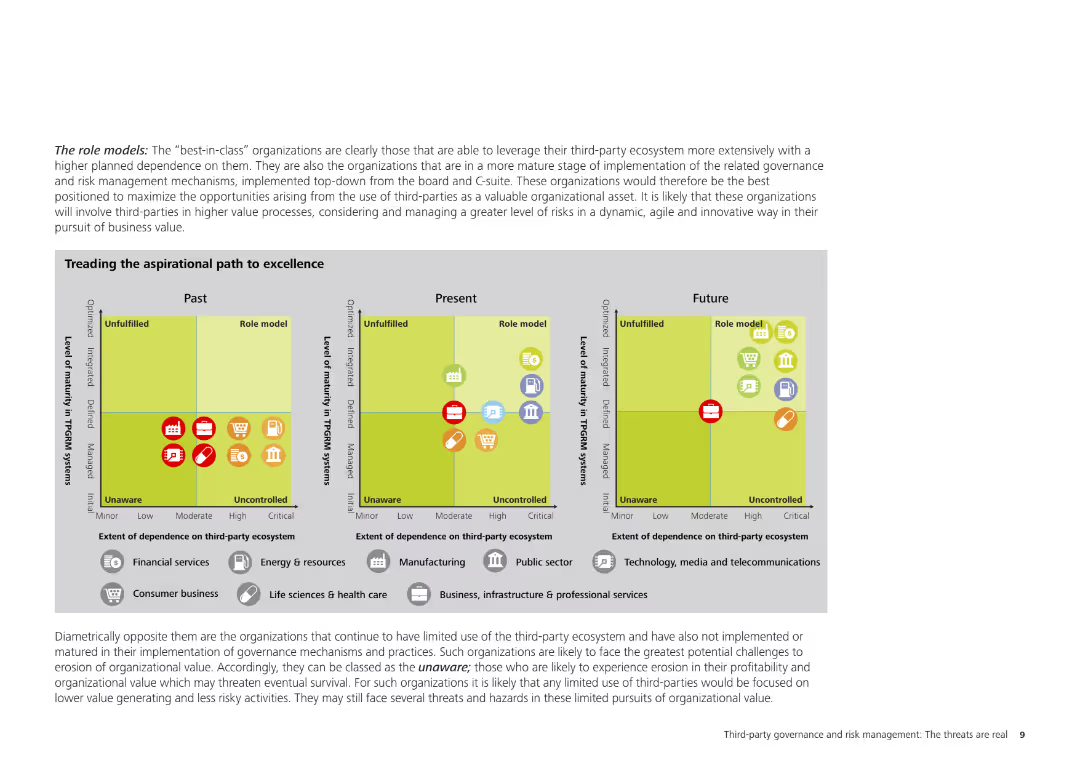
The slide contains a detailed text description and charts illustrating the role models in third-party risk management, highlighting organizations that effectively leverage their third-party ecosystems.
Strategic Planning
Professional Services
This slide identifies organizations that serve as role models in third-party risk management, emphasizing their effective use of third-party ecosystems and mature governance processes. It includes visual grids and charts to support these findings.
role models, third-party risk, governance, risk management, professional services, organizational strategy, best practices
Diagram
Deloitte
Saved
This slide includes a column chart detailing investments in the European FoodTech sector by category from 2014 to 2020, emphasizing shifts in investment focus.
Investment Analysis
Agriculture & Food Production
Analyzes investment trends in the FoodTech sector, noting a shift from delivery services to more comprehensive solutions involving the entire food supply chain, focusing on sustainability and technological integration.
FoodTech, investments, trends, sustainability, technology
Mixed Chart
Accenture
Saved
Graphs, data matrix, and a strong purple and white color theme.
Strategic Planning
Technology & Software
The slide emphasizes the executive focus on digitizing supply chains for transforming business models. It shows a prioritization matrix with different digital transformation aspects rated on importance. Ideal for discussing strategic planning and digital transformation initiatives in the technology industry, where the priority is to enhance supply chain operations through digital advancements.
Digitization, Supply Chain, C-Suite, Transformation, Business Models, Technology, Strategic Planning, Digital Advancements, Operations, Priority
Table
Accenture
Saved
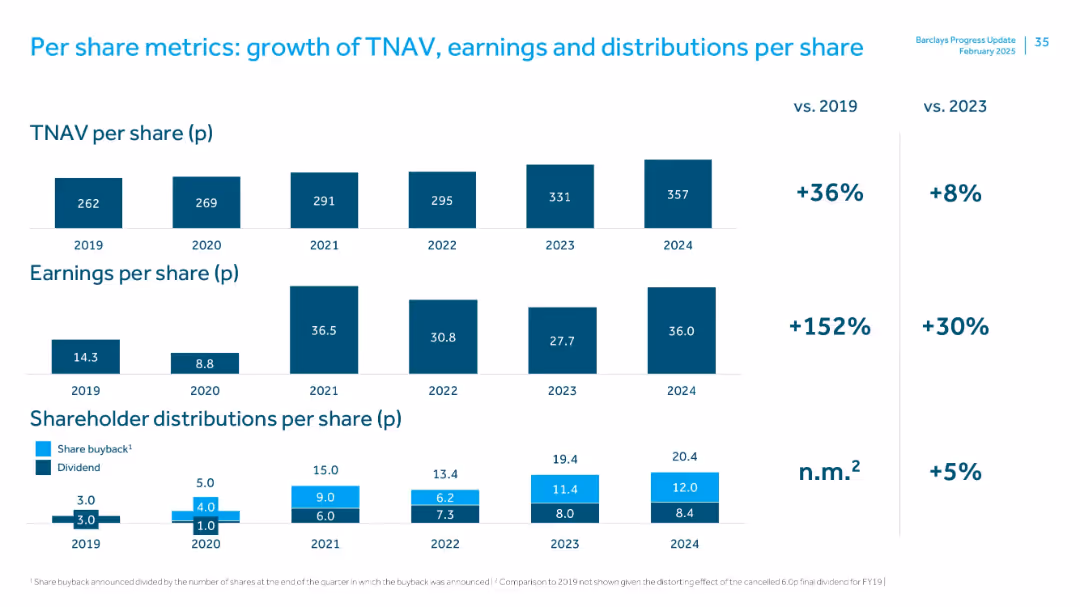
Three-panel stacked bar chart covering TNAV, earnings, and shareholder distributions per share from 2019–2024, with % change vs 2019 and 2023 shown on the right.
Financial Performance
Financial Services
The slide tracks 5-year per-share metrics. TNAV rose 36% vs. 2019; EPS grew 152%, and distributions also increased. A focus on long-term value creation through sustained earnings and return to shareholders.
TNAV, earnings per share, shareholder value, dividend, buyback, 5-year trend
Multiple Chart
Barclays
Saved
This slide presents two sets of bar graphs. On the left, bars represent the percentage of respondents planning to increase investments in technologies. On the right, bars show current monitoring of emerging technologies, such as "Next-gen computation" and "Metaverse and Web 3.0."
Investment Analysis
Technology & Software
The slide is designed to showcase investment trends in the digital core of businesses, highlighting areas like AI, automation, and cloud services. It also indicates the attention given to emerging technologies, useful for investors and businesses focusing on strategic technology advancements.
digital investment, AI, cloud services, emerging technology, business trends
Multiple Chart
Accenture
Saved
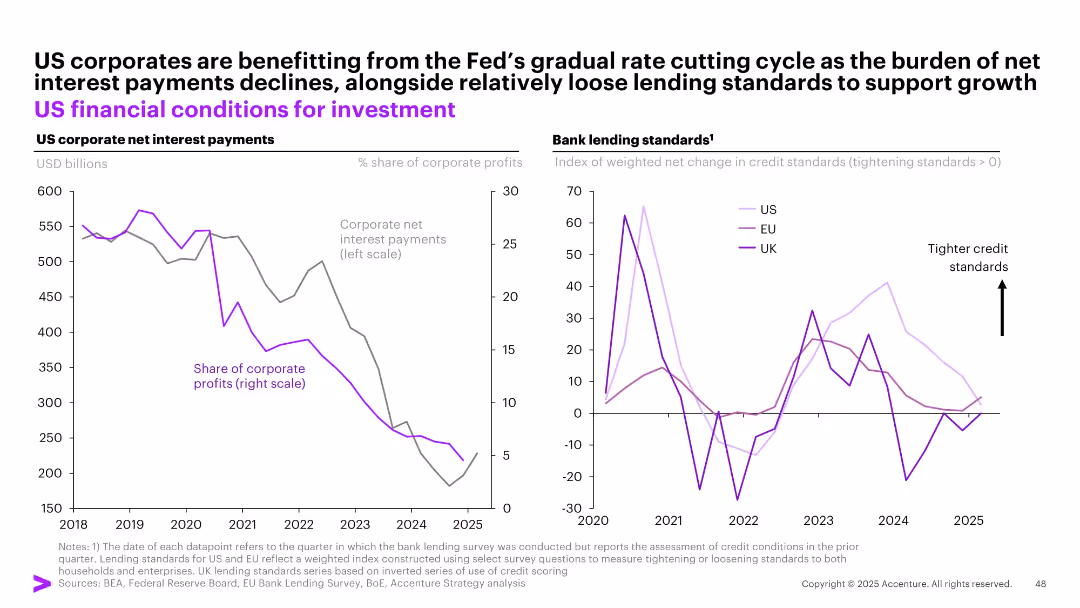
Two-panel graph: left = net interest payments as share of profits, right = bank lending standards index (US, EU, UK)
Financial Performance
Financial Services
The slide shows that US corporates benefit from the Fed's rate cuts, as net interest payments decrease significantly. Concurrently, bank lending standards remain relatively loose, especially compared to EU and UK conditions, supporting continued investment activity.
interest payments, US corporates, investment, lending standards, Fed policy, rate cuts
Multiple Chart
Accenture
Saved
Combines text and an image of a flowchart outlining the phases of implementing a global business strategy with deliverables highlighted in different colors.
Operational Efficiency
Professional Services
Provides a comprehensive view on developing a commercial mindset within GBS, detailing the process and strategic phases necessary for effective global operation and management.
GBS, strategy, implementation, phases
Linear Flow
Deloitte
Saved
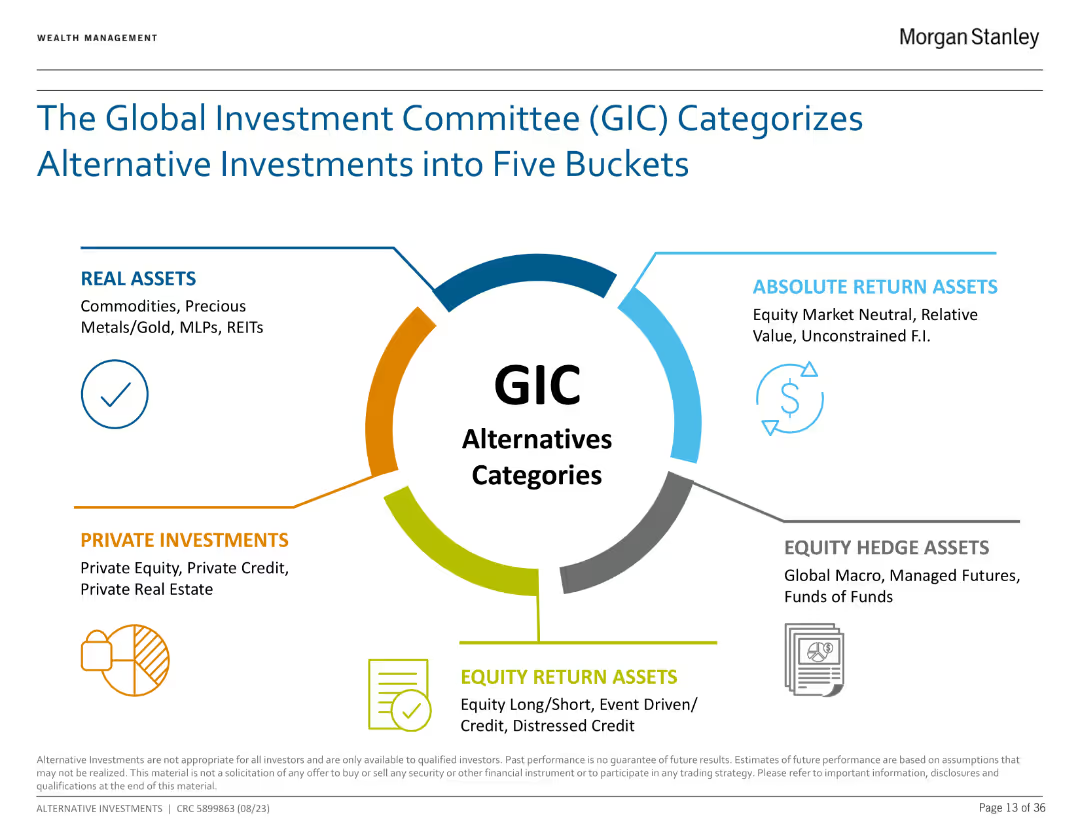
The slide features a circular diagram with five sections representing different categories of alternative investments, each with brief descriptions.
Investment Analysis
Financial Services
The slide explains the five categories of alternative investments as defined by the Global Investment Committee (GIC): Real Assets, Absolute Return Assets, Equity Hedge Assets, Private Investments, and Equity Return Assets.
Alternative Investments, GIC, Real Assets, Equity, Investment Analysis
Framework
Morgan Stanley
Saved
Slide includes stacked column charts displaying credit losses and stages of loans across different banking sectors.
Risk Assessment and Management
Financial Services
Analyzes credit loss provisions and the status of stage 3 loans in Q1 2023 across various banking divisions, illustrating risk management and credit performance within the bank.
credit losses, loans, risk management, Q1 2023
Multiple Chart
Deutsche Bank
Saved
A two-dimensional matrix juxtaposing ‘Asset Management’ and ‘Consumer & Wealth Management’ against ‘Global Markets’ and ‘Investment Banking’.
Strategic Planning
Financial Services
Showcases the company's core areas of operation, signifying a stable and robust business structure. Useful for investor presentations or company orientation.
Foundation, Asset Management, Investment Banking, Global Markets, Wealth Management
Framework
Goldman Sachs
Saved
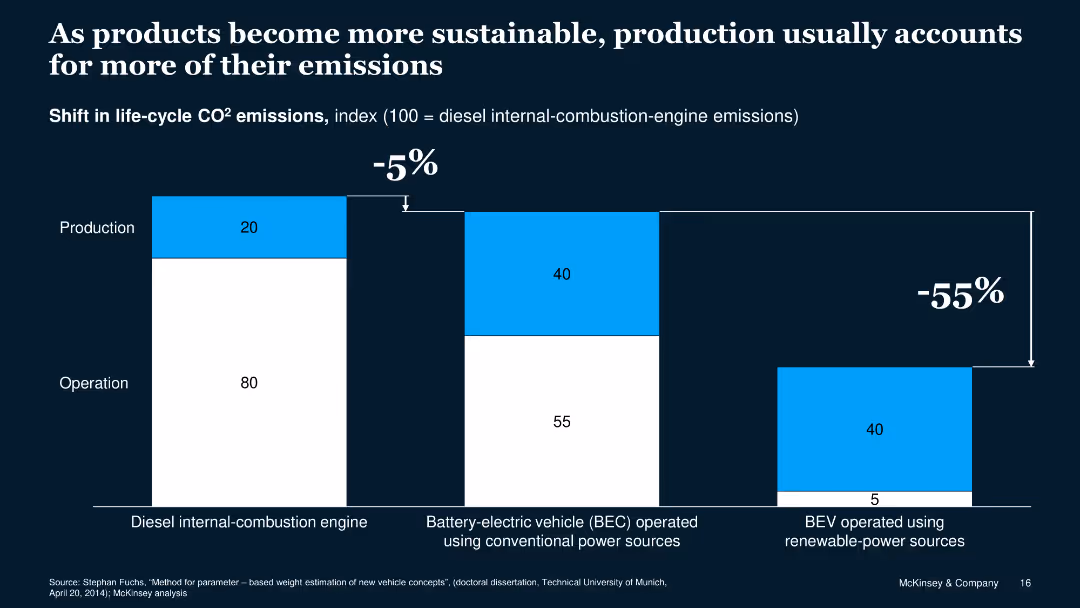
Column chart showing the shift in life-cycle CO2 emissions from different vehicle types.
Market Analysis and Trends
Environmental Services & Sustainability
Highlights the shift in CO2 emissions with a focus on production and operation of different vehicles.
CO2 emissions, production, operation, vehicles, sustainable
Single Chart
McKinsey
Saved
Slide with three sections containing bullet points, each detailing a different aspect of digital trust challenges.
Technology and Digital Transformation
Professional Services
Discusses the considerations leaders should have regarding zero-trust architecture, digital identity, and overarching risks.
leadership considerations, zero-trust, digital identity, AI, privacy engineering, technology risks
Boxed
McKinsey
Saved
The slide features two column charts. The left chart shows the UK unemployment rate and wage growth over time. The right chart presents labor force participation rates for the US, Eurozone, and UK. The data is well-segmented and color-coded.
Market Analysis and Trends
Financial Services
This slide provides insights into the UK labor market, focusing on unemployment, wage growth, and labor force participation rates, essential for labor market analysis.
UK labor market, unemployment, wage growth, labor force participation, economic trends
Multiple Chart
JP Morgan
Saved
Slide with a timeline showing the growth in internet users over three years. Each year is represented by a different size and colored circle, with numbers indicating user growth.
Market Analysis and Trends
Technology & Software
Provides a visual representation of internet user growth in Southeast Asia, showing the year-over-year increase. Used for discussing trends in digital adoption and the expanding internet user base.
Internet Users, Growth, SEA
Single Chart
Bain
Saved
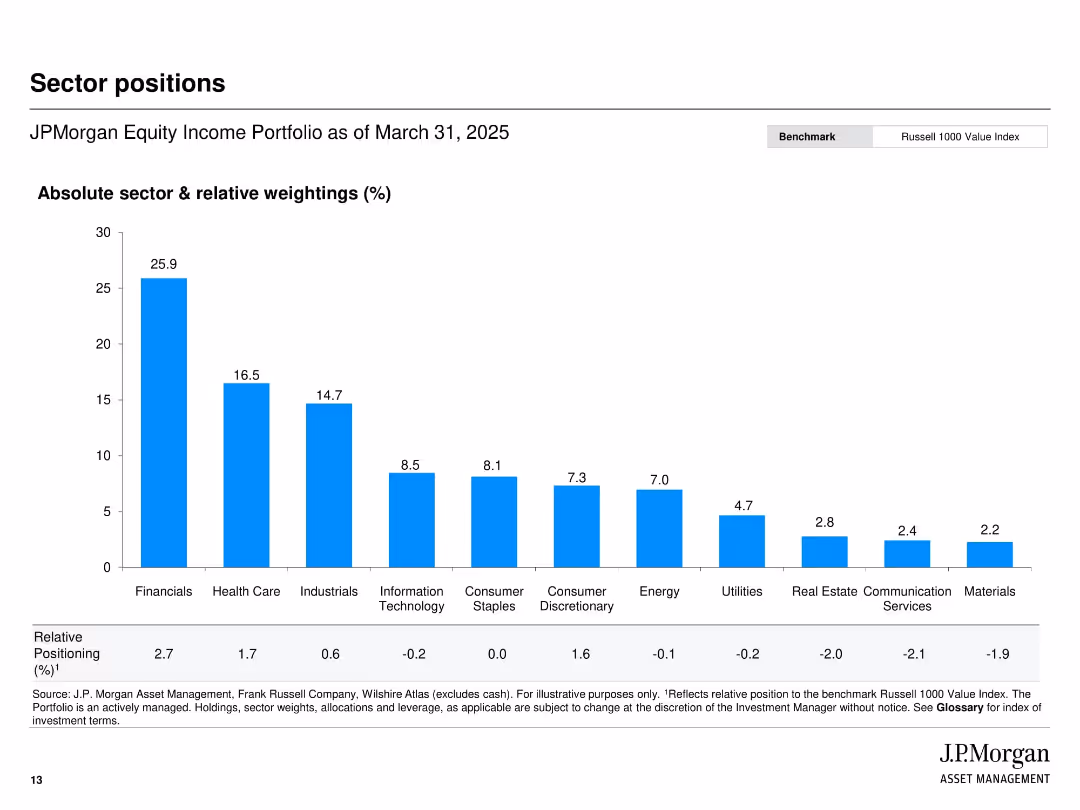
Vertical bar chart layout ranking sector exposure by absolute and relative weightings.
Investment Analysis
Financial Services
Presents sector allocation for JPMorgan’s Equity Income Portfolio, highlighting top exposures (e.g., Financials, Healthcare) as of March 31, 2025. The chart includes both absolute weight and relative position to the Russell 1000 Value Index.
sector weights, portfolio allocation, JPMorgan, financials, equity income, relative positioning, benchmark
Single Chart
JP Morgan
Saved
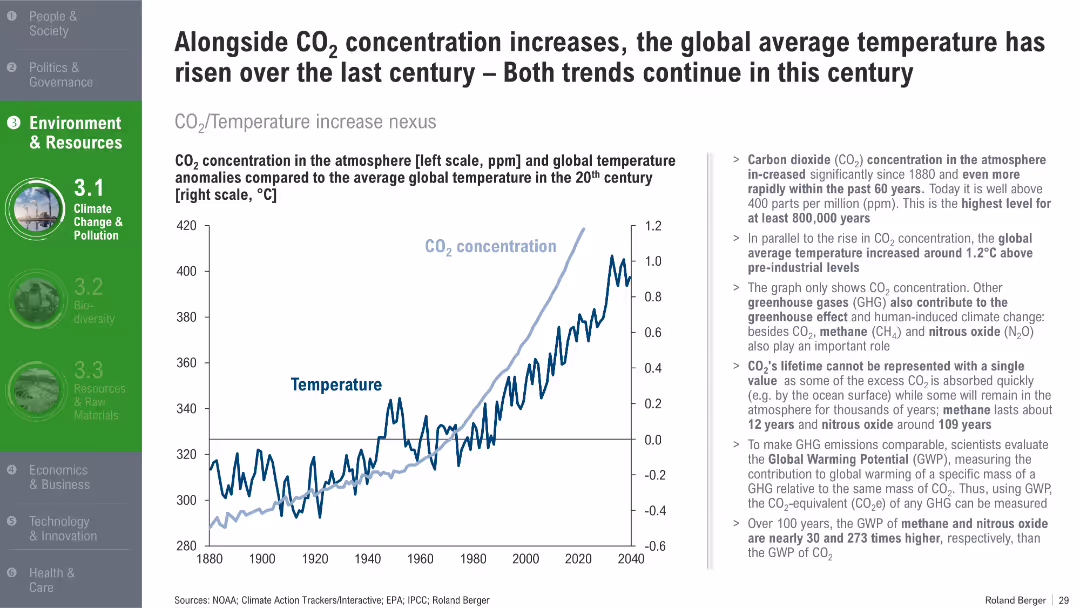
Dual-axis line chart comparing CO₂ levels with temperature anomalies from 1880 to 2040. Summary of scientific implications on the right.
Risk Assessment and Management
Environmental Services & Sustainability
This slide shows the direct correlation between rising CO₂ concentrations and global temperature increases. It explains greenhouse gas contributions and their long-term environmental impact.
CO2 emissions, global warming, greenhouse gases, temperature rise, climate science, sustainability
Mixed Chart
Roland Berger
Saved
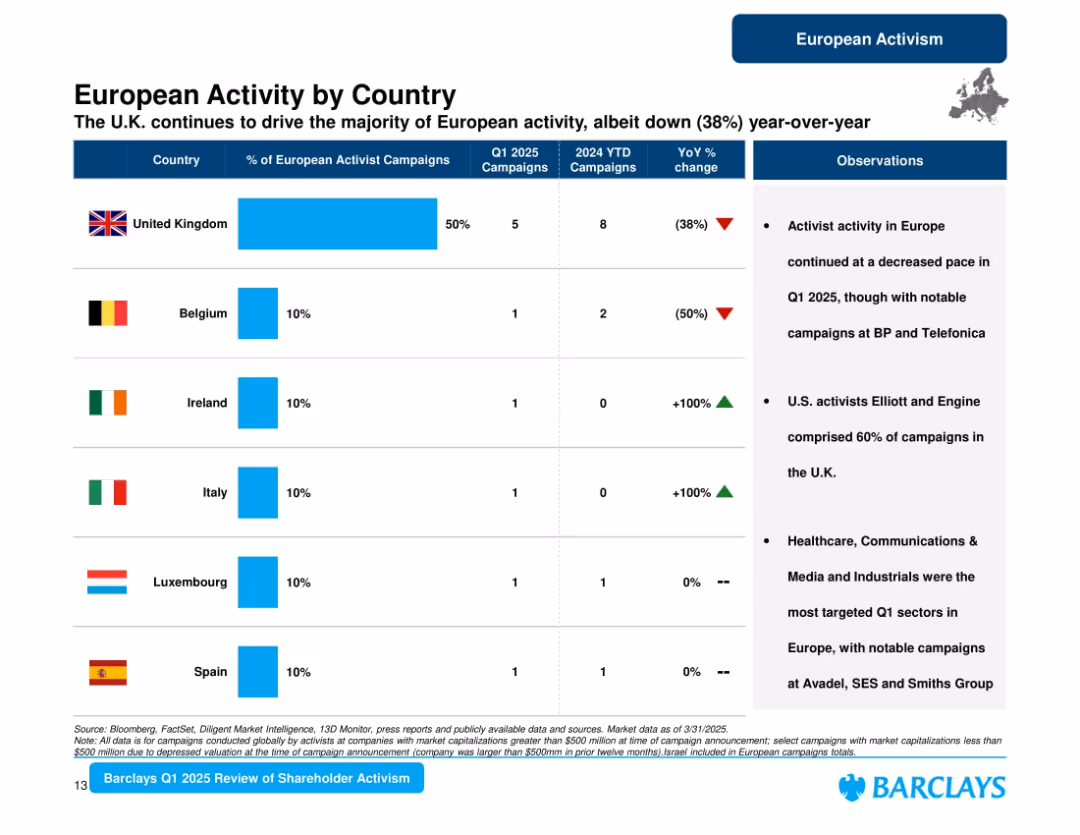
Tabular format with country flags, bars, and bullet point observations. Three main columns for metrics and one for insights.
Market Analysis and Trends
Financial Services
Provides a country-wise breakdown of activist campaign activity across Europe in Q1 2025, highlighting the UK’s dominant share and YoY changes. It also notes trends in activist involvement and sector focus across countries.
Europe, UK, Belgium, Campaigns, Activism, YoY Change, Sector Focus, Shareholder, 2025
Mixed Chart
Barclays
Saved
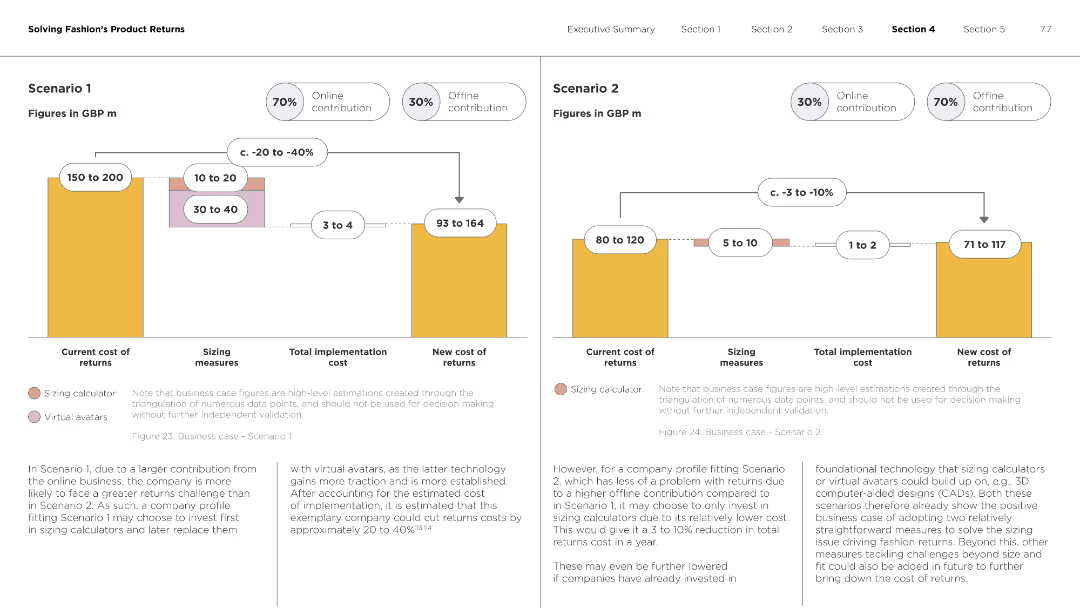
The slide includes two sets of column charts showing different cost scenarios for returns, including current cost, sizing measures, and new cost.
Strategic Planning
Retail & E-commerce
This slide analyzes two business case scenarios for reducing the cost of fashion returns through sizing measures and virtual avatars.
cost scenarios, fashion returns, sizing measures, virtual avatars, business case
Multiple Chart
Roland Berger
Saved
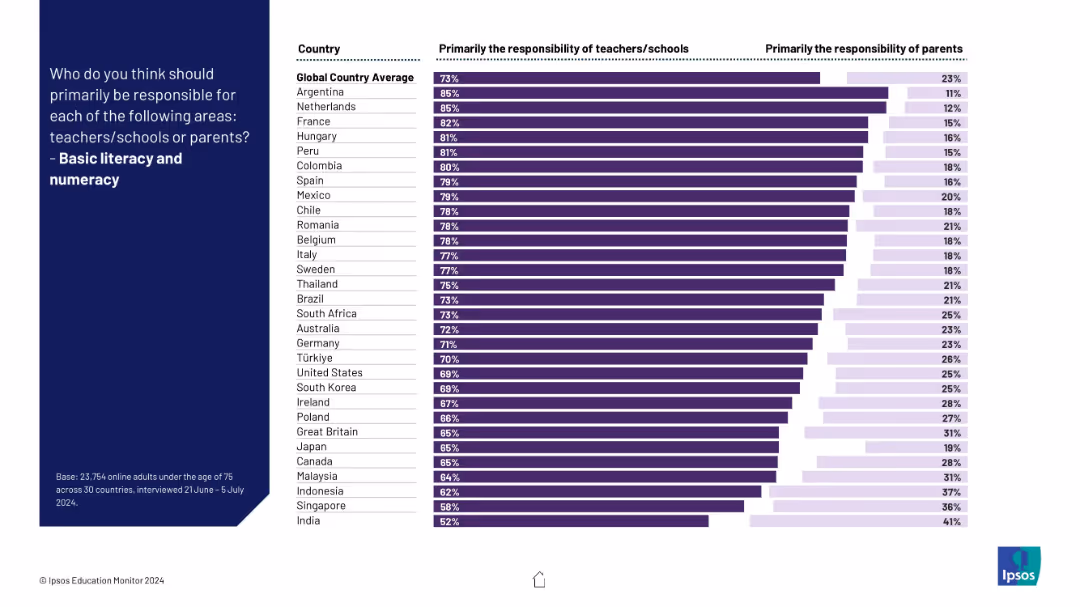
Bar chart comparing countries on whether teachers/schools or parents are viewed as primarily responsible; dark purple for schools, light purple for parents.
Strategic Planning
Education & Training
This slide presents survey results from 30 countries showing which group—teachers/schools or parents—is considered primarily responsible for basic literacy and numeracy.
literacy, numeracy, education, responsibility, global survey, schools, parents, Ipsos, countries, chart
Mixed Chart
IPSOS
Saved
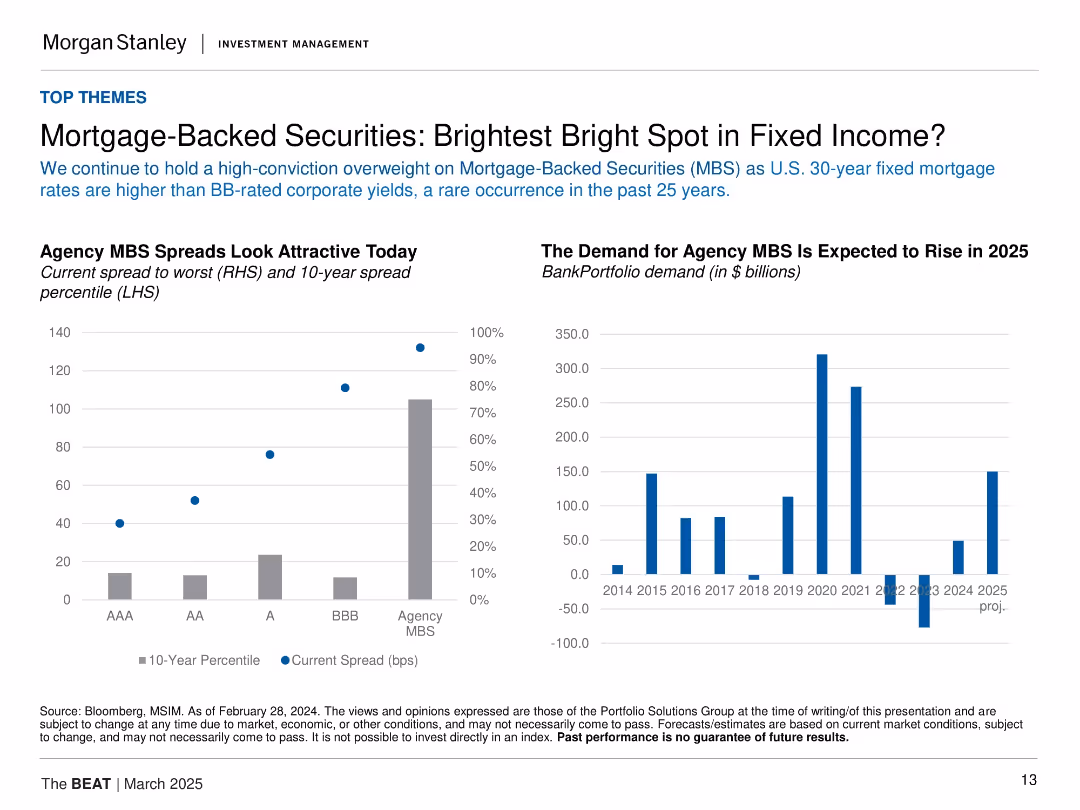
Two charts: left bar/point combo showing spreads and percentiles; right bar chart of bank demand. Light background, data-focused layout.
Investment Analysis
Financial Services
Highlights the attractiveness of agency MBS, with higher spreads than BB-rated corporates and strong historical percentile positioning. Demand is projected to rise significantly in 2025 after recent declines, signaling renewed institutional interest.
MBS, spreads, fixed income, mortgage rates, bank demand, agency bonds, yield, investment opportunity
Multiple Chart
Morgan Stanley
Saved
This slide displays a combination of a line graph and bar chart, detailing incremental cases and tests per day in Italy during the COVID-19 pandemic. Key dates and actions are annotated. It has a blue and black color scheme with text boxes for annotations.
Market Analysis and Trends
Healthcare & Pharmaceuticals
The slide presents data on COVID-19 case numbers and testing frequency in Italy, highlighting the timeline of government actions and their impact. It's useful for analyzing the effectiveness of policy measures in pandemic management.
Italy, COVID-19, Lockdown, Testing, Case Numbers
Single Chart
McKinsey
Saved
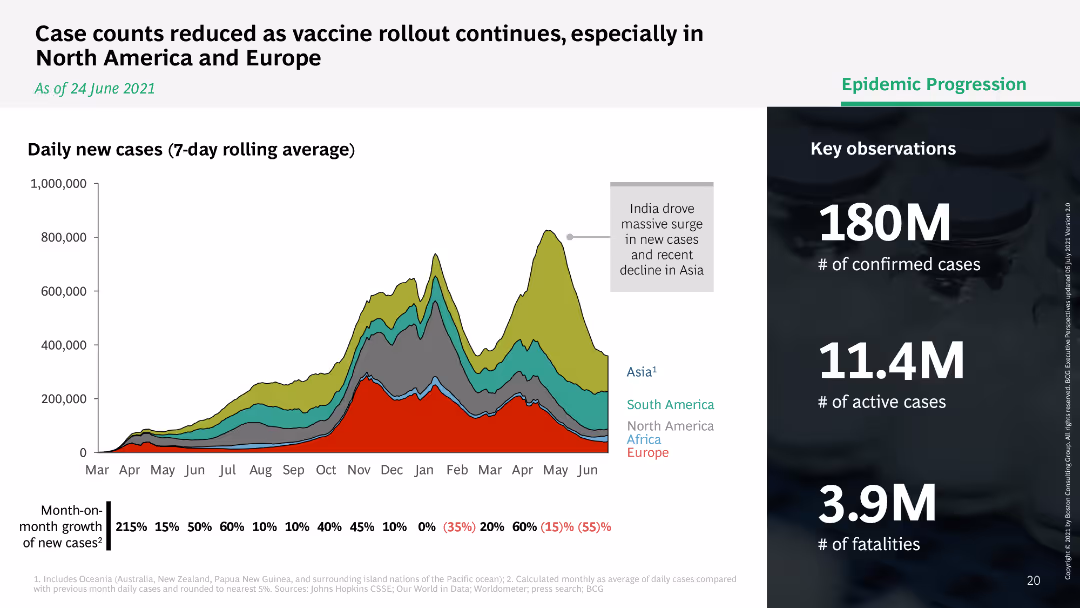
Line chart showing daily new COVID-19 cases by region with a legend indicating Asia, South America, North America, Africa, and Europe.
Market Analysis and Trends
Healthcare & Pharmaceuticals
Displays a 7-day rolling average of daily new COVID-19 cases by region, highlighting a decline in cases as vaccine rollout continues.
COVID-19, vaccine, cases, regions, decline
Mixed Chart
BCG
Saved
A conceptual circular diagram illustrates the strategy with keywords such as "scale," "engage," and "deepen" in different colors. There is minimal text other than labels and the company logo.
Strategic Planning
Financial Services
Depicts the strategic approach of JP Morgan in building customer engagement and deepening relationships, with focus on scaling through products and marketing.
strategy, engagement, customer relationships, scale, deepen
Linear Flow
JP Morgan
Saved
Contains line graphs representing the value-at-risk and stressed value-at-risk metrics over multiple quarters, with comparative data.
Risk Assessment and Management
Financial Services
Analyzes the bank's financial risk metrics, specifically value-at-risk and stressed value-at-risk, to gauge risk management effectiveness over time.
risk, VaR, sVaR, banking, metrics, management, analysis, financial
Multiple Chart
Deutsche Bank
Saved
Previous
Next
If nothing, comes up, please save your slides first
Create a FREE account to continue browsing
Receive Instant Access to 1,000+ slides from companies like McKinsey, Google, and Goldman Sachs
First Name
Last Name
Email
Password
I agree to all
Terms & Privacy Policy
Thank you! Your submission has been received!
Oops! Something went wrong while submitting the form.
Have an account?
Sign in
Column Chart
Heatmap
Chevron
Org Chart
Infographic
Callouts
Timeline
List
Graphic
Picture
Process Flow
Diagram
Paragraph
Map
Table
Framework
Subtitle
Takeaway Box
Icon
Other Chart
Radar Chart
Waterfall Chart
Mekko Chart
Pie Chart
Scatter Plot
Line Chart
Bar chart
Bullet points