My Account
My Slides
Search by Category
Templates
Leave Feedback
Login
Logout
Get Started
Browse all Slides
Browse all Slides
Create a FREE Account
Instant access to 1,000+ real slides from top companies like McKinsey, BCG, Goldman Sachs, Google and many more!
First Name
Last Name
Email
Password
I agree to all
Terms & Privacy Policy
Thank you! Your submission has been received!
Oops! Something went wrong while submitting the form.
Have an account?
Sign in
Saved Slides
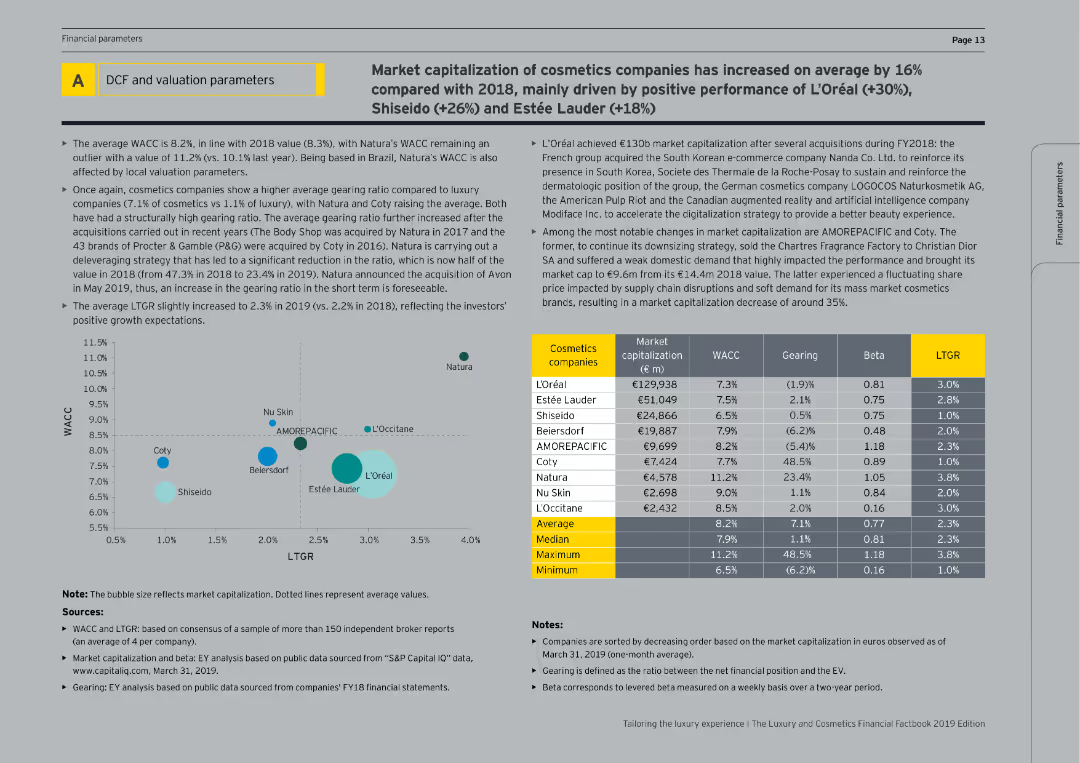
This slide includes tables and bubble charts showing the market capitalization, WACC, gearing, beta, and LTGR of cosmetics companies.
Financial Performance
Consumer Goods
The slide provides financial data on cosmetics companies, analyzing market capitalization, cost of capital, and gearing ratios, with a focus on recent performance and growth expectations.
Valuation parameters, cosmetics companies, financial metrics, market capitalization, WACC
Mixed Chart
EY
Saved
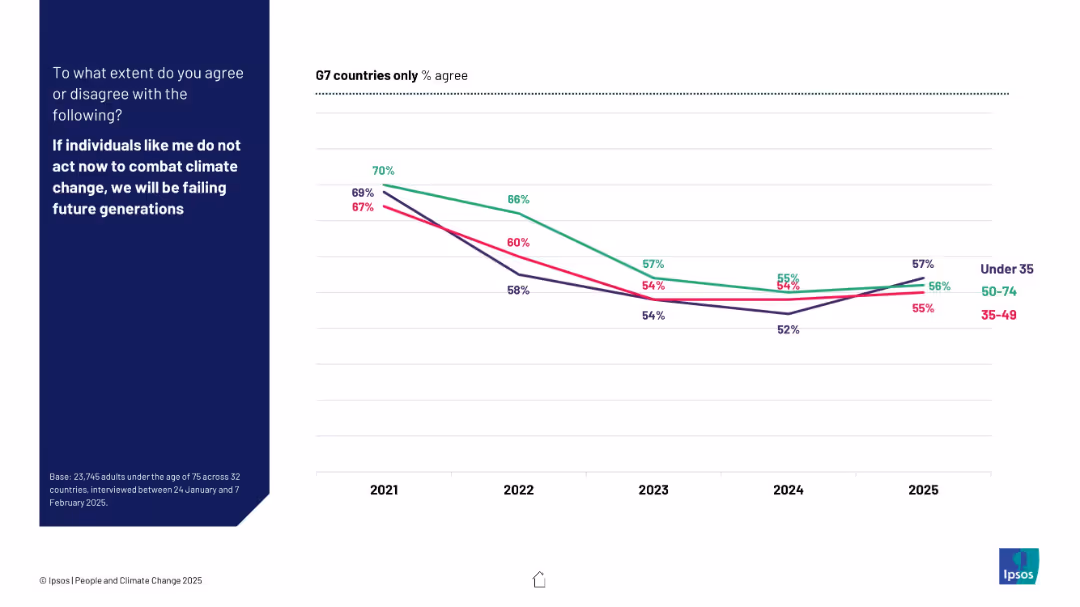
Line graph by age group (Under 35, 35–49, 50–74) across G7 countries from 2021 to 2025
Market Analysis and Trends
Environmental Services & Sustainability
This slide shows declining agreement across all age groups in G7 nations on the need for individual climate action. Although concern remains, the data implies generational shifts and a broad decrease in perceived urgency from 2021 to 2025.
age groups, G7, individual action, climate change, Ipsos, trend, disengagement, perception, generational comparison
Mixed Chart
IPSOS
Saved
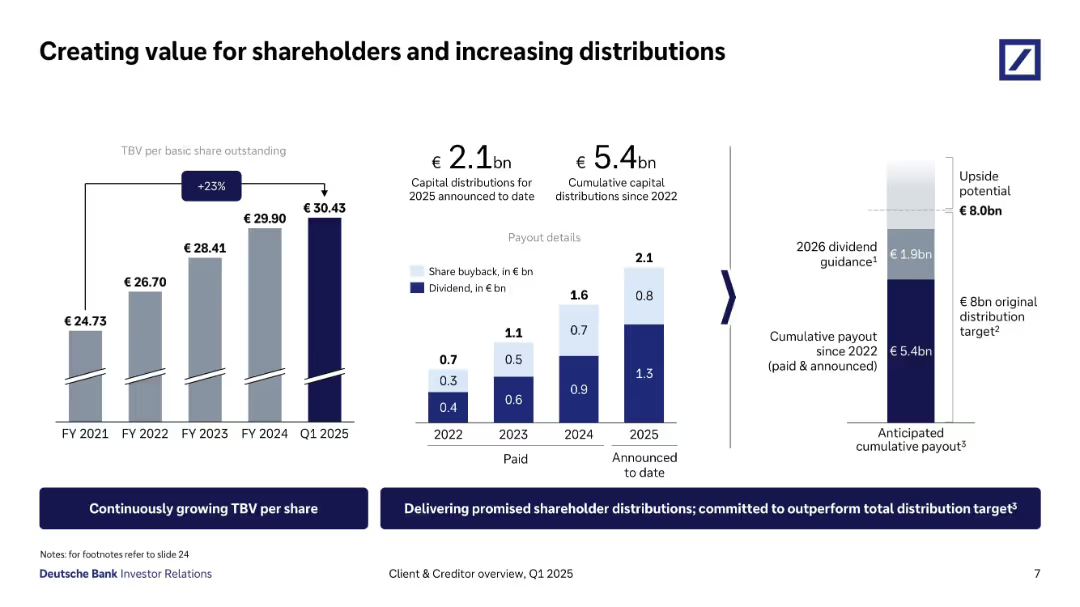
Dual-bar and column charts visualizing TBV/share growth, payout breakdown, and future distribution guidance.
Strategic Planning
Financial Services
This slide shows consistent tangible book value growth per share and cumulative shareholder payouts. It outlines dividend and buyback activity since 2022, reaching €5.4bn, and sets an €8bn distribution target by 2026.
TBV, shareholder returns, dividend, share buyback, capital distribution, 2026 guidance, payout strategy
Multiple Chart
Deutsche Bank
Saved
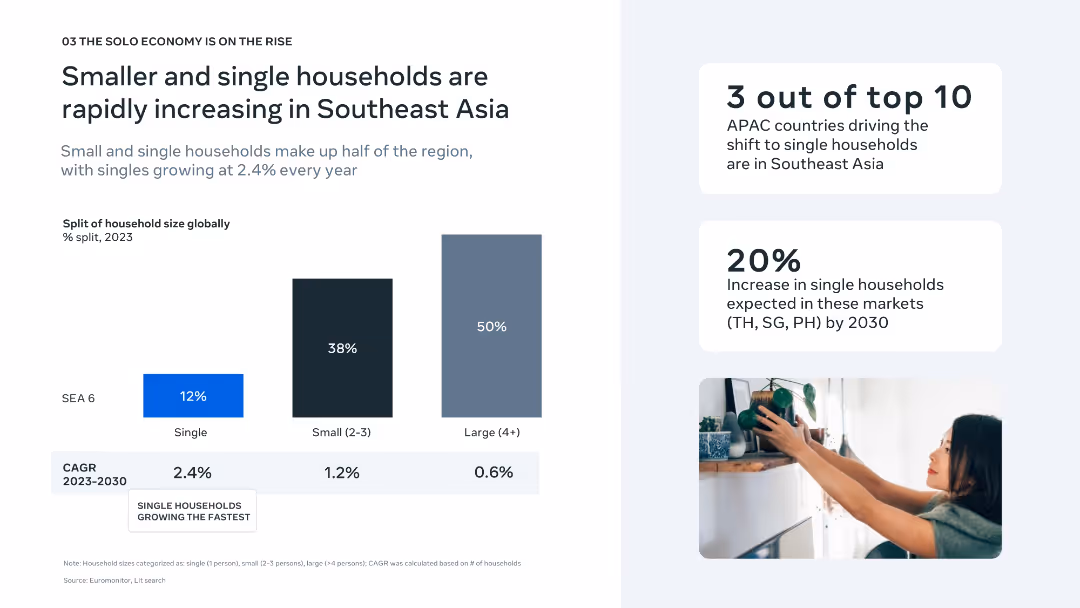
Left-aligned bar chart comparing household sizes and growth rates; stat callouts on right with minimal visuals.
Market Analysis and Trends
Consumer Goods
This slide highlights the rising trend of single-person and small households in Southeast Asia, noting a 2.4% CAGR growth in singles. It also states that SEA includes three of the top 10 APAC countries shifting toward solo households.
household trends, single households, SEA, demographics, CAGR, market shift, APAC, solo economy, urbanization, living patterns
Mixed Chart
Bain
Saved
A circular diagram in the center with icons around representing different stakeholders, text on left
Client Case Studies
Professional Services
Details the involvement of various stakeholders in EY, emphasizing internal and external communication
Stakeholders, engagement, EY, communication, plan
Diagram
EY
Saved
Multiple charts showing various economic indicators, including restructuring cases, profit warnings, volatility, and early warning indicators.
Market Analysis and Trends
Financial Services
The slide presents the initial consequences of a fragile economic environment, using various indicators to highlight trends in restructuring, profit warnings, market volatility, and early warning signals. It emphasizes the impact of these factors on the overall economic outlook and business climate.
Economic Indicators, Fragile Environment, Market Volatility
Multiple Chart
Roland Berger
Saved
Column charts comparing the average annual growth rates of labor productivity and average wages from 2010 to 2019 for France, Germany, Switzerland, and the US.
Technology and Digital Transformation
Technology & Software
This slide compares the decoupling of labor productivity growth and average wage growth across different countries. It highlights the impact of technological change on labor markets, showing that increased productivity does not always translate to higher wages.
Labor Productivity, Wages, Decoupling
Multiple Chart
Roland Berger
Saved
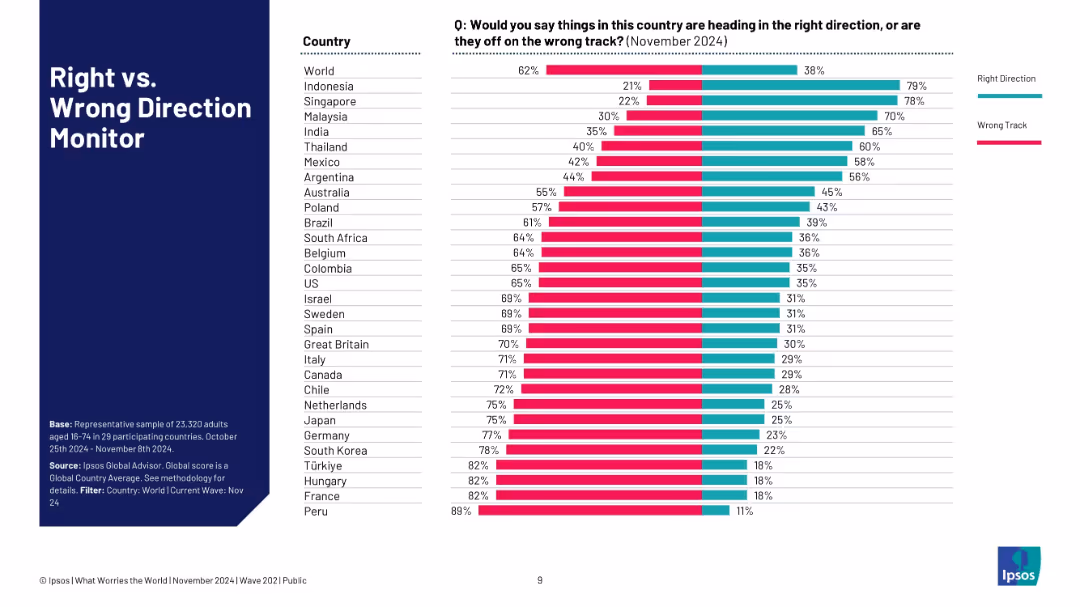
Bar chart comparing multiple countries; color-coded bars for "Right Direction" and "Wrong Track".
Market Analysis and Trends
Professional Services
The slide benchmarks 29 countries on public opinion regarding national direction. It shows wide variation across countries, with nations like Indonesia and Singapore having the most positive outlooks, while France and Peru show highest levels of dissatisfaction.
comparative analysis, public sentiment, global perception, wrong track, country benchmarking, Ipsos
Single Chart
IPSOS
Saved
The slide compares ESG strategies, emission targets, and DEI practices between manufacturing and services companies using horizontal bar charts. Each section details specific metrics within these categories, highlighting the differences in their approach.
Market Analysis and Trends
Environmental Services & Sustainability
This slide highlights the differences in ESG strategies, emission targets, and DEI measures between manufacturing and services companies. It shows that manufacturing companies are more proactive in these areas, using horizontal bar charts for clear comparison.
manufacturing, ESG, DEI, strategies, targets
Multiple Chart
Kearney
Saved
This slide contains a bar chart showing various reasons for investing in early childhood, such as fairness and societal benefits, with different bars representing different reasons.
Market Analysis and Trends
Education & Training
The slide indicates that many people believe in the importance of investing in early childhood to ensure fairness and support societal well-being.
Early childhood, fairness, investment, bar chart, public opinion, Ipsos, education, development, survey
Single Chart
IPSOS
Saved
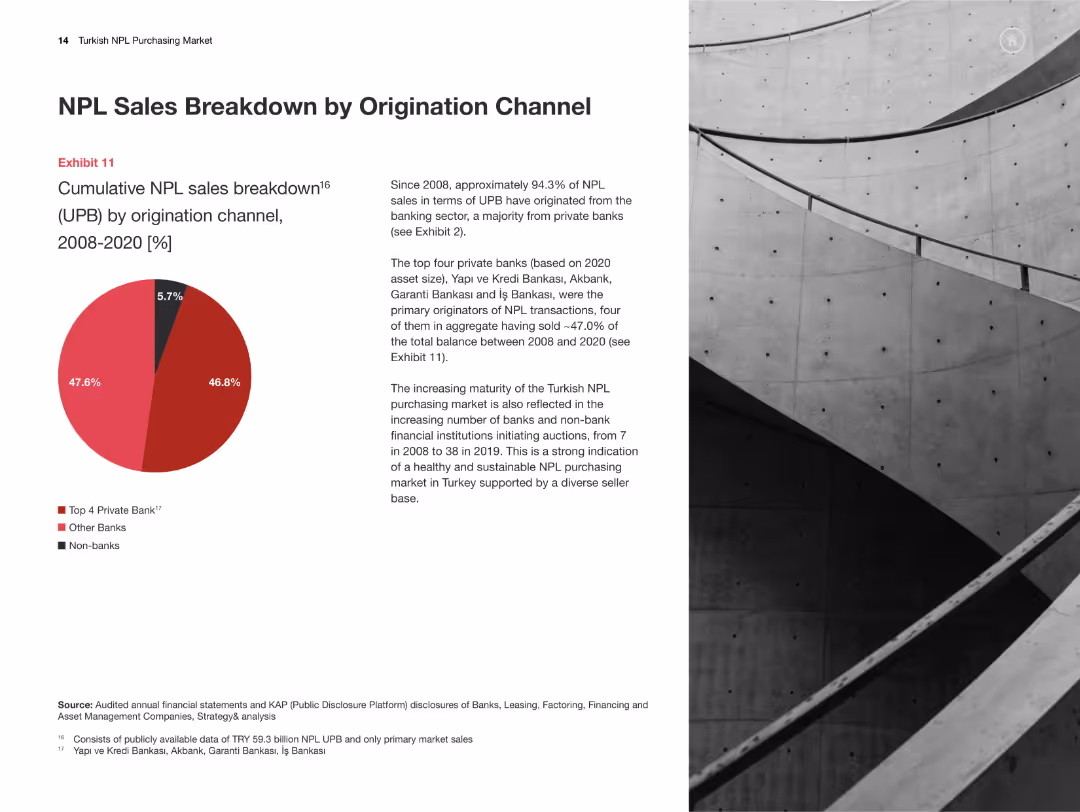
Pie chart showing the breakdown of NPL sales by origination channel (2008-2020). Text details channel contributions.
Market Analysis and Trends
Financial Services
This slide analyzes the breakdown of NPL sales by origination channel, indicating the major contributors and trends over the period.
NPL sales, origination channels, financial breakdown, market trends, Turkey
Mixed Chart
PwC/Strategy&
Saved
Three charts: a line chart for labor supply percentage change (US and Euro area), a line chart for global supply chain pressure index, and a line chart for global commodity prices from 2016-2023.
Market Analysis and Trends
Financial Services
The slide emphasizes the importance of supply conditions on inflationary dynamics in 2024, with a better balance between supply and demand expected, but lingering risks remain.
supply conditions, inflation, labor supply, supply chain pressure, commodity prices, 2024
Multiple Chart
EY
Saved
Bar graphs contrasting the gross margins of private label and branded products, accompanied by distributor case studies.
Financial Performance
Financial Services
This slide highlights how an emphasis on private label products can lead to significantly higher gross margins in distribution businesses.
gross margins, private label, branded products, distribution, profitability, case studies
Single Chart
EY
Saved
The slide has a red and black theme with two column charts showcasing judicial and non-judicial FTE breakdowns, and a table comparing FTEs across family law. It contains a small amount of text to explain the graphics.
Operational Efficiency
Government & Public Sector
This slide presents the full-time equivalent (FTE) staffing breakdown in family law courts, comparing judicial and non-judicial roles, and provides insights into resource allocation and operational structure of the courts.
courts, FTE breakdown, family law, judicial staffing, operational efficiency, resource allocation, bar graph, pie charts
Multiple Chart
PwC/Strategy&
Saved
Comparative chart of long-term senior unsecured debt credit ratings by Moody's, S&P, and Fitch for various banks, including UBS and its peers.
Competitive Landscape
Financial Services
Comparison of credit ratings of UBS against major competitors, highlighting the rating differences and outlooks from various agencies.
Credit ratings, comparison, competitors, Moody's, S&P
Table
UBS
Saved
Title, extensive data presentation through multiple bar charts detailing digital themes like "Asset Life Cycle Management" and "Energizing New Energies".
Investment Analysis
Energy & Utilities
Examines digitalization's role in reshaping the oil and gas industry, highlighting potential economic and societal benefits, including substantial emission reductions.
oil and gas, digitalization, economic impact, emission reductions, societal benefits
Mixed Chart
Accenture
Saved
Two-column layout with opportunity areas (left) and risks (right). Includes a quote from Micron executive at the bottom.
Strategic Planning
Artificial Intelligence
The slide identifies semiconductor opportunities in AI compute, automotive MCUs, infotainment processors, and IoT modules. It balances this with risks like long commercialization cycles and supply chain gaps, stressing India's strategic positioning.
AI compute, MCUs, processors, semiconductors, India, risks, IoT, data centers, automotive, supply chain
Header Horizontal
BCG
Saved
The slide includes an infographic showing how CO2 is used as a raw material for plastics. It illustrates the process of converting CO2 into polyols and other plastic components with various end-use applications.
Technology and Digital Transformation
Energy & Utilities
The slide highlights the innovative technology developed by Covestro to use CO2 as a raw material for manufacturing plastics, showcasing its potential to substitute oil-based raw materials and support circular economy initiatives.
CO2 utilization, plastics, raw materials, Covestro, circular economy
Diagram
Kearney
Saved
Consists of a checkmark matrix comparing potential revenue opportunities in different banking sectors and a conceptual model of integrated relationship management in banking.
Strategic Planning
Financial Services
Explores strategic revenue opportunities in various banking sectors, highlighting the integration of services like payments and insurance to boost client relationships.
banking, revenue, strategy, services, growth
Mixed Chart
Barclays
Saved
The slide features a mix of icons, bullet points, and sections of text, with a bold title at the top. It uses contrasting blue and white color blocks to differentiate points.
Strategic Planning
Healthcare & Pharmaceuticals
This slide details how COVID-19 has accelerated the adoption of digital solutions in healthcare, emphasizing innovations and pre-COVID-19 impediments to digital transformation in patient support solutions.
COVID-19, Digital Solutions, Healthcare, Patient Support, Telemedicine, e-Pharmacy, Innovation, Barriers, Adoption, Transformation
Header Vertical
Bain
Saved
World map with data points and legends indicating COVID-19 spread and statistics, high visual complexity.
Risk Assessment and Management
Healthcare & Pharmaceuticals
Global dashboard showing the spread and impact of COVID-19, useful for risk assessment and international response planning.
COVID-19, global dashboard, transmission, pandemic, risk management, health crisis, leading indicators
Graphic
McKinsey
Saved
Bar graphs displaying user reliance levels on nbn™ network during COVID-19, visual markers for household upgrades, and supportive text on the side.
Strategic Planning
Technology & Software
Details the critical role of the nbn™ network in keeping users connected for entertainment and support during the pandemic, leading to many upgrading their plans.
COVID-19, nbn network, family connectivity, entertainment reliance, plan upgrades, pandemic response, user reliance, household data
Multiple Chart
Accenture
Saved
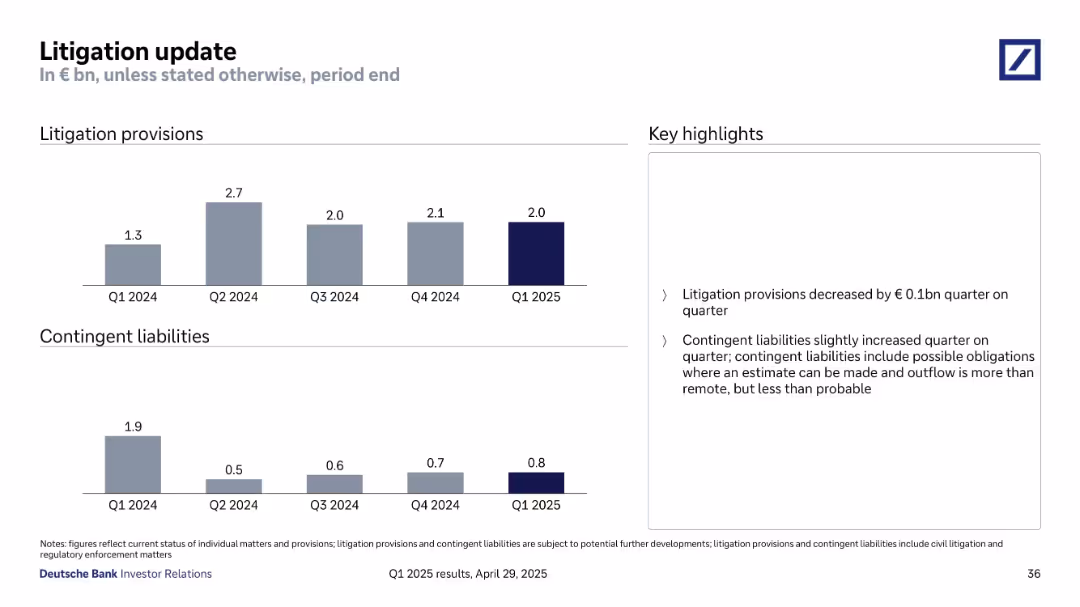
Bar charts display litigation provisions and contingent liabilities by quarter. Key highlights summarized in right-side text box.
Risk Assessment and Management
Financial Services
Deutsche Bank's legal risks are outlined through quarterly trends in litigation provisions and contingent liabilities from Q1 2024 to Q1 2025. The slide notes a slight decrease in provisions and a marginal increase in contingent liabilities, while emphasizing ongoing regulatory developments and potential obligations.
litigation, provisions, contingent liabilities, legal risk, compliance
Mixed Chart
Deutsche Bank
Saved
The slide displays a series of table and pie charts with financial data across various business segments. It uses a clean, corporate color scheme predominantly featuring blues and grays.
Financial Performance
Financial Services
Provides a comprehensive financial overview of the company, including a full year net revenue mix and comparisons of current and past fiscal quarters.
financial overview, revenue mix, net earnings, investment banking, asset management
Mixed Chart
Goldman Sachs
Saved
This slide presents four blocks of bullet points for future planning in retail. The colors are blue and white, giving a clean, corporate look.
Risk Assessment and Management
Retail & E-commerce
Suggesting key areas for businesses to focus on, including customer behaviors, technology, sustainability, and industry transformations in the face of future disruptions.
future planning, customer behaviors, technology, sustainability, industry transformations
Boxed
Bain
Saved
Previous
Next
If nothing, comes up, please save your slides first
Create a FREE account to continue browsing
Receive Instant Access to 1,000+ slides from companies like McKinsey, Google, and Goldman Sachs
First Name
Last Name
Email
Password
I agree to all
Terms & Privacy Policy
Thank you! Your submission has been received!
Oops! Something went wrong while submitting the form.
Have an account?
Sign in
Column Chart
Heatmap
Chevron
Org Chart
Infographic
Callouts
Timeline
List
Graphic
Picture
Process Flow
Diagram
Paragraph
Map
Table
Framework
Subtitle
Takeaway Box
Icon
Other Chart
Radar Chart
Waterfall Chart
Mekko Chart
Pie Chart
Scatter Plot
Line Chart
Bar chart
Bullet points