My Account
My Slides
Search by Category
Templates
Leave Feedback
Login
Logout
Get Started
Browse all Slides
Browse all Slides
Create a FREE Account
Instant access to 1,000+ real slides from top companies like McKinsey, BCG, Goldman Sachs, Google and many more!
First Name
Last Name
Email
Password
I agree to all
Terms & Privacy Policy
Thank you! Your submission has been received!
Oops! Something went wrong while submitting the form.
Have an account?
Sign in
Saved Slides
The slide features multiple column charts illustrating MENA IPO activity from Q1 2018 to Q4 2022, GCC IPOs, and non-GCC IPOs. The charts use purple and red to distinguish between proceeds and the number of IPOs.
Market Analysis and Trends
Financial Services
This slide provides a comprehensive snapshot of MENA IPO market activity from Q1 2018 to Q4 2022, including a breakdown of GCC and non-GCC IPOs. It presents trends in the number of IPOs and proceeds, highlighting significant fluctuations and market dynamics over the years.
IPO, MENA markets, financial services, market trends, GCC, non-GCC, market snapshot, financial data, proceeds, number of IPOs
Multiple Chart
EY
Saved
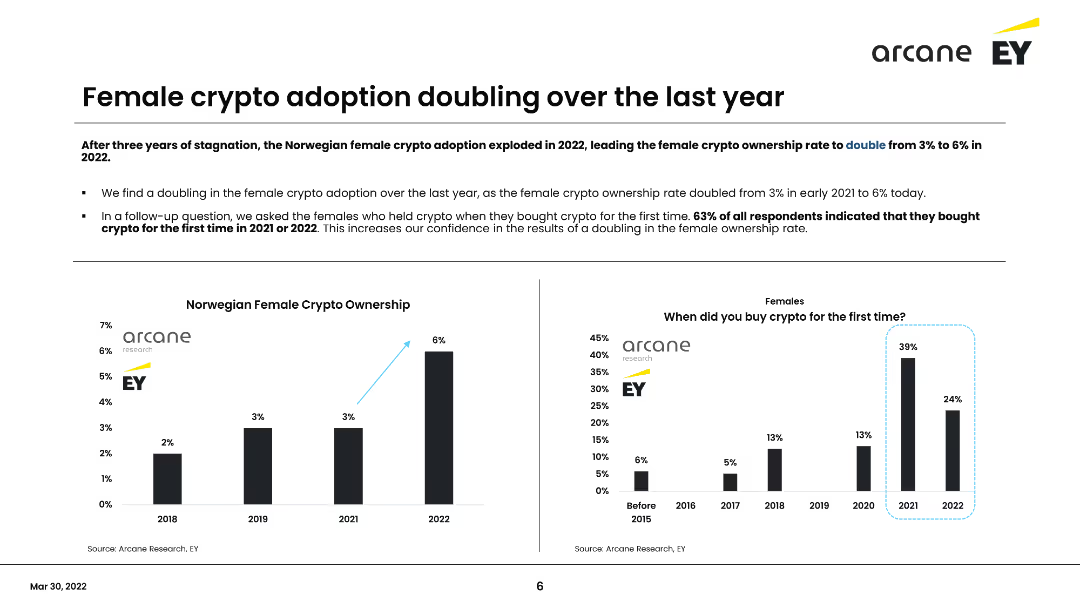
The slide contains a column chart showing the percentage of female crypto ownership from 2018 to 2022 and a survey on when females first bought crypto. It discusses the doubling of female crypto ownership in the past year and the implications of this trend.
Market Analysis and Trends
Financial Services
Discusses the doubling of female cryptocurrency ownership in Norway over the last year, highlighting survey findings that 63% of female respondents bought crypto for the first time in 2021 or 2022. Emphasizes the growing adoption among women.
Cryptocurrency, Female adoption, Norway, Survey, Trends
Multiple Chart
EY
Saved
The slide features pie charts showing the development of self-confidence, presentation skills, and business networking skills among care-experienced youth.
Client Case Studies
Education & Training
The slide presents the Beyond Your Limits program, which provides targeted support for care-experienced young people through skills training and mentoring.
Beyond Your Limits, care-experienced, skills training, mentoring
Multiple Chart
EY
Saved
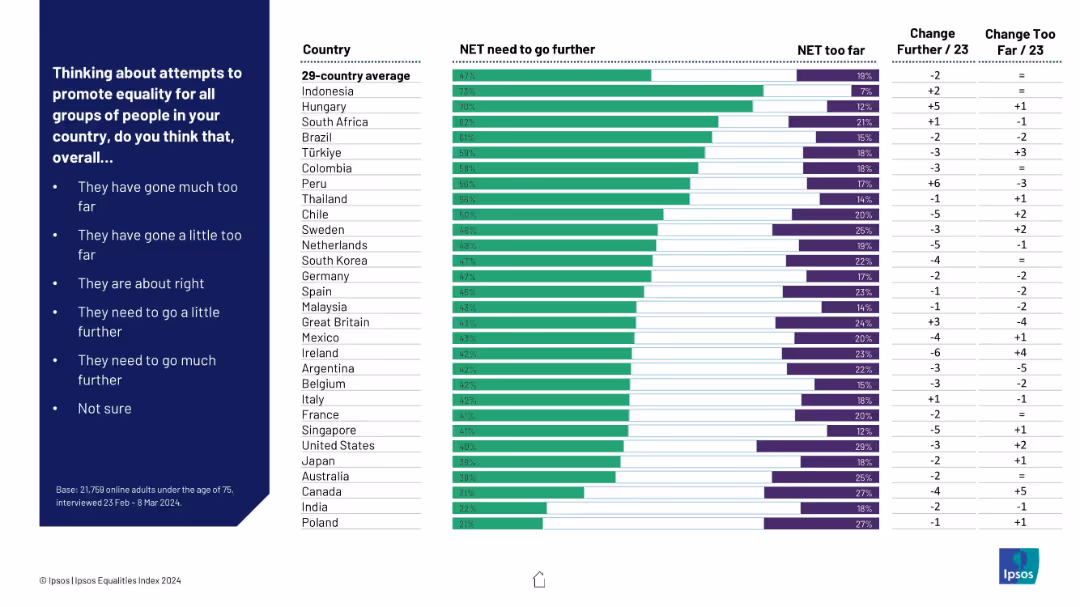
Bar chart ranking countries by agreement that “more needs to be done” vs. “gone too far”; green vs. purple bars; includes change from prior data.
Regulatory and Compliance
Government & Public Sector
This slide assesses global perceptions of efforts to promote equality. It shows which populations think more action is needed and where efforts are considered excessive, including directional trends over time.
equality efforts, too far, not enough, policy perception, international comparison, Ipsos, country ranking
Mixed Chart
IPSOS
Saved
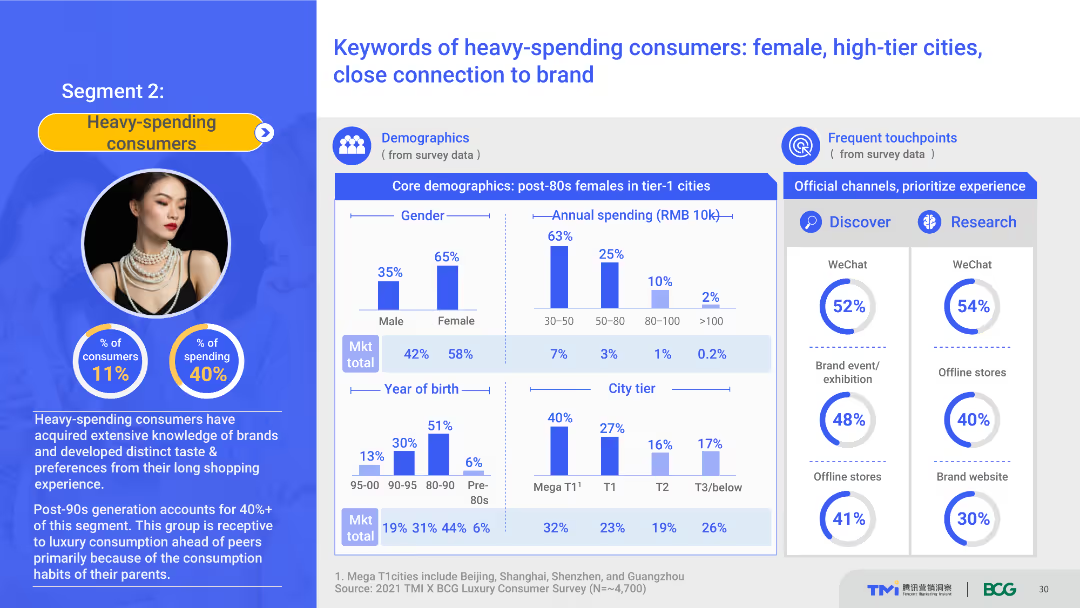
Several charts and graphs detailing demographics, spending patterns, and frequent touchpoints of heavy-spending consumers. The layout is dense with data, including pie charts and bar graphs.
Market Analysis and Trends
Consumer Goods
Provides an overview of the demographic and spending behavior of heavy-spending consumers in high-tier cities. Emphasizes the importance of WeChat as a touchpoint and the close brand connections of this consumer segment.
Heavy-spending consumers, demographics, high-tier cities, WeChat, brand connection
Multiple Chart
BCG
Saved
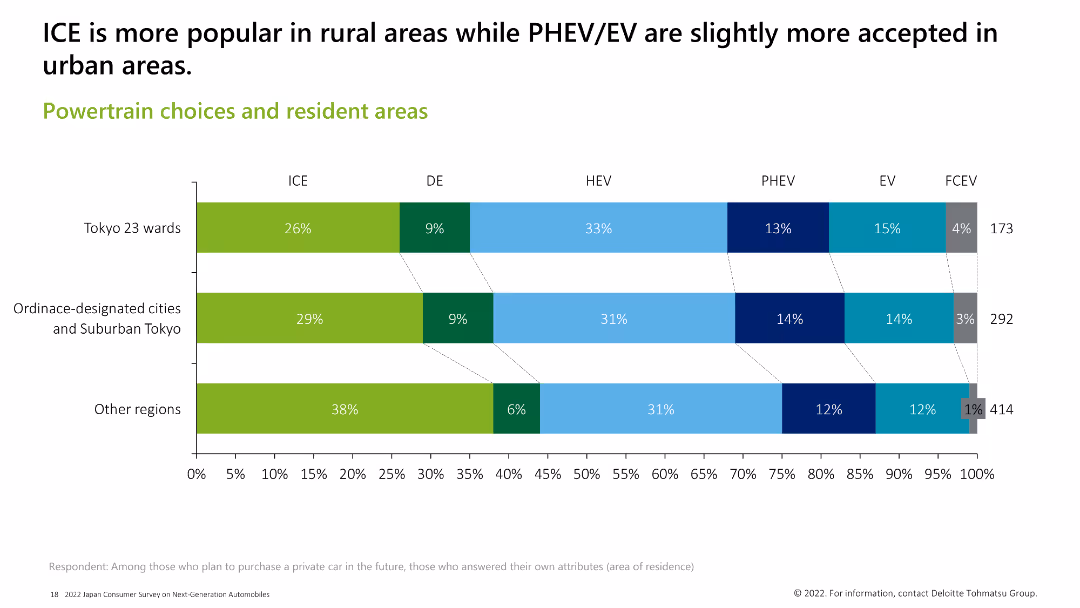
Horizontal bar chart showing the popularity of different powertrain types across various residential areas. ICE is more popular in rural areas, while PHEV and EV are slightly more accepted in urban areas.
Market Analysis and Trends
Transportation & Logistics
The slide presents the distribution of powertrain preferences among residents in different areas, showing that ICE is more popular in rural regions, whereas PHEV and EV have higher acceptance in urban settings.
powertrain, resident areas, ICE, PHEV, EV, rural, urban
Single Chart
Deloitte
Saved
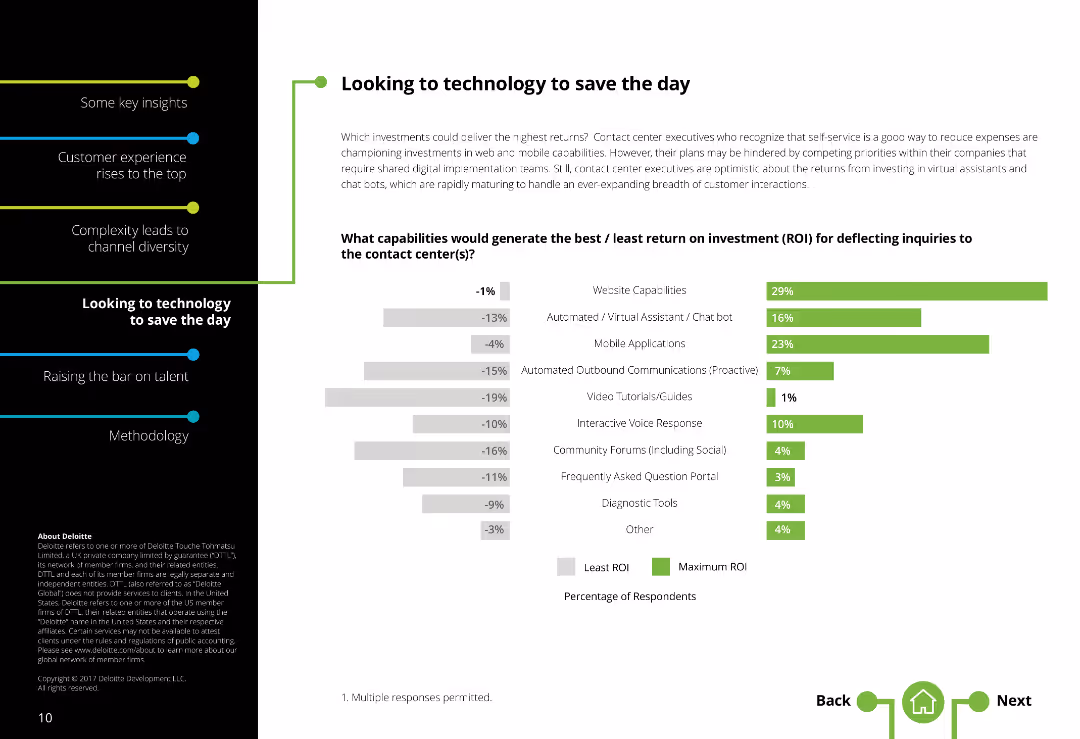
Two-column layout with text on the left and a bar chart depicting ROI on the right. There is a moderate amount of text.
Market Analysis and Trends
Technology & Software
Evaluates which technologies provide the best and least return on investment (ROI) for contact centers, highlighting mobile applications, chatbots, and web capabilities.
ROI, Technology investments, Contact centers, Web capabilities, Mobile applications, Chatbots, Cost reduction
Multiple Chart
Deloitte
Saved
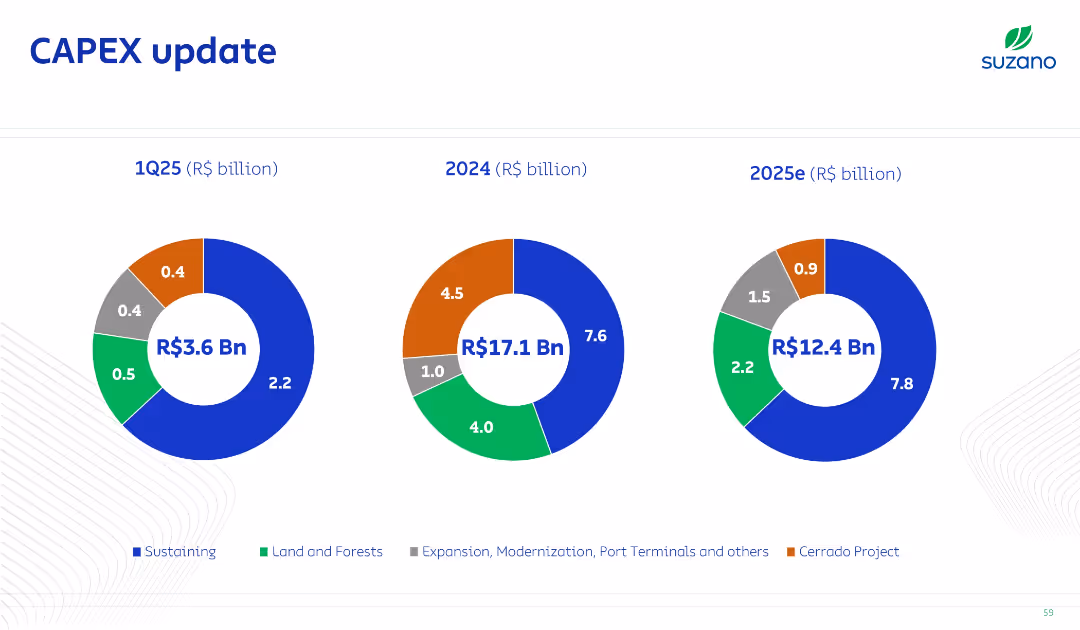
Three circular donut charts representing CAPEX breakdown for 1Q25, 2024, and 2025e; each segment color-coded by category (sustaining, land, projects, etc.).
Strategic Planning
Consumer Goods
This slide outlines Suzano’s capital expenditure plans by year and category, indicating major investments in sustaining operations and the Cerrado project. It emphasizes planned infrastructure and environmental allocations.
CAPEX, Investment, Forecast, Cerrado, Sustaining
Single Chart
Goldman Sachs
Saved
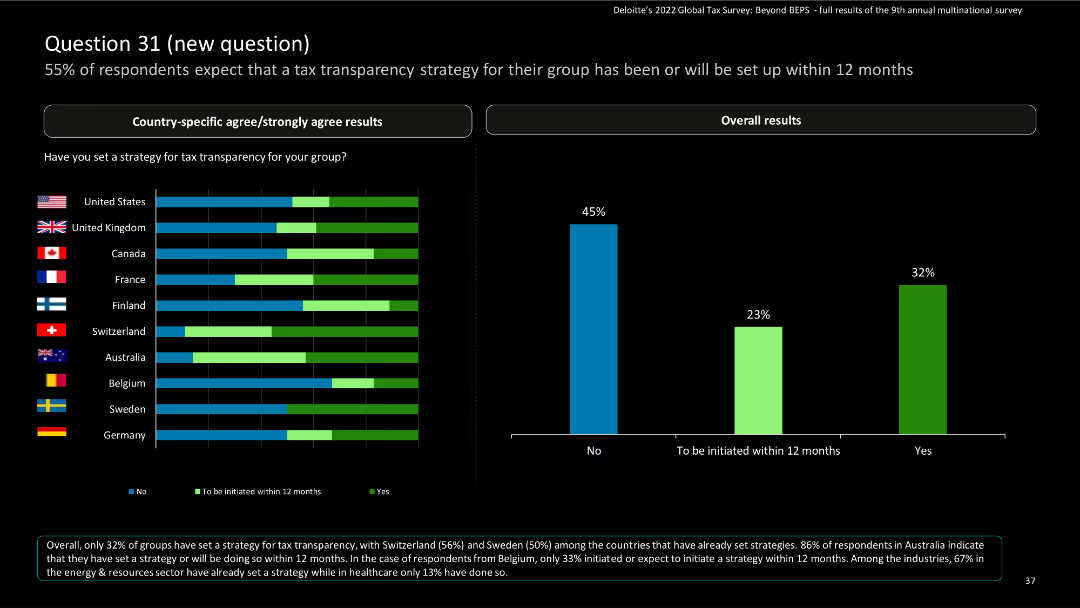
Contains horizontal bar charts for country-specific results and column charts for overall results on setting tax transparency strategies.
Market Analysis and Trends
Financial Services
The slide details the expectations for setting tax transparency strategies within 12 months, with country-specific and overall data.
survey, bar charts, tax transparency, strategies
Multiple Chart
Deloitte
Saved
This slide displays a large, central pie chart with vibrant colors, surrounded by smaller high-quality images of buildings. The chart highlights the proportion of companies planning to invest in real estate despite market volatility, which is visually emphasized by the use of contrasting colors.
Investment Analysis
Real Estate & Construction
It captures the strategic decisions companies are making regarding real estate investments in light of inflation and interest rate changes. The chart is used to represent the distribution of different strategic choices, indicating a significant tilt towards investment, and is useful for discussions on market responses.
Investment Strategy, Real Estate, Inflation, Interest Rates, Market Trends
Single Chart
EY
Saved
A radar chart comparing various aspects like employee training, customer experience, and data sovereignty between leaders and laggards. The layout is balanced with text on one side and chart on the other.
Strategic Planning
Professional Services
This slide discusses how leaders create value by focusing on areas such as employee training and data sovereignty. The radar chart highlights differences between leaders and laggards.
Leadership, Employee Training, Data Sovereignty, Customer Experience, Innovation
Mixed Chart
Accenture
Saved
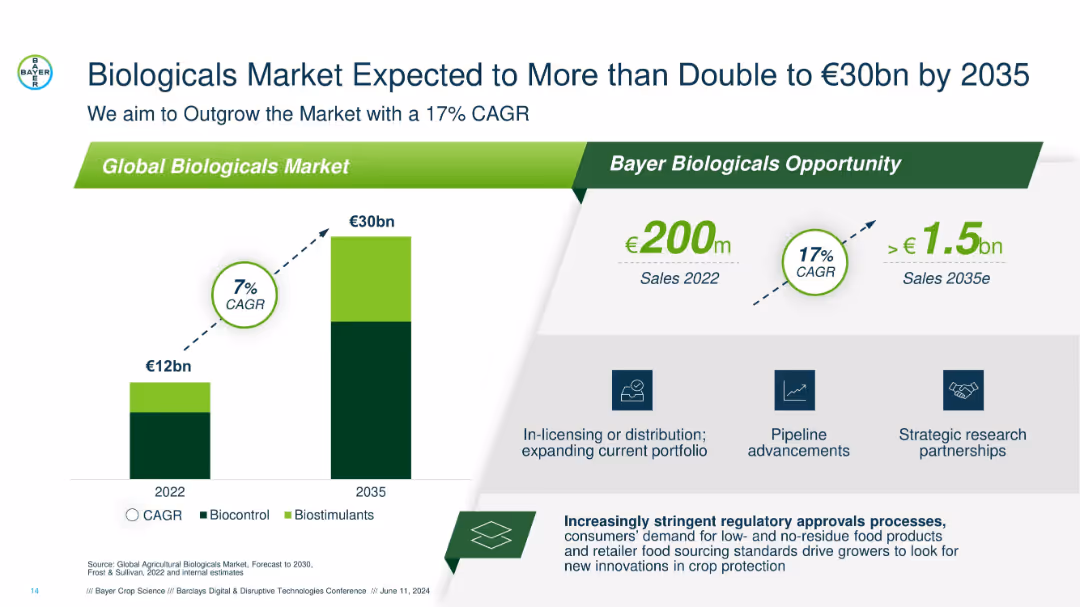
Dual-bar growth chart on the left and opportunity callouts on the right; clean layout with dark green and grey accents.
Market Analysis and Trends
Agriculture & Food Production
Illustrates the projected growth of the global biologicals market from €12bn in 2022 to €30bn in 2035, highlighting Bayer’s 17% CAGR goal and strategies like partnerships and pipeline advancements.
biologicals, CAGR, Bayer, 2035 forecast, market growth, biocontrol, biostimulants, partnerships, pipeline
Mixed Chart
Barclays
Saved
Slide with five sets of column charts displaying 'Floating Loan Mix', 'Strong Retail Franchise', 'S&P Debt Ratings', and 'Core NIM' data. The charts compare TFC with peer medians and averages, using shades of purple and teal.
Risk Assessment and Management
Financial Services
The slide presents data on how the company manages interest rate risk, with comparisons to industry peers. It offers a look into various financial metrics that indicate the company's strategic positioning in terms of debt ratings and net interest margin.
Interest Rate, Risk Management, Financial Metrics, Debt Ratings, Net Interest Margin
Multiple Chart
Goldman Sachs
Saved
Slide presents a bar chart comparing the market share of the top 10 companies in internet advertising revenue from 2018 to 2020.
Market Analysis and Trends
Media & Entertainment
Analyzes the increasing market share of the top 10 internet advertising companies over three years, highlighting their growing dominance in the industry.
advertising, revenue, market share, top companies, growth, internet, 2020, media, technology
Single Chart
PwC/Strategy&
Saved
Bubble chart displaying Scandinavian revenue growth in various media segments from 2018 to 2023. Bubbles of different sizes represent revenue growth in millions USD.
Market Analysis and Trends
Media & Entertainment
This slide analyzes revenue growth across different media segments in Scandinavia, focusing on the significant growth in OTT video and internet access.
revenue growth, Scandinavian market, OTT video, video games, 2018-2023
Multiple Chart
PwC/Strategy&
Saved
The slide features a diagram illustrating Ipsos's reputation and policy legislation intelligence platform, highlighting data sources, analytics, and actionable alerts.
Technology and Digital Transformation
Technology & Software
It details Ipsos’s AI and advanced analytics platforms, explaining how they help clients sense and respond in real time using various data sources and technologies.
AI, analytics, Ipsos, data, real-time response
Linear Flow
IPSOS
Saved
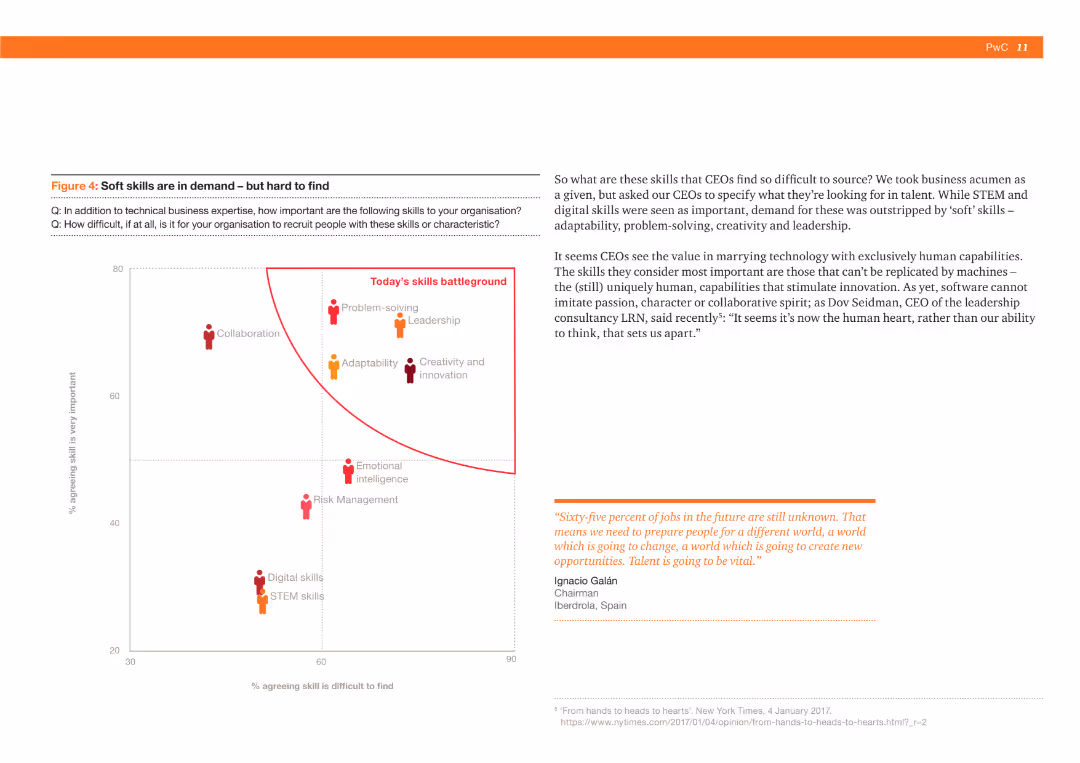
A scatter plot comparing the importance and difficulty of finding various skills like collaboration, problem-solving, and adaptability, with a focus on soft skills. Includes a quote about the future of jobs.
Human Resources and Talent Management
Professional Services
The slide discusses the challenge of finding soft skills, emphasizing their importance over technical skills, supported by a comparison chart and industry quotes.
Soft skills, Collaboration, Problem-solving, Adaptability, Leadership, Skills demand, Recruitment, Talent, Future jobs, Importance
Mixed Chart
PwC/Strategy&
Saved
The slide includes a donut chart displaying responses to a true/false question about the safety of company stocks versus mutual funds. The layout is moderately complex.
Market Analysis and Trends
Financial Services
This slide evaluates the perception of the safety of investing in company stocks versus mutual funds, showing that 51% correctly identified mutual funds as generally safer. It aims to assess investment knowledge.
stocks, mutual funds, safety, perception, investment
Single Chart
IPSOS
Saved
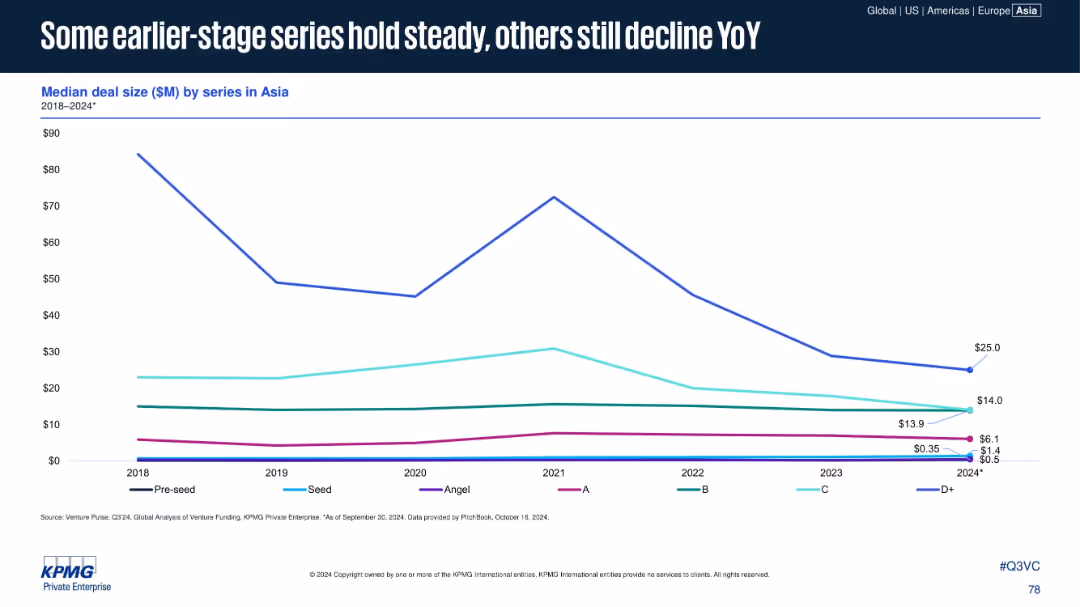
Line chart tracking median deal size by series (Pre-seed to D+) in Asia. Clean white background, each series line distinct in color.
Performance Metrics and KPIs
Financial Services
Examines annual median deal size across funding series in Asia. Later-stage rounds like D+ have declined significantly, while early stages (Angel, A) show minor fluctuations. Offers insight into shifting investor behavior.
Series A-D+, Angel, Seed, Pre-seed, Asia, VC Deal Sizes, YoY Decline
Single Chart
KPMG
Saved
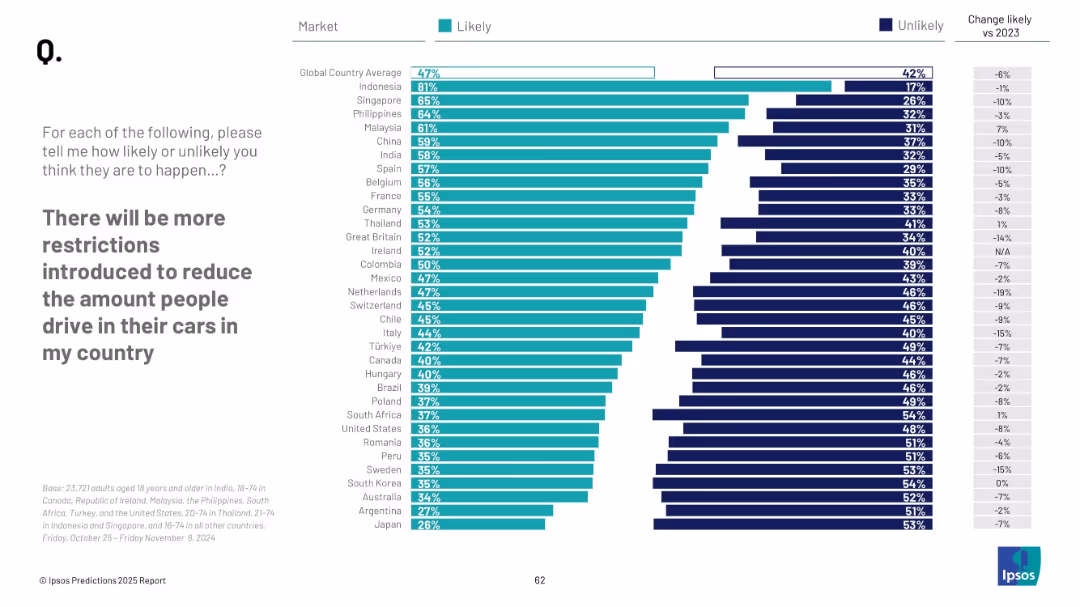
Bar chart with countries listed on the Y-axis; Likely (green) and Unlikely (blue) horizontal bars; change vs. 2023 shown on right. Clean, minimalist layout with sans-serif font.
Market Analysis and Trends
Environmental Services & Sustainability
The slide compares public perceptions across countries on the likelihood of more car-use restrictions being introduced. Indonesia leads with the highest belief in restrictions, while Japan and Argentina show the lowest. The slide tracks shifts from 2023 to 2024.
restrictions, car usage, sustainability, global comparison, public opinion, climate, 2025 forecast, transport policy, Ipsos, perception shift
Mixed Chart
IPSOS
Saved
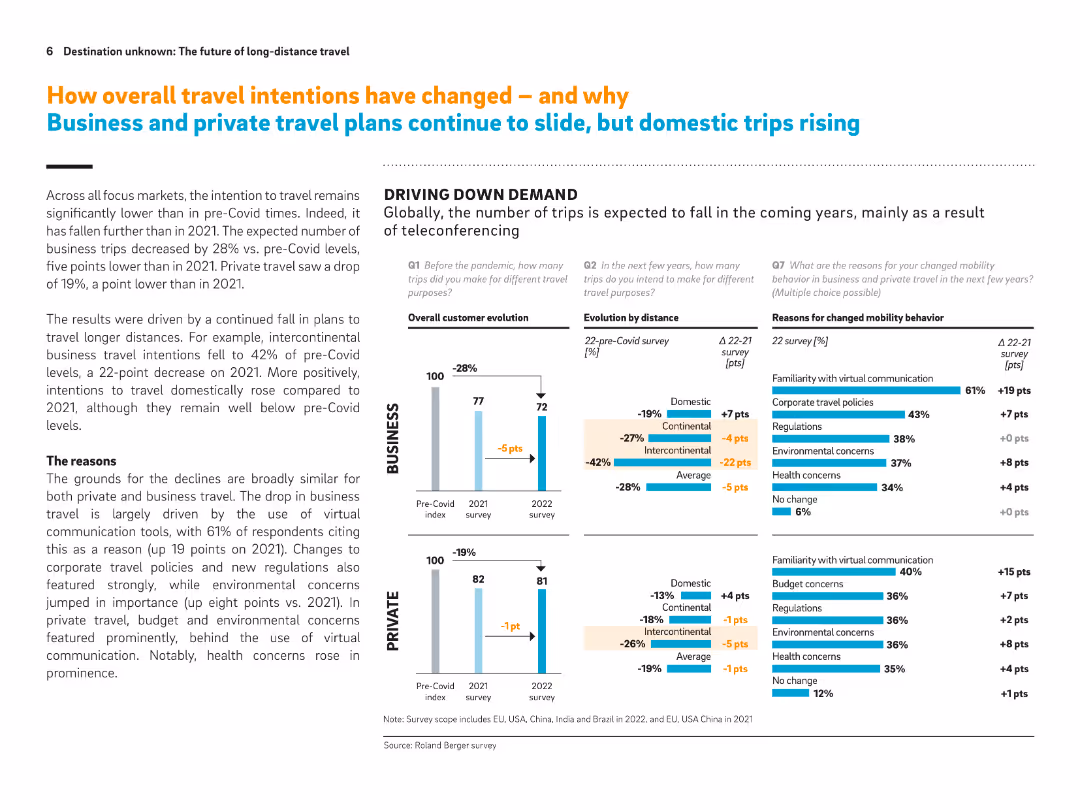
Split between text explanation and bar graphs; visualizes pre- and post-Covid travel trends for business and private sectors, showing drivers like virtual communication and policy changes.
Market Analysis and Trends
Transportation & Logistics
This slide shows that business travel is expected to fall significantly due to virtual communication, regulations, and environmental concerns. Private travel also declines but less sharply. Domestic travel shows some resilience. Key reasons are clearly visualized.
Travel intentions, business travel decline, private travel, virtual tools, environmental concerns, domestic travel, teleconferencing
Multiple Chart
Roland Berger
Saved
The slide features a mix of a large image on the left and column charts on the right. The charts show percentages of compliance budget allocations and anticipated changes over the next two years.
Regulatory and Compliance
Financial Services
The slide discusses the increased compliance budgets for hedge funds due to regulatory requirements, with detailed statistics on current budget allocations and future expectations.
compliance, regulatory, hedge funds, budget, chart
Multiple Chart
EY
Saved
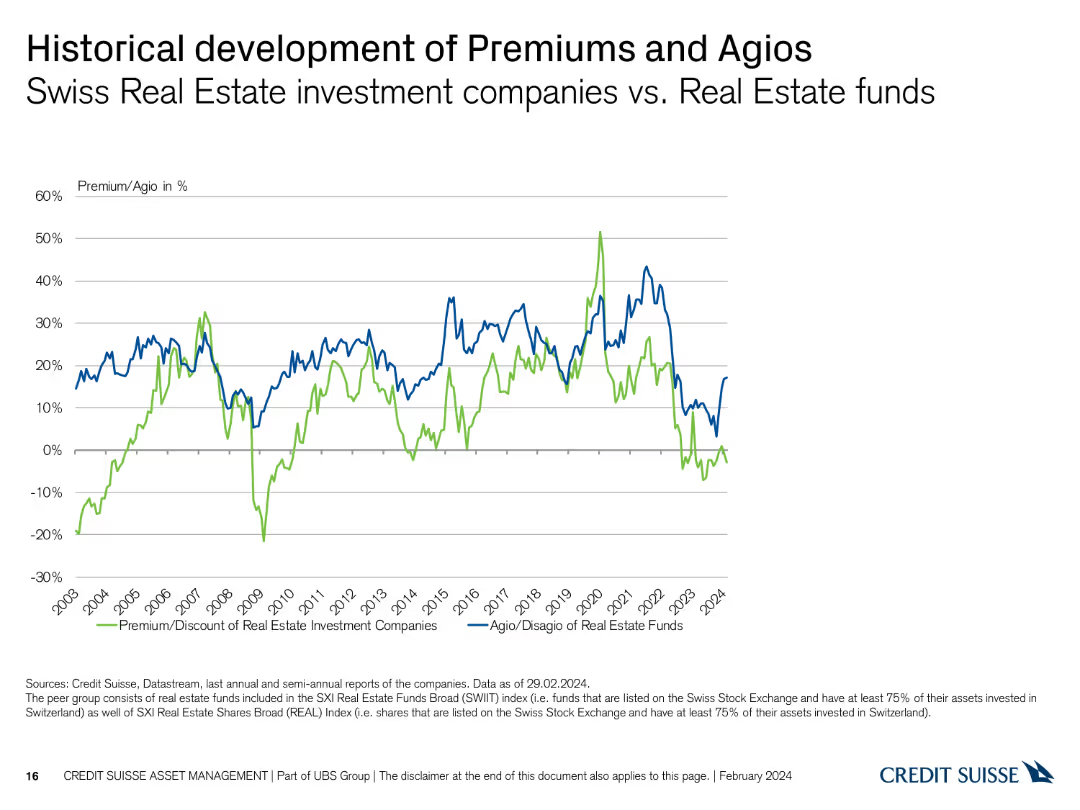
This slide features a line chart depicting the historical development of premiums and agios for Swiss Real Estate investment companies versus Real Estate funds.
Market Analysis and Trends
Real Estate & Construction
It compares historical premium and agio rates, providing insights into market trends and performance over time in the Real Estate sector.
historical trends, premiums, agios, Real Estate, investment companies, funds
Single Chart
Credit Suisse
Saved
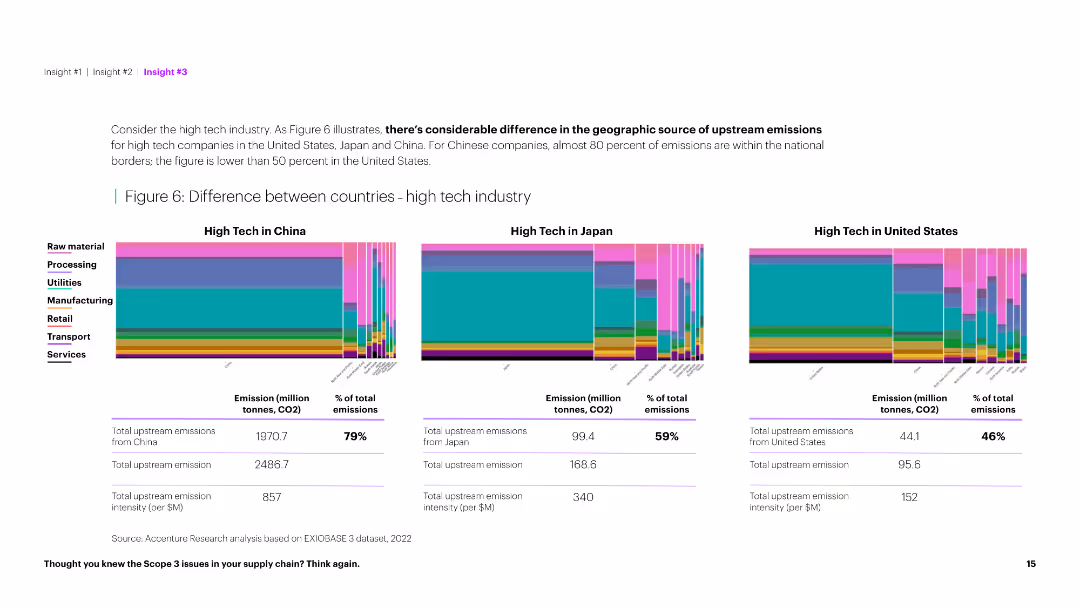
The slide features column charts comparing upstream emissions in the high tech industry across China, Japan, and the US, along with summary tables below.
Market Analysis and Trends
Technology & Software
This slide illustrates the significant differences in upstream emissions in the high tech industry among China, Japan, and the US, providing a comparative analysis.
High tech, emissions, country comparison, China, Japan, US, upstream, industry analysis, environmental impact, data visualization, sustainability
Multiple Chart
Accenture
Saved
Features a complex layout with multiple bar charts showing the percentage of companies using strategies to promote acceptance of climate-related changes.
Strategic Planning
Environmental Services & Sustainability
Details the percentage of companies implementing strategies to enhance acceptance of their climate change efforts, segmented by company size and revenue.
climate strategies, business strategy, customer engagement, environmental initiatives
Multiple Chart
Deloitte
Saved
Previous
Next
If nothing, comes up, please save your slides first
Create a FREE account to continue browsing
Receive Instant Access to 1,000+ slides from companies like McKinsey, Google, and Goldman Sachs
First Name
Last Name
Email
Password
I agree to all
Terms & Privacy Policy
Thank you! Your submission has been received!
Oops! Something went wrong while submitting the form.
Have an account?
Sign in
Column Chart
Heatmap
Chevron
Org Chart
Infographic
Callouts
Timeline
List
Graphic
Picture
Process Flow
Diagram
Paragraph
Map
Table
Framework
Subtitle
Takeaway Box
Icon
Other Chart
Radar Chart
Waterfall Chart
Mekko Chart
Pie Chart
Scatter Plot
Line Chart
Bar chart
Bullet points