My Account
My Slides
Search by Category
Templates
Leave Feedback
Login
Logout
Get Started
Browse all Slides
Browse all Slides
Create a FREE Account
Instant access to 1,000+ real slides from top companies like McKinsey, BCG, Goldman Sachs, Google and many more!
First Name
Last Name
Email
Password
I agree to all
Terms & Privacy Policy
Thank you! Your submission has been received!
Oops! Something went wrong while submitting the form.
Have an account?
Sign in
Saved Slides
Slide contains three column charts displaying financial performance over time, including changes in revenue, loan growth, and market share between 2015 and 2016 among major competitors. Colored in various shades of blue, and includes key textual annotations for clarity.
Financial Performance
Financial Services
Focuses on the financial performance and market position of Citigroup's branded cards. It highlights revenue growth, loan volume increases, and market share against competitors, using a projected CAGR through 2020. Designed to emphasize the strength and growth potential of Citigroup's card services.
financial growth, market share, revenue, loans, branded cards
Multiple Chart
Citigroup
Saved
Contains column charts, textual information, and bullet points highlighting key metrics, with a dashed outline box.
Financial Performance
Financial Services
Slide shows strong performance and inflows in asset and wealth management, with a focus on alternatives fundraising surpassing targets. Likely used in investor relations or financial strategy meetings.
Fundraising, Asset Management, Performance, Inflows
Mixed Chart
Goldman Sachs
Saved
The slide features a column chart showing the year-on-year growth in capital importation by sector for Q3 2023. It contrasts significant growth in manufacturing with declines in banking, financing, ICT, and trading sectors.
Market Analysis and Trends
Financial Services
This slide presents the year-on-year changes in capital flows to various sectors, highlighting the substantial increase in manufacturing and declines in banking, financing, ICT, and trade. It provides insights into sectoral performance and investment trends.
capital flows, manufacturing, banking, financing, ICT, trade
Mixed Chart
PwC/Strategy&
Saved
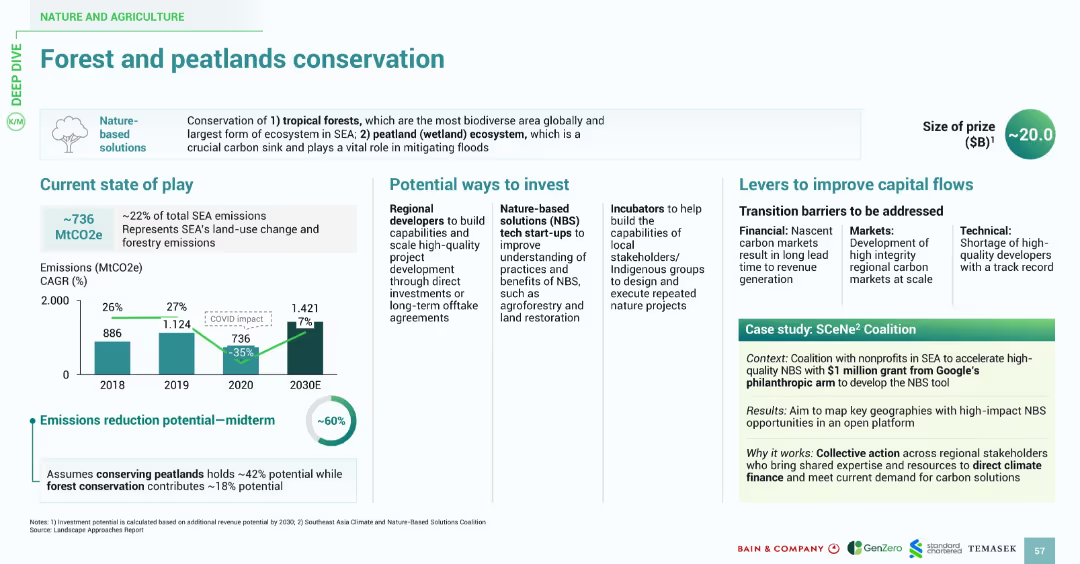
Balanced layout with emissions chart, investment options, capital flow challenges, and case study. Emphasizes visuals and consistent iconography for nature-based solutions.
Regulatory and Compliance
Environmental Services & Sustainability
This slide addresses the importance of conserving tropical forests and peatlands in SEA, representing 22% of SEA emissions. It shows midterm emissions reduction potential of ~60%. Investment suggestions include supporting local stakeholders and tech startups focused on land restoration. A case study of the SCeNe² Coalition highlights coalition-driven regional efforts funded by Google’s philanthropy arm.
forests, peatlands, conservation, emissions, SCeNe², NBS, land restoration, SEA
Multiple Chart
Bain
Saved
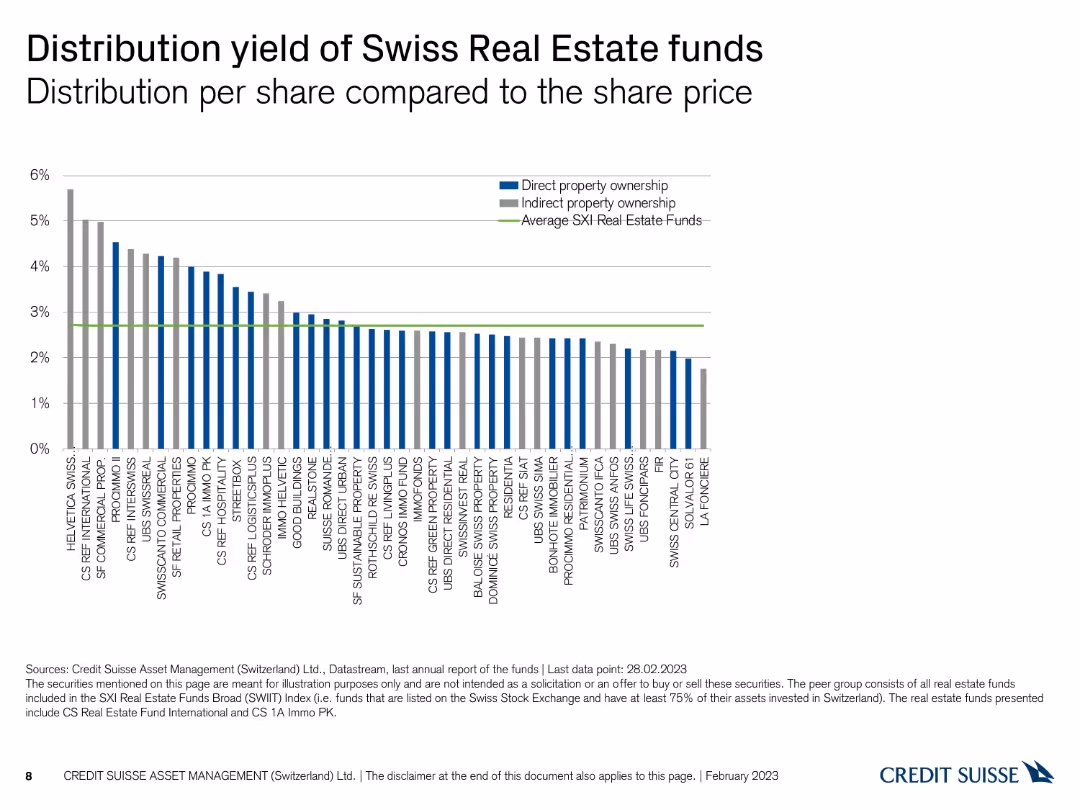
The slide presents a column chart comparing the distribution yield per share of Swiss real estate funds.
Financial Performance
Real Estate & Construction
This slide compares the distribution yield of Swiss real estate funds per share, highlighting differences among funds.
Swiss real estate, distribution yield, comparison, column chart, share price
Single Chart
Credit Suisse
Saved
Contains icons and brief text blocks in a clean layout highlighting key opportunities for SEA in sustainability sectors like energy, nature, and corporate structure.
Market Analysis and Trends
Environmental Services & Sustainability
Discusses SEA's potential for sustainability leadership, focusing on renewable energy, infrastructural improvements, and corporate roles in sustainability, targeting business strategists and environmental advocates.
SEA, sustainability, renewable energy, corporate strategies, icons, opportunities, market analysis, text blocks, clean layout
Pillar
Bain
Saved
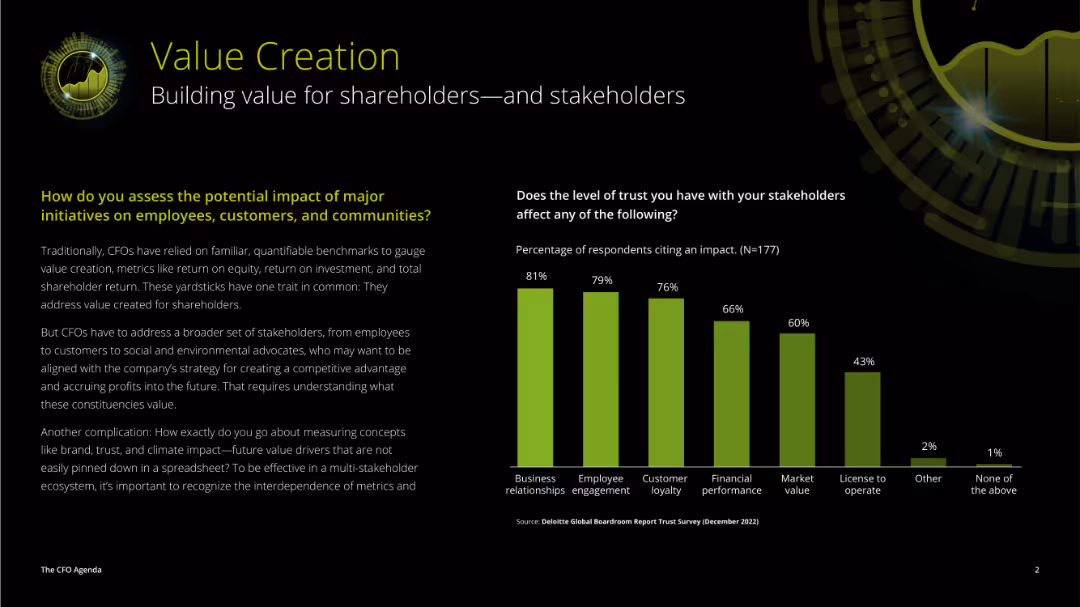
The slide features a mix of text and a vertical column chart. The left side has detailed paragraphs discussing value creation, while the right side presents a chart showing the impact of trust on various factors.
Strategic Planning
Professional Services
This slide addresses the impact of major initiatives on various stakeholders and the importance of trust in influencing business relationships, employee engagement, and financial performance.
value creation, trust, stakeholders, impact, initiatives, business relationships, employee engagement, financial performance
Mixed Chart
Deloitte
Saved
Descriptive graphs showing six OEM archetypes with details on BEV starting points, market shares, and primary markets. Each archetype is color-coded and has comparative bars.
Competitive Landscape
Transportation & Logistics
Details various OEM archetypes and their initial market positions in the electric vehicle sector, focusing on differences in strategy and market share from 2022 to 2030.
OEM, archetypes, BEV, market position, strategy
Multiple Chart
BCG
Saved
This slide features a treemap chart that shows the percentage of global GHG emissions by different sectors. Each sector is color-coded and divided into sub-sectors. The layout is dense with a lot of information compactly displayed.
Industry Overview
Environmental Services & Sustainability
The slide illustrates the contribution of various sectors, such as power, industrials, transport, and agriculture, to global greenhouse gas emissions in 2019. It highlights that these sectors are responsible for over 80% of total emissions.
GHG emissions, sectors, treemap, power, transport
Single Chart
BCG
Saved
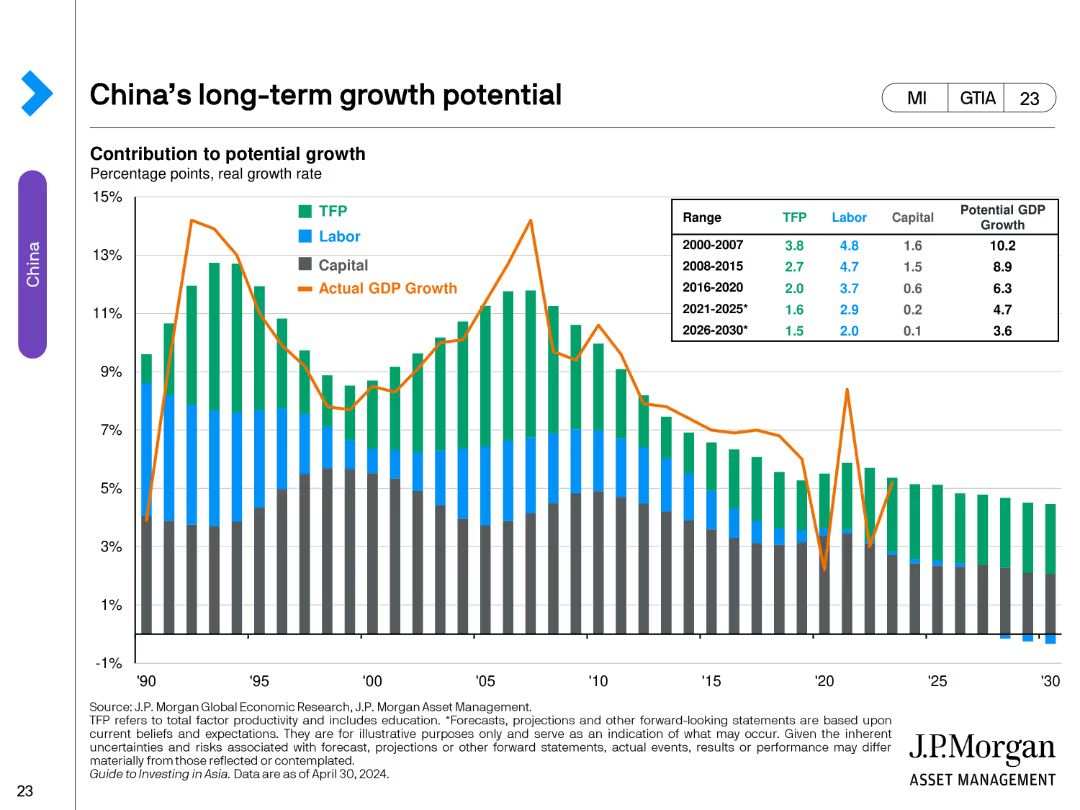
The slide contains a stacked bar chart showing the contribution to potential GDP growth in China from TFP, labor, and capital, alongside actual GDP growth from 1990 to 2030. The chart includes a table summarizing growth rates in various periods.
Market Analysis and Trends
Financial Services
This slide assesses China's long-term economic growth potential, breaking down contributions from total factor productivity (TFP), labor, and capital. It contrasts these with actual GDP growth over time, providing forecasts for future growth rates.
China, GDP, growth, potential, TFP, labor, capital, economic forecast, stacked bar chart, financial services
Single Chart
JP Morgan
Saved
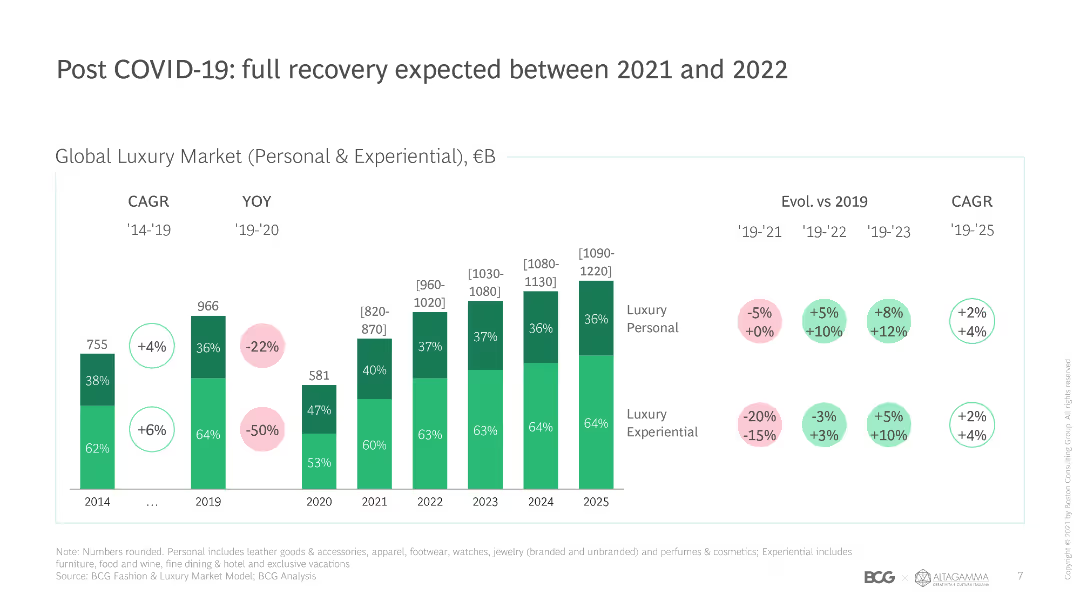
This slide features a column chart comparing global luxury market size and growth rates from 2014 to 2025, with color-coded segments for personal and experiential luxury.
Market Analysis and Trends
Retail & E-commerce
The slide projects the recovery of the global luxury market post-COVID-19, highlighting growth rates and market size for personal and experiential luxury segments.
COVID-19 recovery, luxury market, growth rates, market size, experiential luxury, personal luxury, global trends, projections, CAGR
Single Chart
BCG
Saved
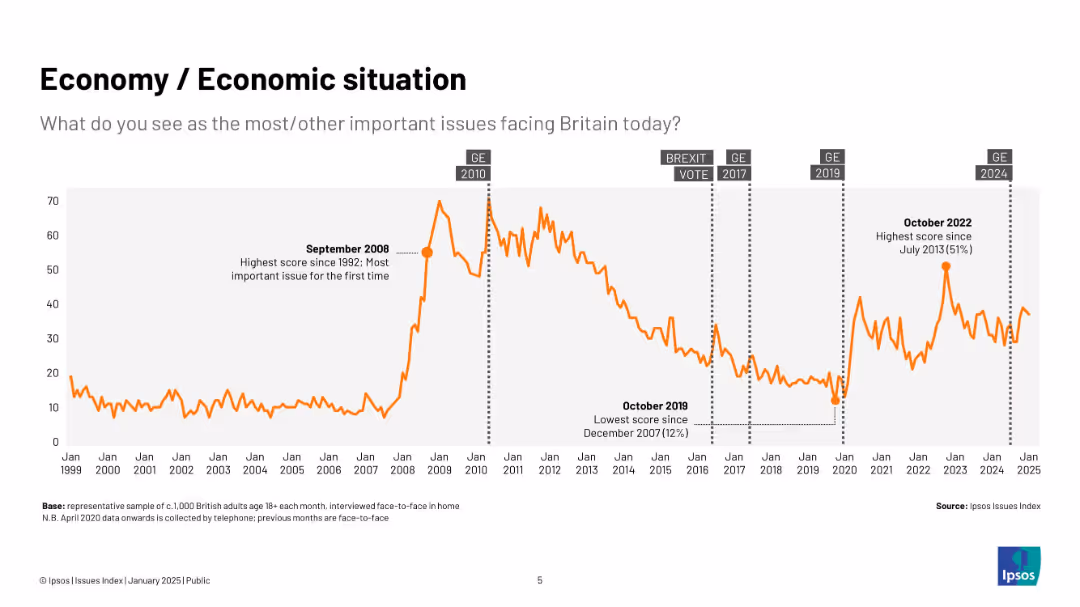
Line chart (1999–2025) tracking public concern over economic issues with key annotations like elections
Market Analysis and Trends
Government & Public Sector
This slide focuses solely on the economy, charting public concern since 1999. Peaks correspond with major events like the 2008 crisis and 2022 inflation spikes. Election dates are marked for reference.
economy, UK, public concern, Ipsos, inflation, crisis, timeline, elections, recession, graph
Single Chart
IPSOS
Saved
A slide that creatively integrates textual content with imagery, highlighting the company's purpose and core values, alongside an inspiring action shot of an employee.
Strategic Planning
Professional Services
Communicates the company's core values and purpose, linking their aspirations to tangible actions and societal impact.
Purpose, Values, Integrity, Service, Innovation
Text Only
Booz Allen Hamilton
Saved
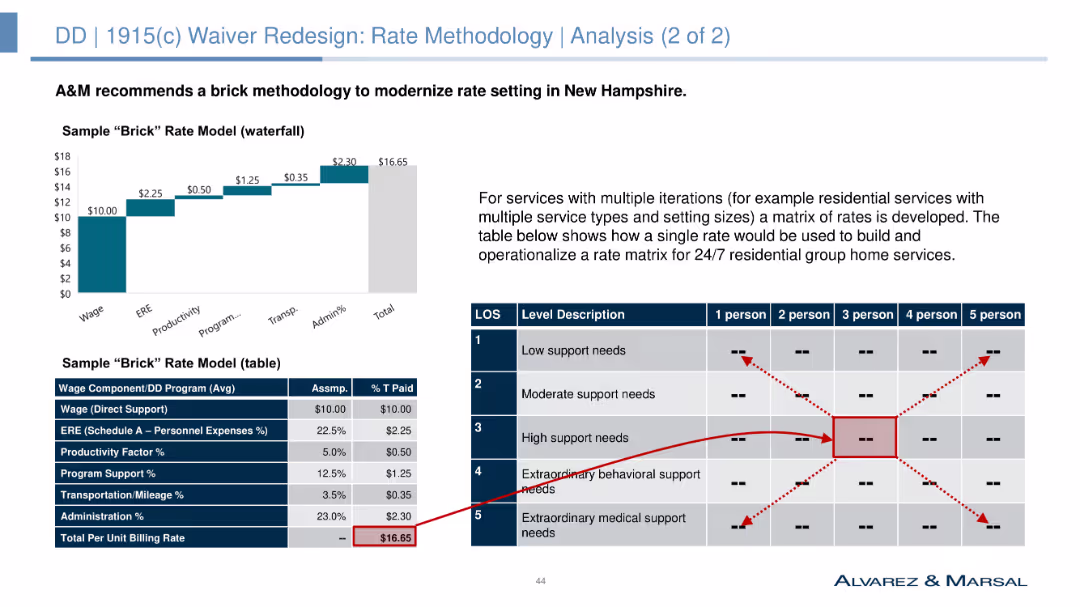
Column chart and table showing a sample "brick" rate model for various residential service types.
Market Analysis and Trends
Government & Public Sector
Recommends a "brick" rate methodology to modernize rate setting in New Hampshire, providing a sample rate model for different residential service types and their respective costs.
rate methodology, brick model, residential services, cost analysis, NH's DD population, funding models, strategic planning, rate setting
Mixed Chart
Alvarez & Marsal
Saved
The slide includes three donut charts representing the impact of the Great Resignation on different experience levels across total, hedge fund, and private equity sectors. An image on the left shows a meeting setting. The charts use shades of orange and red.
Human Resources and Talent Management
Financial Services
The slide discusses how the Great Resignation has most affected employees with 4-10 years of experience and highlights concerns about employee turnover rates among managers and investors.
Great Resignation, employee turnover, talent management, hedge fund, private equity
Multiple Chart
EY
Saved
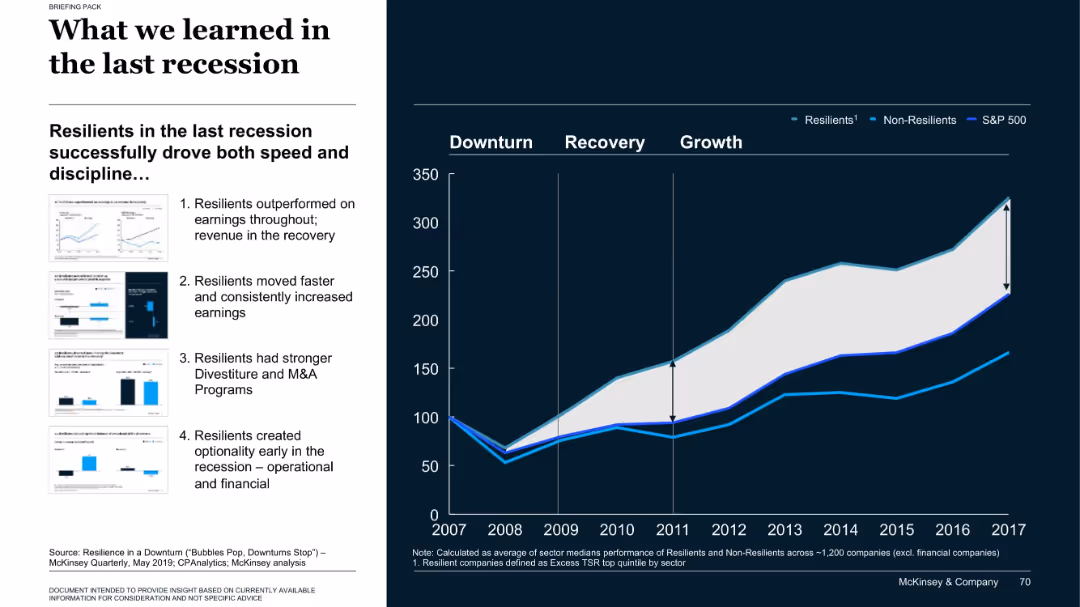
Left side text and thumbnails; right side line chart comparing company performance categories post-2008
Strategic Planning
Professional Services
The slide compares resilient vs. non-resilient companies during the 2008 recession, showing how resilient firms recovered faster and achieved higher long-term returns. Four key behaviors are outlined on the left that contributed to resilience.
recession, resilience, M&A, company performance, S&P 500
Mixed Chart
McKinsey
Saved
Six icons representing megatrends from 1 to 6, each with a brief description and keywords below: People & Society, Health & Care, Environment & Resources, Economics & Business, Technology & Innovation, Politics & Governance.
Strategic Planning
Financial Services
The slide outlines six major trends that will shape global development until 2050, covering areas such as society, health, environment, economy, technology, and politics. It highlights the importance of these trends for strategic planning and long-term forecasting in various industries.
Megatrends, 2050, Strategic Planning
Pillar
Roland Berger
Saved
Three-column layout with icons and text blocks highlighting cost management, collaboration, and healthcare access.
Strategic Planning
Healthcare & Pharmaceuticals
This slide discusses the strategic priorities for hospitals in APAC, including cost management and MedTech collaboration.
strategic priorities, hospitals, healthcare, APAC, MedTech
Pillar
LEK
Saved
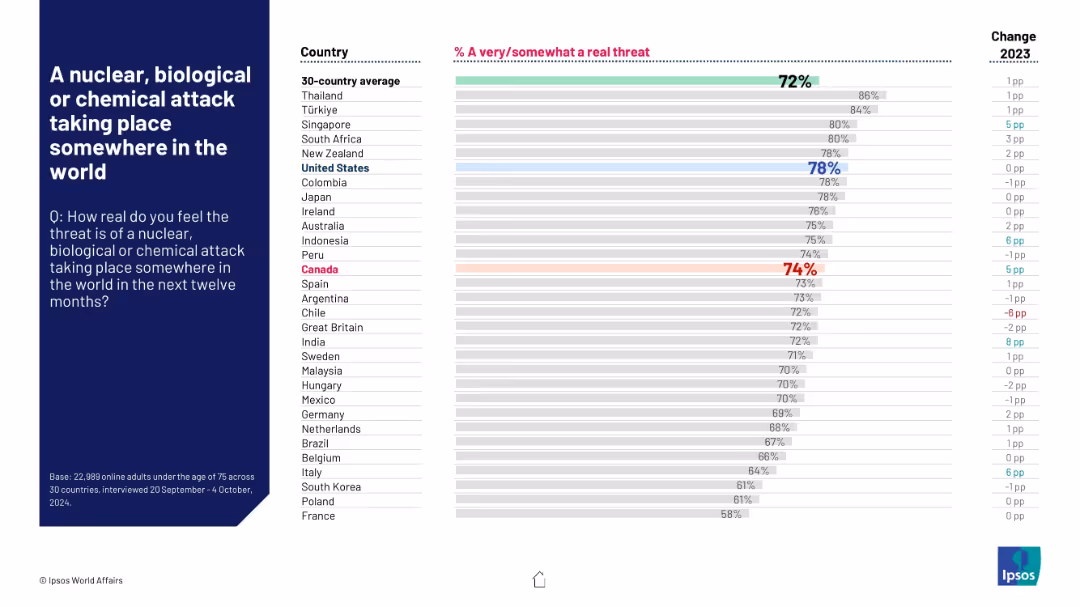
Horizontal bar chart ranking countries on perceived threat likelihood; global average at top, key changes noted on right.
Risk Assessment and Management
Government & Public Sector
This slide explores global perceptions of the risk of large-scale attacks using nuclear, biological, or chemical weapons. Türkiye, Singapore, and Thailand show the highest concern. The global average is 72%, and many countries report rising fear compared to 2023.
NBC threat, public fear, security concern, geopolitical risk, Ipsos, global threat perception, 2024 forecast, year-over-year change, global risks
Mixed Chart
IPSOS
Saved
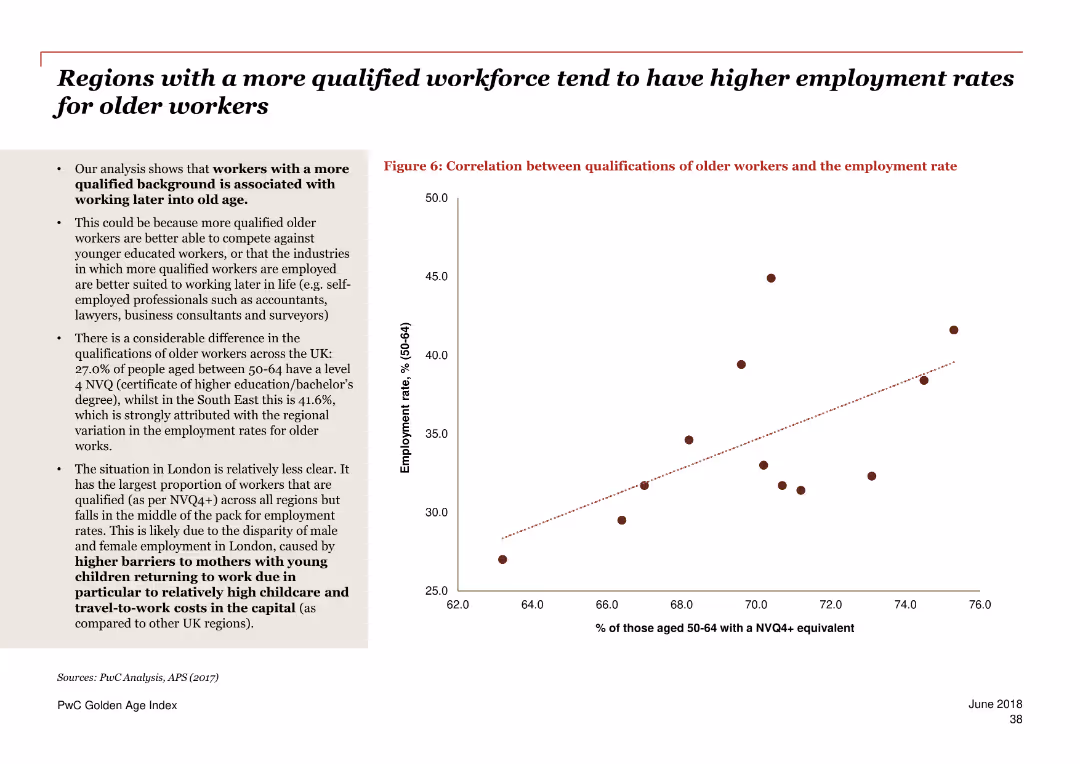
The slide features a scatter plot chart showing the correlation between the qualifications of older workers and their employment rates in various UK regions. Text sections provide further analysis and context.
Market Analysis and Trends
Government & Public Sector
The slide explores the relationship between higher qualifications and employment rates among older workers in the UK. It discusses how better qualifications can lead to higher employment rates and highlights regional differences.
qualifications, employment rates, older workers, UK, correlation, regional differences, education, analysis
Mixed Chart
PwC/Strategy&
Saved
A donut chart dominates the slide, showcasing the distribution of a firm's investment platform across various asset classes, complemented by performance metrics on the right.
Investment Analysis
Financial Services
The slide indicates a financial firm’s asset and wealth management capabilities, detailing the distribution of firmwide investments and their performance over five years. Suitable for demonstrating the firm's diversified asset management and strong performance history.
asset management, investment, performance, diversification, growth
Mixed Chart
Goldman Sachs
Saved
Dark blue slide with white and blue text boxes stacked vertically, highlighting key agenda items
Strategic Planning
Artificial Intelligence
The agenda outlines the structure of the presentation: understanding Gen AI, examining asset manager practices, exploring use cases across the value chain, and guidance on implementation and scaling.
Gen AI, agenda, value chain, asset managers, implementation, scaling
Agenda
McKinsey
Saved
Uses column chart to depict portfolio loans over time, with a color differentiation between average and period-end. Also, includes a bar chart for FICO score distribution.
Market Analysis and Trends
Real Estate & Construction
Evaluates the residential mortgage portfolio, showing historical loan amounts and current credit score distribution. Typically used by lenders and investors to understand the risk profile and trends in the residential mortgage sector.
Mortgage, Residential, Credit, Analysis, Trends
Multiple Chart
Morgan Stanley
Saved
Slide includes text content, a pie chart, and a circular diagram indicating rankings and statistics related to financial services, emphasizing the brand's market positioning.
Strategic Planning
Financial Services
Highlights the company's market positioning, strategic advantages, and customer engagement within the financial services sector. Useful in strategic planning and competitive analysis.
franchise value, market positioning, consumer banking, wealth management, customer engagement, strategic planning, competitive analysis
Single Chart
JP Morgan
Saved
Utilizes a scatter plot and bar graph to discuss types and frequencies of business disruptions.
Risk Assessment and Management
Industrial & Manufacturing
Analyzes different types of business disruptions and their predictability, offering a framework for understanding the likelihood and impact of various events like pandemics and cyber attacks.
Disruptions, Business, Framework, Predictability, Impact
Multiple Chart
McKinsey
Saved
Previous
Next
If nothing, comes up, please save your slides first
Create a FREE account to continue browsing
Receive Instant Access to 1,000+ slides from companies like McKinsey, Google, and Goldman Sachs
First Name
Last Name
Email
Password
I agree to all
Terms & Privacy Policy
Thank you! Your submission has been received!
Oops! Something went wrong while submitting the form.
Have an account?
Sign in
Column Chart
Heatmap
Chevron
Org Chart
Infographic
Callouts
Timeline
List
Graphic
Picture
Process Flow
Diagram
Paragraph
Map
Table
Framework
Subtitle
Takeaway Box
Icon
Other Chart
Radar Chart
Waterfall Chart
Mekko Chart
Pie Chart
Scatter Plot
Line Chart
Bar chart
Bullet points