My Account
My Slides
Search by Category
Templates
Leave Feedback
Login
Logout
Get Started
Browse all Slides
Browse all Slides
Create a FREE Account
Instant access to 1,000+ real slides from top companies like McKinsey, BCG, Goldman Sachs, Google and many more!
First Name
Last Name
Email
Password
I agree to all
Terms & Privacy Policy
Thank you! Your submission has been received!
Oops! Something went wrong while submitting the form.
Have an account?
Sign in
Saved Slides
Two line charts comparing high yield vs. bank loans' yield to maturity and Moody's speculative grade defaults forecast.
Investment Analysis
Financial Services
The slide argues for an overweight recommendation on bank loans, supported by high yield and robust fiscal stimulus, and compares it with high yield bonds' performance.
bank loans, high yield, investment analysis, fiscal stimulus, yield to maturity
Multiple Chart
Morgan Stanley
Saved
Slide features colored blocks diagramming key strategies for SEA's Net Zero journey, including energy transition and nature valuation, with supportive icons.
Strategic Planning
Environmental Services & Sustainability
Outlines strategic initiatives for achieving Net Zero in SEA, focusing on energy, agriculture, and waste management, useful for environmental strategists and policy makers.
SEA, Net Zero, strategy, energy transition, nature valuation, waste management, diagram, strategic planning, icons
Pillar
Bain
Saved
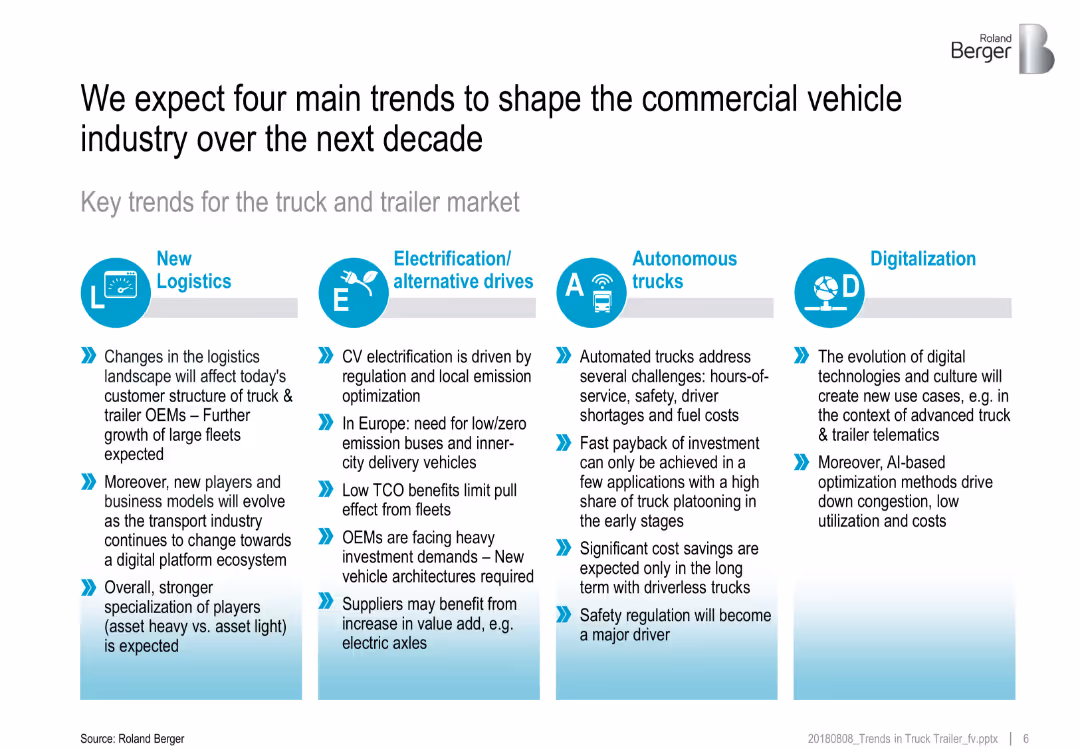
Four-column layout, each trend in a box with icon and bullets below; visually segmented with light blue gradients
Strategic Planning
Transportation & Logistics
This slide identifies four transformative trends in the truck/trailer industry: New Logistics, Electrification, Autonomous Trucks, and Digitalization. Each trend is explained with its drivers and implications, indicating industry-wide shifts toward smarter and more sustainable operations.
truck market, logistics, electrification, autonomous trucks, digitalization, industry trends, future of transport
Pillar
Roland Berger
Saved
Slide features two line charts tracking budget changes for customer relationship management and brand building over several years, indicating recent trends and future predictions.
Strategic Planning
Professional Services
Analyzing the budget trends for customer relationship management and brand building, the slide shows increasing investment in these areas.
CRM, brand building, budgets, trends, planning
Single Chart
Deloitte
Saved
Features pie charts and a stacked bar chart illustrating the breakdown of deposits by business type and region, along with long-term debt and other liabilities.
Operational Efficiency
Financial Services
Provides insights into the deposit structure and liability distribution of a financial institution, emphasizing operational efficiency in managing diverse financial resources.
Deposits, Diversification, Pie Charts, Banking, Operational Efficiency, Liabilities, Financial Management
Multiple Chart
Citigroup
Saved
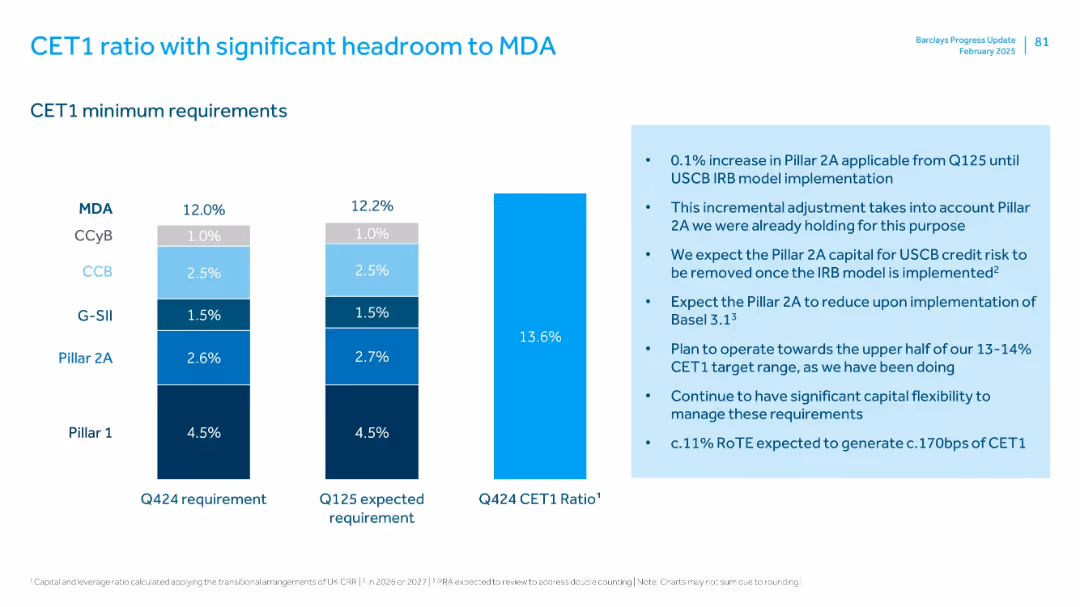
Vertical stacked bar charts showing CET1 ratio vs. regulatory minimums. Text box explains Pillar 2A changes.
Regulatory and Compliance
Financial Services
Shows Barclays’ CET1 ratio (13.6%) exceeds the regulatory minimum (12.0%-12.2%) providing significant buffer. Explains expected future reduction in capital requirements and ongoing flexibility in managing regulatory capital targets.
CET1, capital requirements, regulatory, MDA, Pillar 2A, Basel 3.1
Mixed Chart
Barclays
Saved
Multiple bar and column graphs, with a clean layout displaying JPMorgan's asset management performance metrics.
Financial Performance
Financial Services
This slide aims to communicate JPMorgan's strategy and success in scaling asset management, using data visualizations to highlight growth in various investment types and to position themselves as industry leaders with effective ETFs and SMAs.
scaling, asset management, JPMorgan, ETFs, performance
Multiple Chart
JP Morgan
Saved
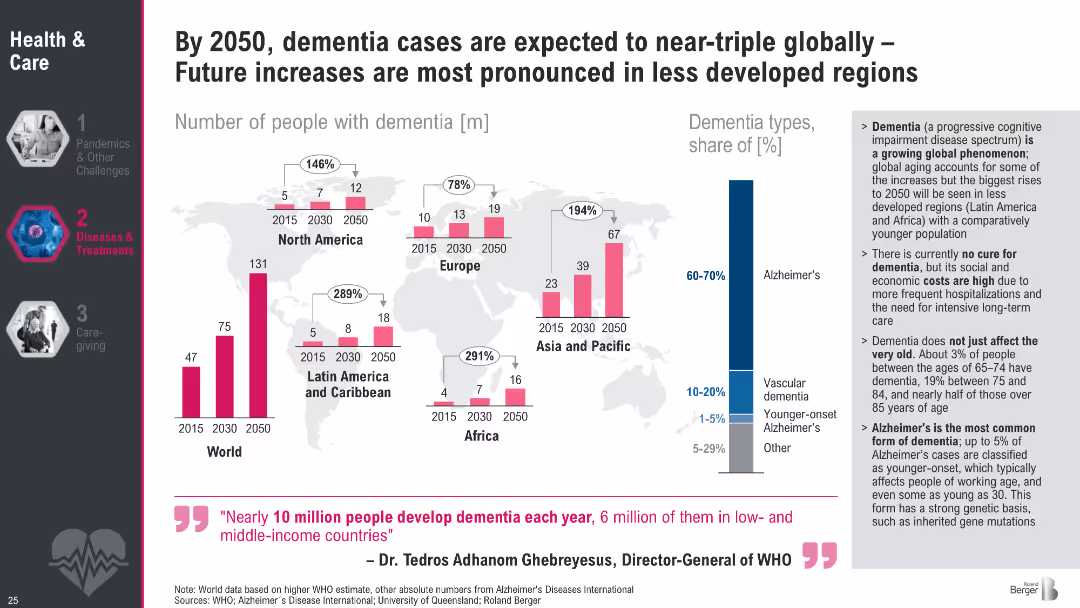
Bar charts over world map displaying dementia prevalence by region (2015–2050); includes dementia type breakdown
Strategic Planning
Healthcare & Pharmaceuticals
The slide forecasts a tripling of global dementia cases by 2050, particularly in less developed regions. It highlights Alzheimer's dominance among dementia types and outlines the lack of cure, the societal burden, and the rise in early-onset cases.
dementia, Alzheimer's, global aging, healthcare burden, projections, WHO, regional trends, memory loss, neurodegeneration, healthcare planning
Multiple Chart
Roland Berger
Saved
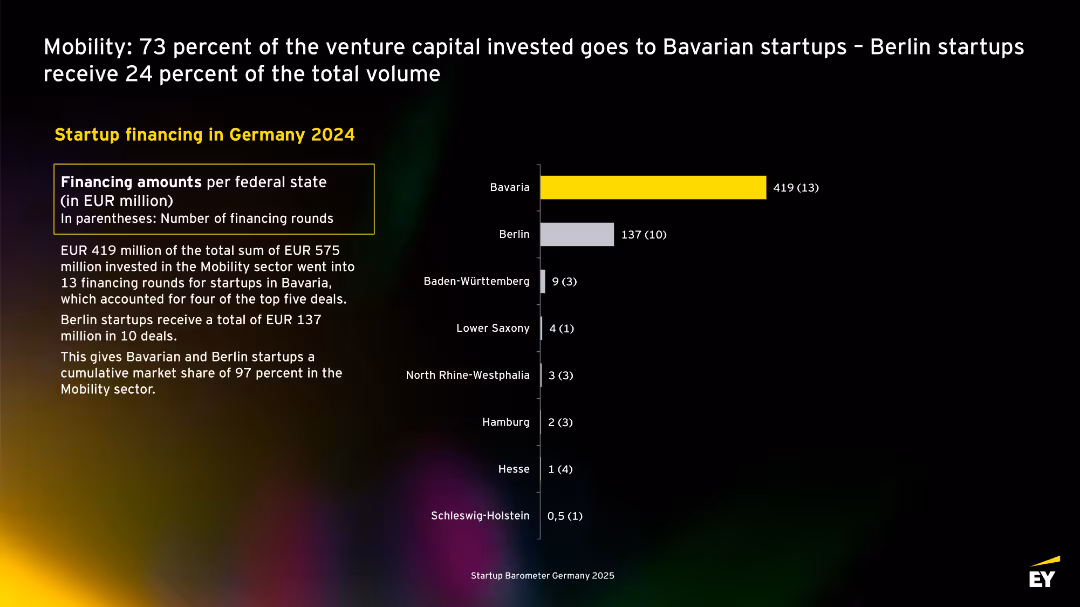
Bar chart ranks federal states by funding; yellow bar for Bavaria; narrative details dominance of Bavarian and Berlin startups.
Investment Analysis
Transportation & Logistics
Bavarian startups received EUR 419M of EUR 575M total mobility funding in 2024 (73%). Berlin follows with EUR 137M. The slide emphasizes Bavaria’s overwhelming share.
Bavaria, Berlin, venture capital, mobility, transportation, 2024, Germany, regional
Mixed Chart
EY
Saved
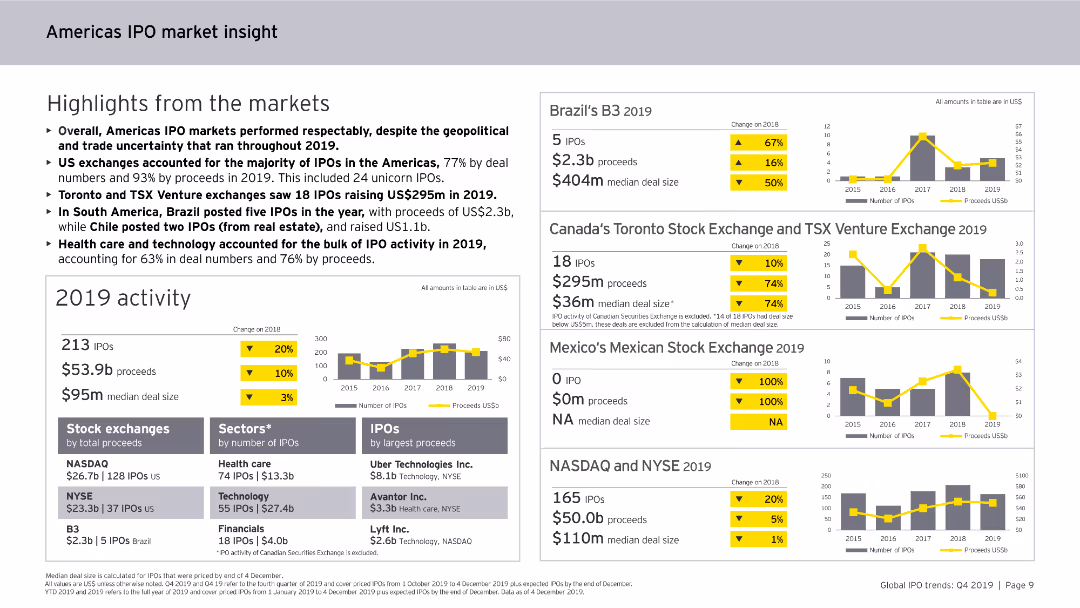
Contains column charts, data tables, and bullet points. The slide is visually dense, focusing on IPO activities and trends in the Americas for 2019.
Market Analysis and Trends
Financial Services
Highlights the performance of IPO markets in the Americas for 2019, including sector-specific analysis, major exchanges, and trends in IPO deal sizes and proceeds.
Americas, IPO, market insight, 2019, trends
Multiple Chart
EY
Saved
Column chart showing average views on official accounts, image of smartphone usage
Market Analysis and Trends
Media & Entertainment
Discusses the effectiveness of brand accounts on WeChat for engaging consumers
Digital Marketing, Brand Engagement, WeChat, Views
Single Chart
BCG
Saved
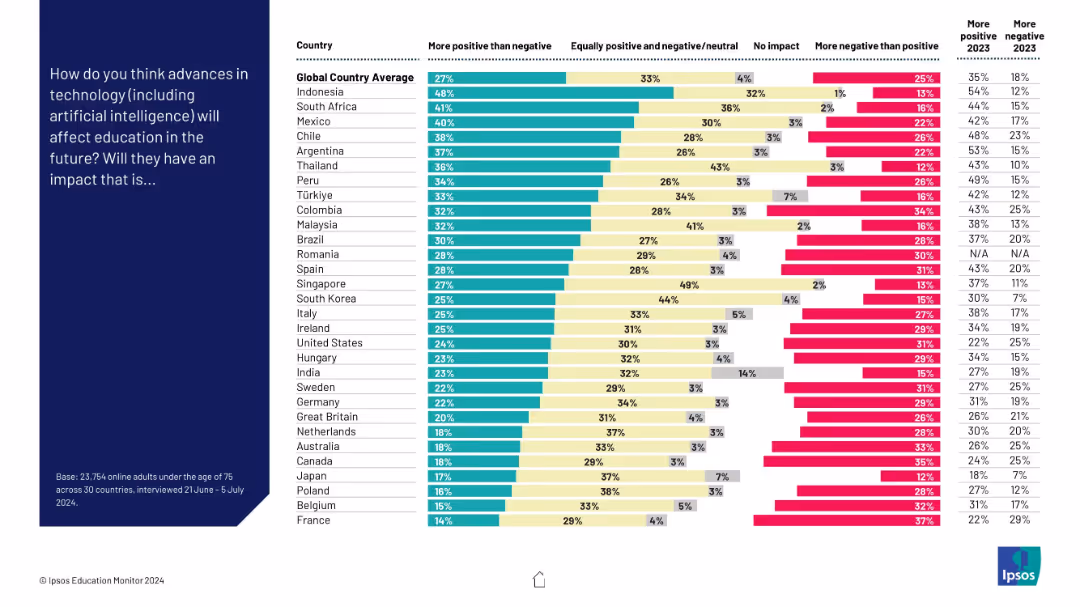
Vertical bar chart on the right showing responses from various countries, with segmented bars (more positive, neutral, no impact, more negative); dark blue left panel with question text
Market Analysis and Trends
Education & Training
The slide presents survey results across 30 countries on public perceptions of how technology (including AI) will affect education. Most countries lean toward a positive view, but significant variation exists, with some populations more skeptical.
education, technology, AI, perception, global, survey, positivity, negativity, impact
Mixed Chart
IPSOS
Saved
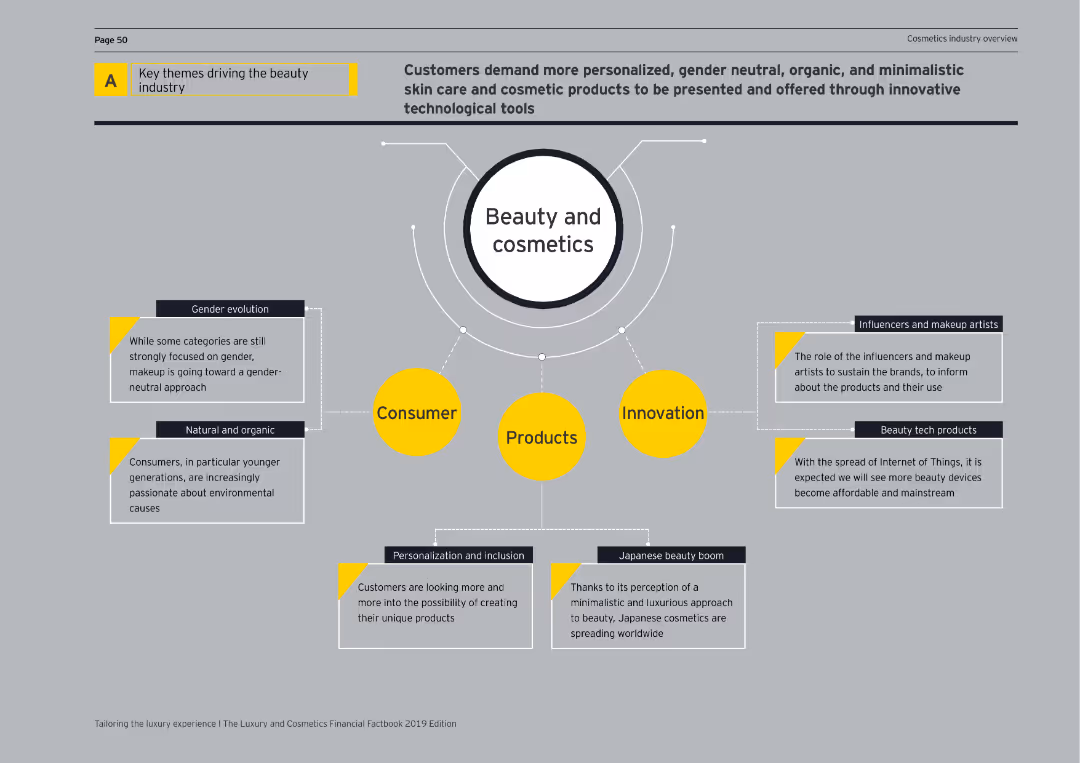
Diagram with four main themes (Consumer, Products, Innovation, Influencers) surrounding the central theme of Beauty and Cosmetics.
Market Analysis and Trends
Consumer Goods
Highlights the main drivers in the beauty industry, focusing on consumer trends, product innovation, and the role of influencers and tech products.
beauty industry, consumer trends, product innovation, influencers, technology, cosmetics, market analysis, diagram, key themes
Diagram
EY
Saved
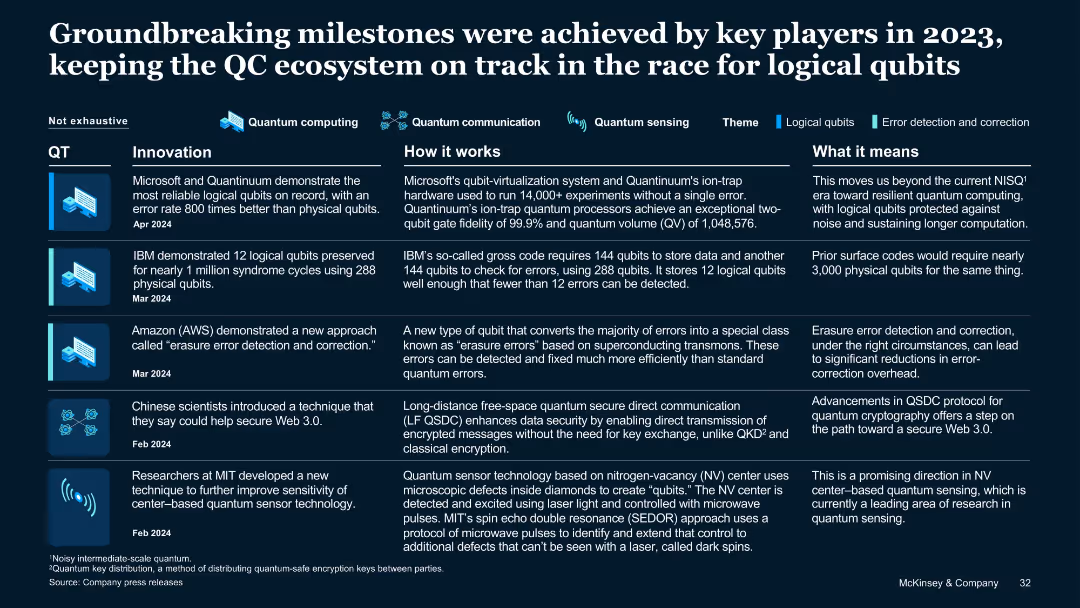
Three-column layout with icons, timelines, and technical summaries on innovations, workings, and implications in QC.
Technology and Digital Transformation
Technology & Software
Highlights 5 major milestones in quantum computing (QC) achieved in 2023–2024 by firms like Microsoft, IBM, AWS, MIT, and Chinese scientists. Focuses on innovations in logical qubits, error correction, Web 3.0 security, and sensing technologies.
logical qubits, quantum computing, error correction, innovation, Web 3.0, sensors, IBM
Table
McKinsey
Saved
The slide includes a set of column chart comparing the percentage of workers needing to switch occupations by 2030 across five countries: Japan, Australia, United States, Germany, and New Zealand. Each country's bar is divided into segments for additional shifts due to different adoption scenarios.
Human Resources and Talent Management
Industrial & Manufacturing
This slide provides an international perspective on the workforce shifts necessary under an early automation adoption scenario. It quantifies the proportion of the workforce that might need to transition to different occupations, serving as a basis for discussions on global labor market resilience and the need for comprehensive retraining programs.
workforce, automation, global, transition, occupations
Single Chart
McKinsey
Saved
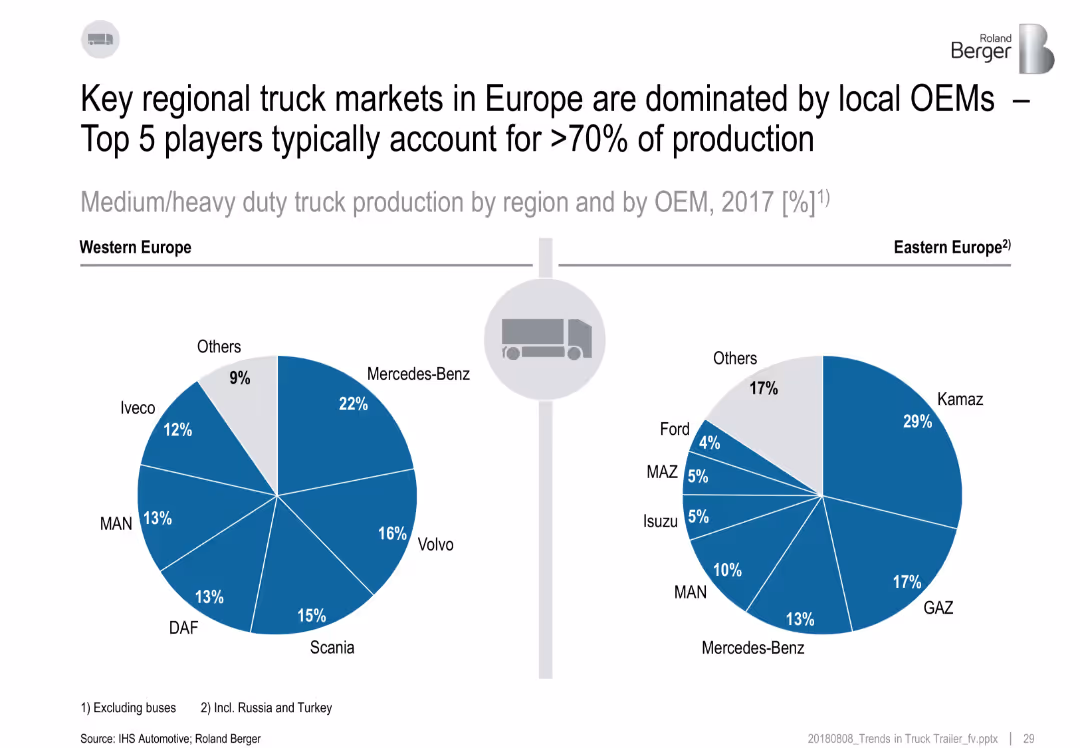
Two pie charts comparing market shares of OEMs in Western and Eastern Europe.
Competitive Landscape
Transportation & Logistics
The slide presents the OEM landscape for heavy-duty truck production in Europe. Western Europe is dominated by Mercedes-Benz, Volvo, and Scania, while Eastern Europe sees Kamaz, GAZ, and Mercedes-Benz leading. Top 5 OEMs hold over 70% share.
OEM, Europe, market share, trucks, production, Mercedes-Benz, Kamaz
Multiple Chart
Roland Berger
Saved
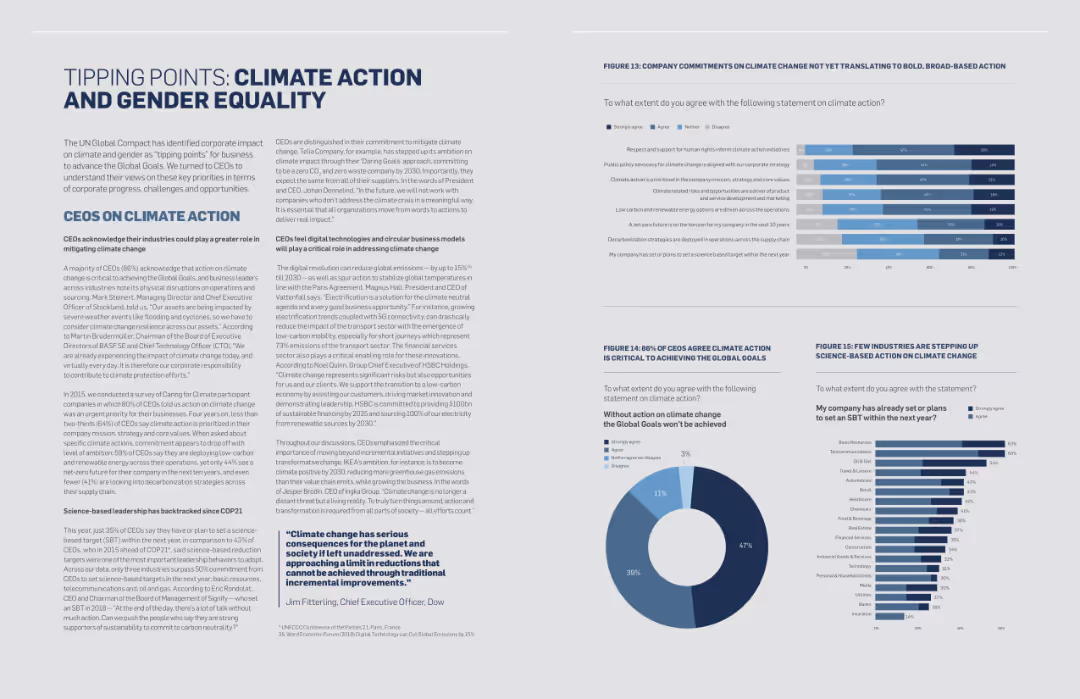
The slide contains text and several column charts depicting survey data on climate action and gender equality. Quotes from CEOs are also included.
Regulatory and Compliance
Environmental Services & Sustainability
The slide addresses the critical points of climate action and gender equality, presenting survey data and CEO quotes to highlight the importance of these issues for sustainable development.
Climate Action, Gender Equality, Sustainability, Survey Data, CEO Quotes, Regulatory Compliance
Multiple Chart
Accenture
Saved
Features two circular data visualizations contrasting the number of $1B+ consumer technology companies in SEA between 2020 and 2021. The layout is clean with a side panel for descriptive text.
Market Analysis and Trends
Financial Services
Slide illustrates the doubling of $1B+ consumer technology companies in SEA from 2020 to 2021, highlighting the market's robust expansion and its impact on the e-commerce and financial sectors.
Consumer Technology, Growth, SEA, Valuation
Mixed Chart
Bain
Saved
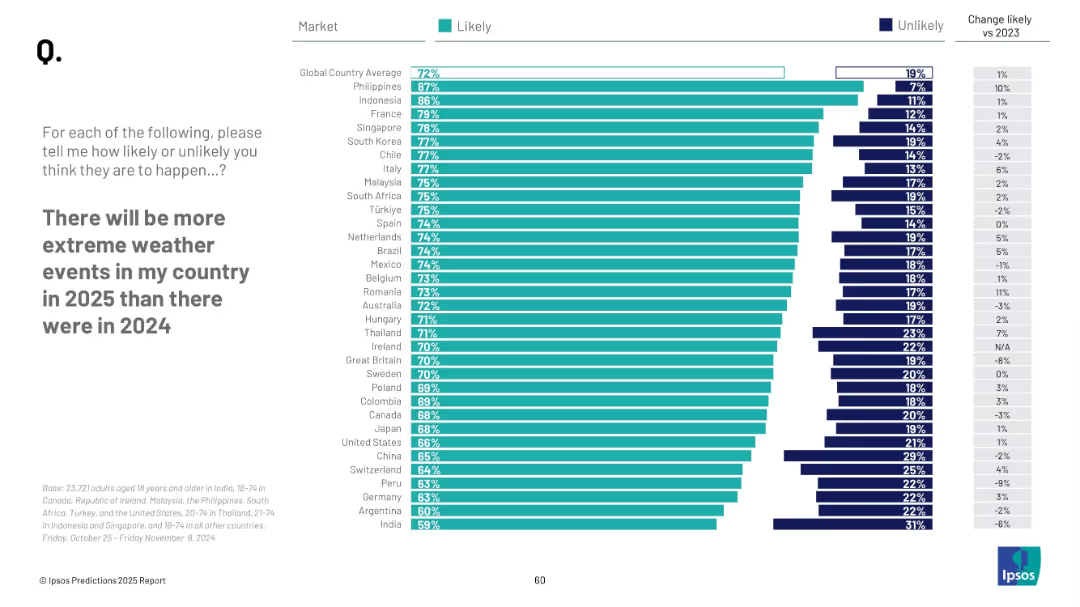
Horizontal bars sorted by country; teal vs navy segmentation; change from 2023 on right
Market Analysis and Trends
Environmental Services & Sustainability
The slide reports how likely people from different countries believe extreme weather will intensify in 2025 versus 2024. Countries are listed from most to least concerned, highlighting regional variations in climate awareness.
extreme weather, climate change, global opinion, 2025 forecast, environment, Ipsos, perception
Mixed Chart
IPSOS
Saved
Simple layout with a single column chart illustrating consumer responses to purchasing second-hand luxury items.
Market Analysis and Trends
Retail & E-commerce
Focuses on the reasons driving consumer interest in second-hand luxury products, including perceived value and exclusivity.
Second-hand luxury, consumer behavior, purchasing reasons, perceived value, exclusivity, market insights, consumer trends
Mixed Chart
BCG
Saved
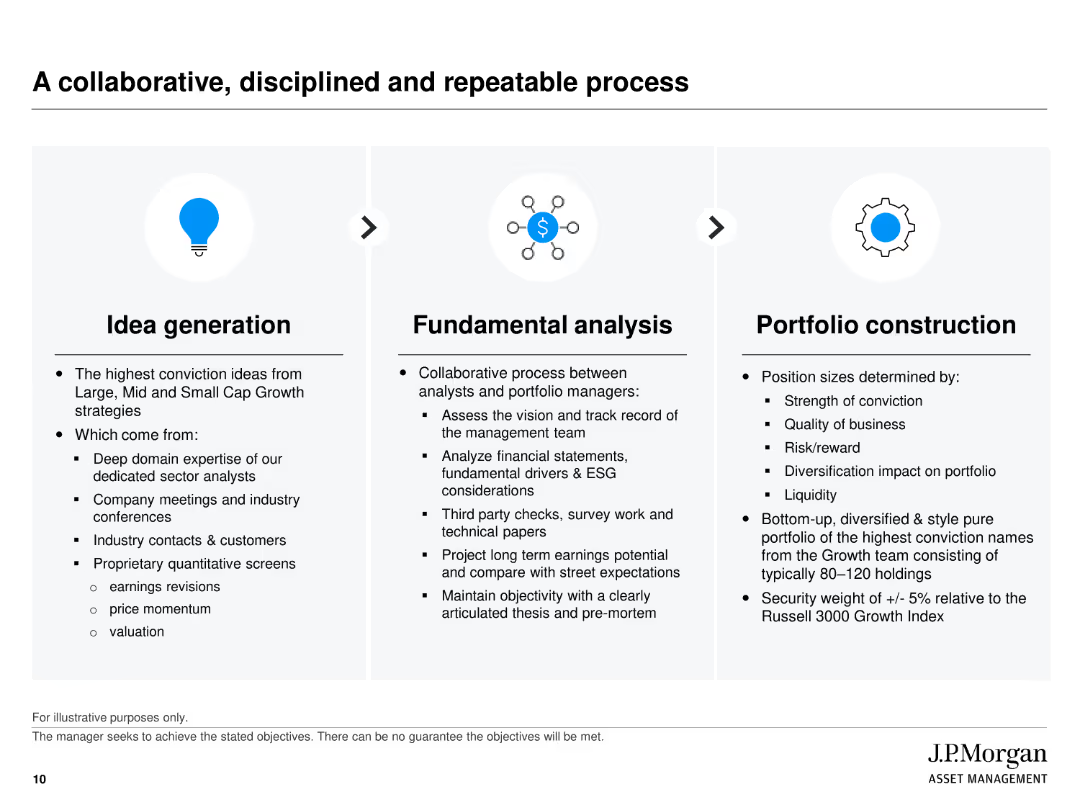
Three-column layout: Idea Generation, Fundamental Analysis, and Portfolio Construction, each described with icons and text explaining the processes.
Operational Efficiency
Financial Services
Describes the structured process used by J.P. Morgan for managing growth portfolios, from generating investment ideas to fundamental analysis and constructing the portfolio.
process, collaboration, portfolio construction, idea generation, fundamental analysis
Pillar
JP Morgan
Saved
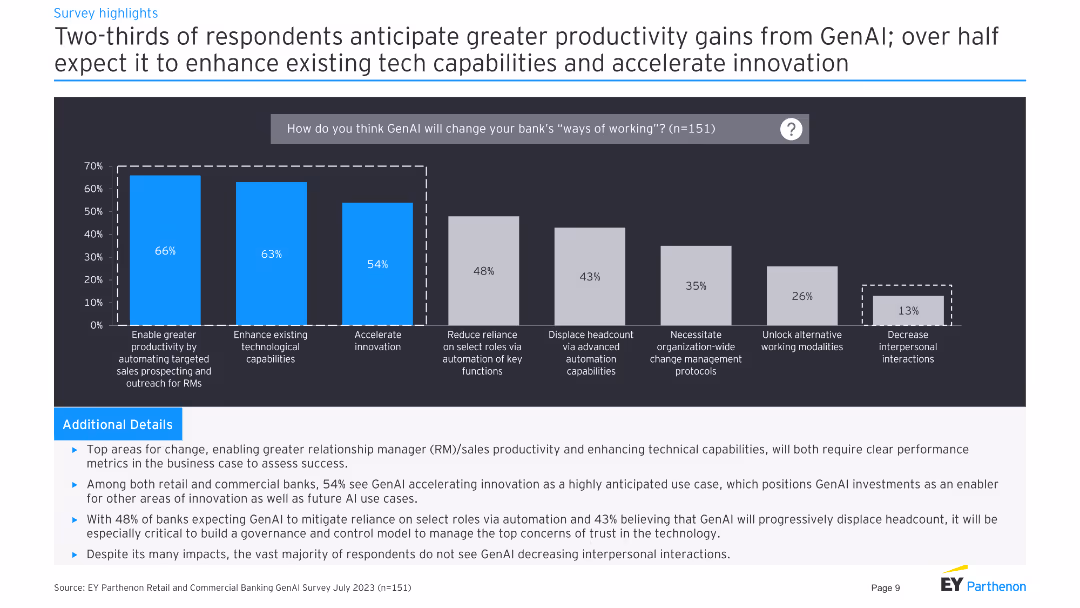
The slide features column charts showing anticipated changes in banks' working methods due to GenAI, focusing on productivity, technological capabilities, and innovation.
Technology and Digital Transformation
Financial Services
The slide discusses the anticipated productivity gains and technological advancements that banks expect from implementing GenAI solutions, based on a survey of respondents.
GenAI, productivity, technology, innovation, banks
Mixed Chart
EY
Saved
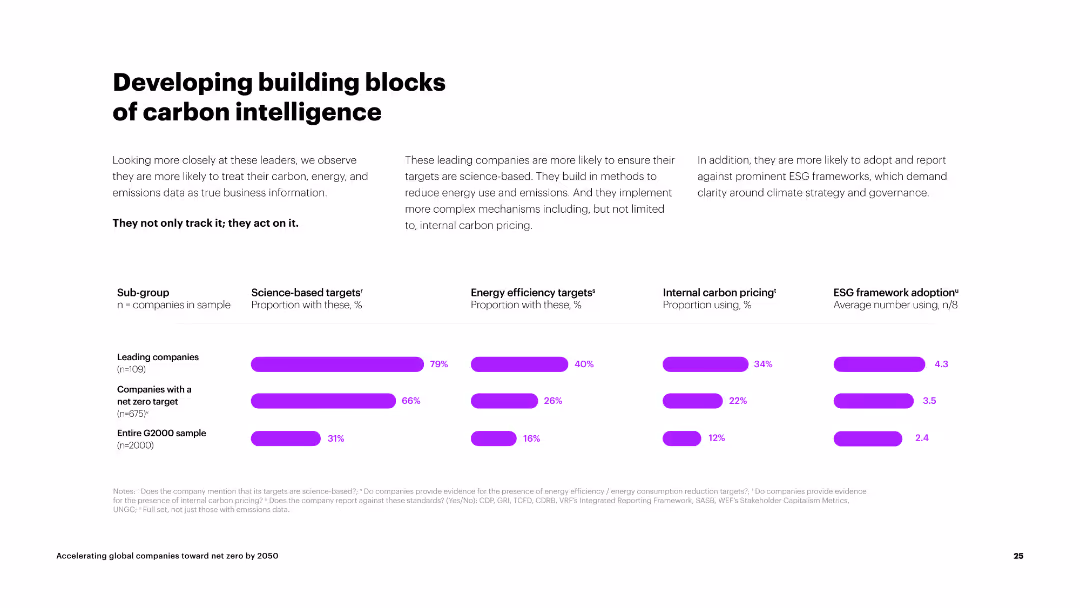
The slide is divided into three sections, each with an icon and text block. The background is white with purple accents, creating a clean and organized look.
Strategic Planning
Energy & Utilities
The slide outlines steps for companies at different stages of carbon intelligence: setting targets, prioritizing investments, and placing bold bets. It provides guidance for companies at various stages of their journey.
carbon targets, investments, energy efficiency, milestones, carbon pricing
Multiple Chart
Accenture
Saved
A bar chart (horizontal) showing the likelihood of consumers to save energy at home across various countries. The chart differentiates between likely and unlikely responses using different colors.
Market Analysis and Trends
Consumer Goods
This slide presents comparative data on the likelihood of saving energy at home. It includes insights into consumer attitudes and behaviors towards energy conservation across different regions.
energy conservation, consumer behavior, sustainability, global attitudes, comparative data
Multiple Chart
IPSOS
Saved
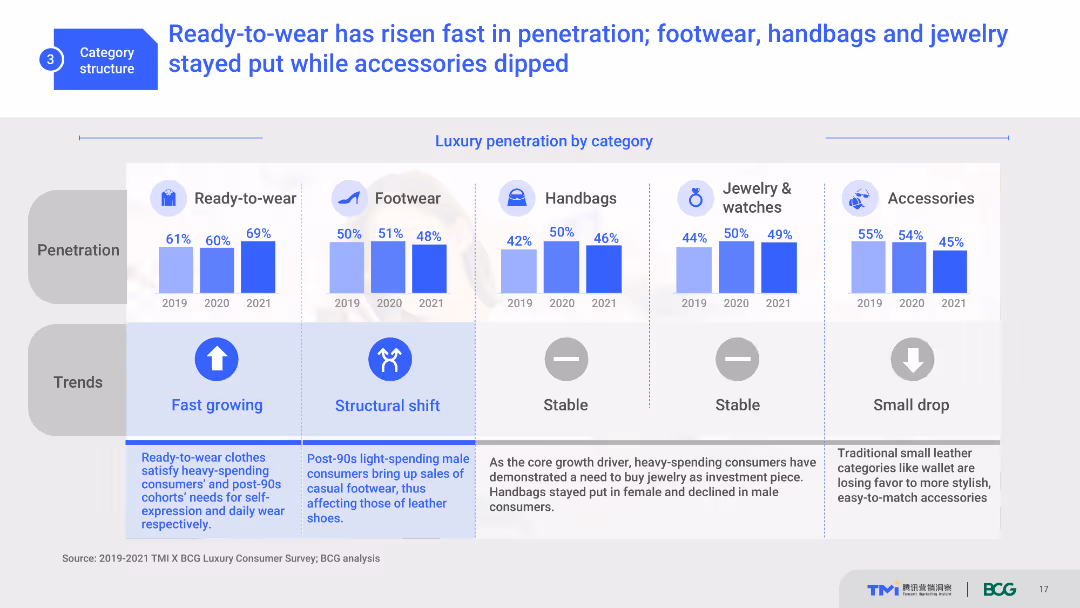
The slide features multiple column charts showing luxury penetration by category from 2019 to 2021. It includes icons for each category and trend indicators. The visual complexity is moderate, with well-organized data and clear labels.
Market Analysis and Trends
Consumer Goods
This slide presents the growth trends of various luxury categories such as ready-to-wear, footwear, handbags, and accessories. It shows the percentage penetration over three years, indicating market shifts and consumer preferences.
luxury market, category penetration, trends, consumer preferences, growth
Multiple Chart
BCG
Saved
Previous
Next
If nothing, comes up, please save your slides first
Create a FREE account to continue browsing
Receive Instant Access to 1,000+ slides from companies like McKinsey, Google, and Goldman Sachs
First Name
Last Name
Email
Password
I agree to all
Terms & Privacy Policy
Thank you! Your submission has been received!
Oops! Something went wrong while submitting the form.
Have an account?
Sign in
Column Chart
Heatmap
Chevron
Org Chart
Infographic
Callouts
Timeline
List
Graphic
Picture
Process Flow
Diagram
Paragraph
Map
Table
Framework
Subtitle
Takeaway Box
Icon
Other Chart
Radar Chart
Waterfall Chart
Mekko Chart
Pie Chart
Scatter Plot
Line Chart
Bar chart
Bullet points