My Account
My Slides
Search by Category
Templates
Leave Feedback
Login
Logout
Get Started
Browse all Slides
Browse all Slides
Create a FREE Account
Instant access to 1,000+ real slides from top companies like McKinsey, BCG, Goldman Sachs, Google and many more!
First Name
Last Name
Email
Password
I agree to all
Terms & Privacy Policy
Thank you! Your submission has been received!
Oops! Something went wrong while submitting the form.
Have an account?
Sign in
Saved Slides
Features a line graph projecting economic growth under different AI adoption scenarios against a baseline. The graph is color-coded to distinguish between aggressive, cautious, and people-centric adoption scenarios, showing potential gains in trillions of dollars.
Strategic Planning
Technology & Software
Outlines the economic potential of adopting AI responsibly, highlighting different scenarios and their impact on economic growth.
AI, Economy, Growth, Adoption Scenarios, Potential, Trillions, Impact, Responsible, Technology
Single Chart
Accenture
Saved
The slide shows bar graphs comparing Booz Allen's dividend growth to peer average, alongside textual information.
Financial Performance
Financial Services
Highlights the company's quarterly dividend growth compared to peers, reflecting on Booz Allen's strong performance. Used in investment analysis or shareholder presentations.
Dividend, Growth, Comparison, Performance, Market
Single Chart
Booz Allen Hamilton
Saved
Showcases quotes from global leaders on globalization, arranged in two columns for proponents and opponents.
Organizational Structure and Change
Professional Services
Presents contrasting viewpoints on globalization from world leaders, highlighting their perspectives on economic and social impacts.
globalization, world leaders, economic impact, social impact, global policy
Mixed Chart
Roland Berger
Saved
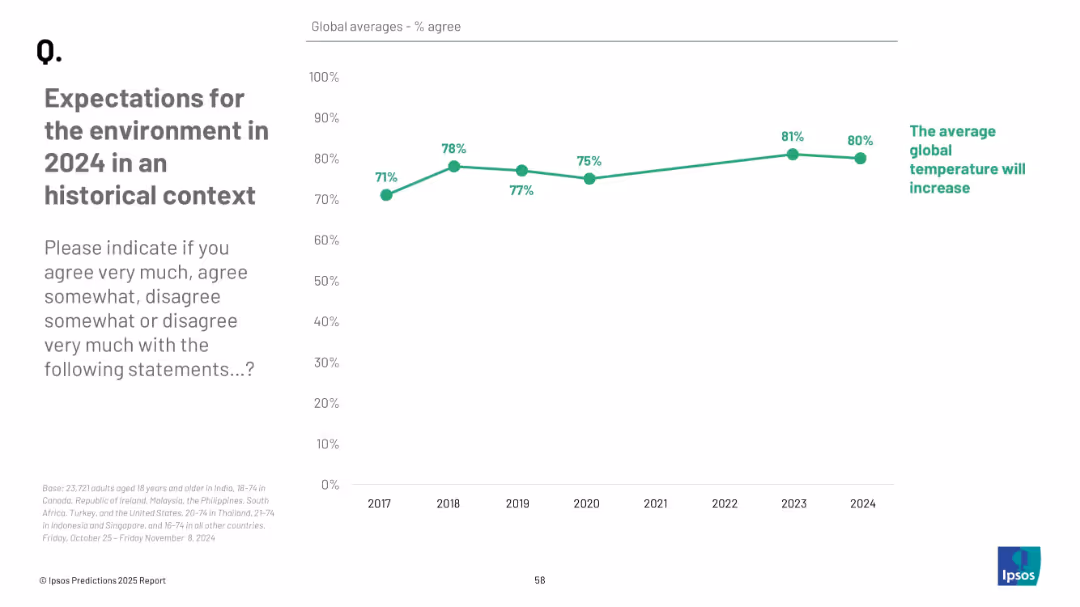
Line chart showing % agreement over years; simple green trend line on white grid background; emphasis on year-over-year changes
Market Analysis and Trends
Environmental Services & Sustainability
This historical trend chart shows how belief in global temperature increases has evolved from 2017 to 2024. The data is based on global averages and helps contextualize current environmental concerns within a longer trend.
climate trend, temperature rise, historical data, environment, public perception, timeline, Ipsos
Mixed Chart
IPSOS
Saved
This slide features a line chart comparing the cost of road freight per tonne-kilometre over various distances in Australia, the US, and France. Bullet points explain cost dynamics.
Market Analysis and Trends
Transportation & Logistics
It discusses the varying costs of road freight in Australia relative to the US and France, noting that Australia's costs are higher for short distances but become more competitive over longer distances.
road freight, cost, Australia, US, France, short haul, long haul
Mixed Chart
LEK
Saved
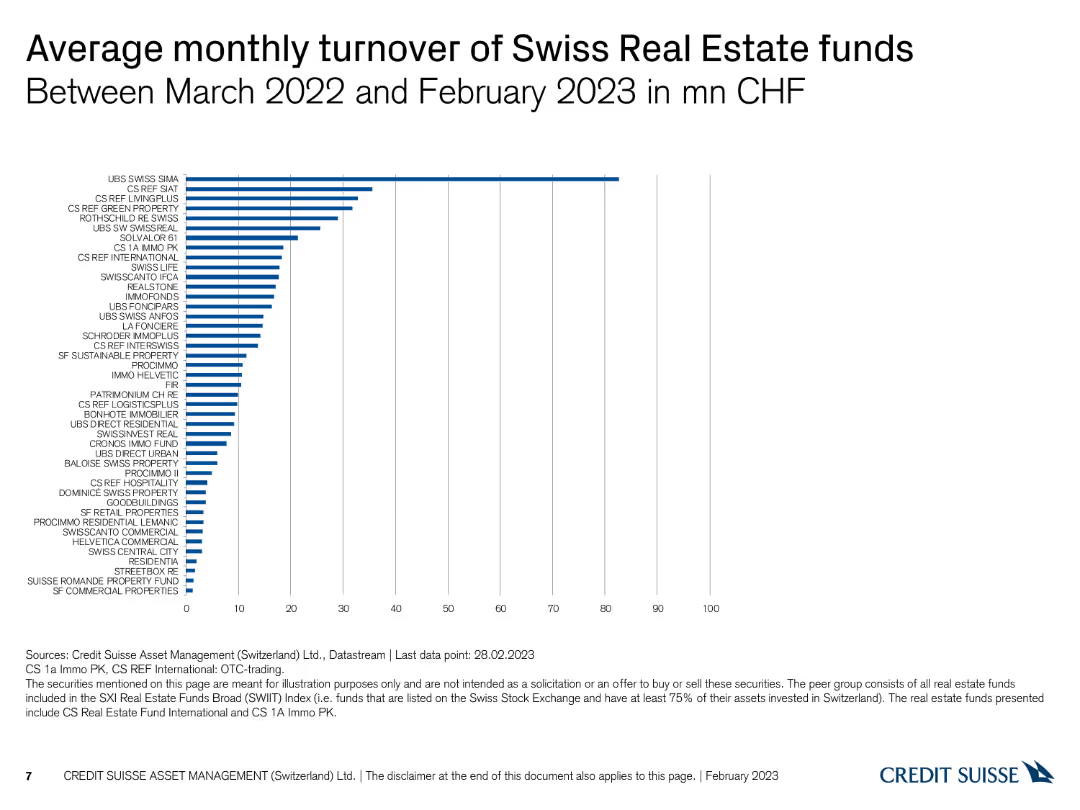
The slide includes a column chart displaying the average monthly turnover of Swiss real estate funds in million CHF.
Financial Performance
Real Estate & Construction
This slide reports the average monthly turnover of various Swiss real estate funds from March 2022 to February 2023, measured in million CHF.
Swiss real estate, turnover, monthly turnover, column chart, CHF
Single Chart
Credit Suisse
Saved
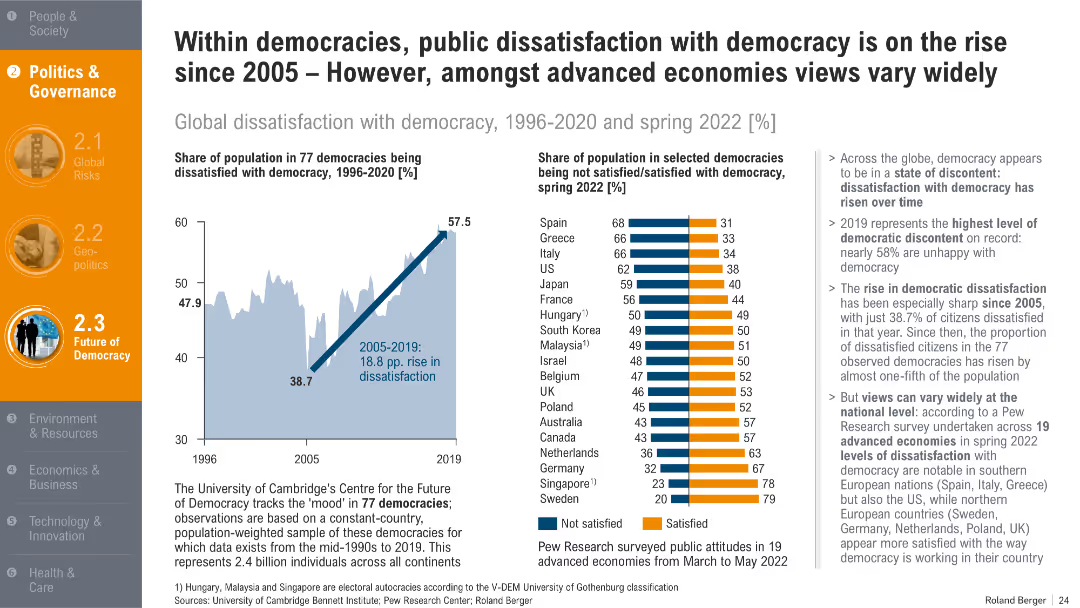
Two charts: line graph of dissatisfaction over time and bar chart showing country-wise satisfaction in 2022. Supported by bullet-point analysis.
Organizational Structure and Change
Government & Public Sector
This slide shows growing dissatisfaction with democracy since 2005, peaking in 2019. It contrasts national satisfaction levels in 2022, revealing significant variance between Southern and Northern democracies.
democratic dissatisfaction, political sentiment, governance trust, public opinion, voter discontent
Multiple Chart
Roland Berger
Saved
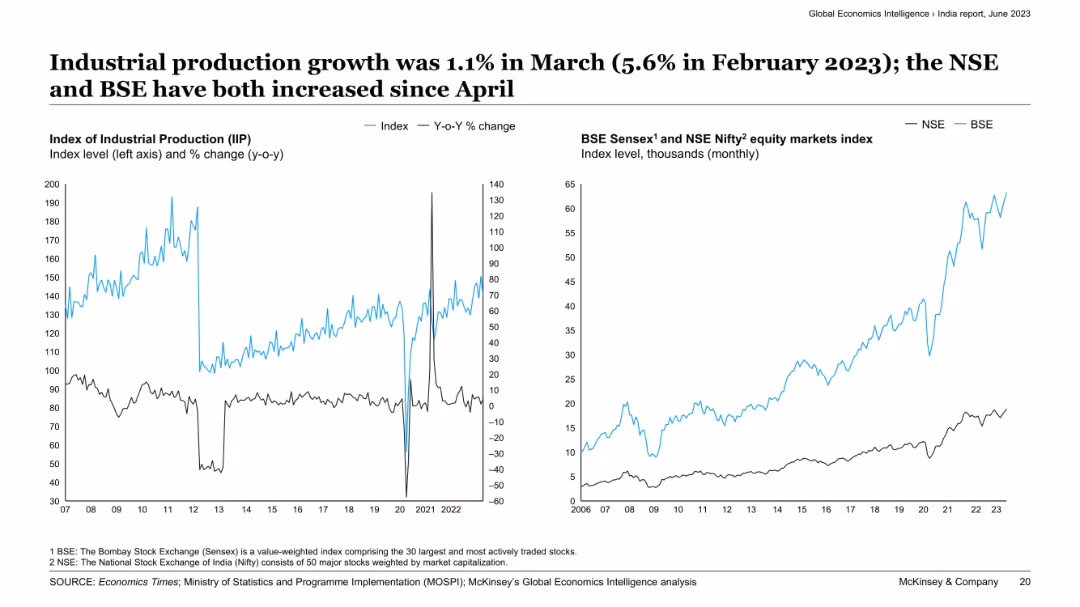
Dual-panel charts with IIP index and YoY growth (left) and stock index performance of NSE and BSE (right).
Performance Metrics and KPIs
Industrial & Manufacturing
The slide illustrates India’s industrial production performance with a modest YoY growth in March. Equity market indices (BSE and NSE) have increased since April, signaling investor confidence and possible economic recovery in the manufacturing and industrial sectors.
industrial production, India, IIP, BSE, NSE, stock market, growth, equity index, manufacturing, recovery
Multiple Chart
McKinsey
Saved
Bar graph on left showing AUM growth; right side has supporting text and projected growth forecast.
Market Analysis and Trends
Financial Services
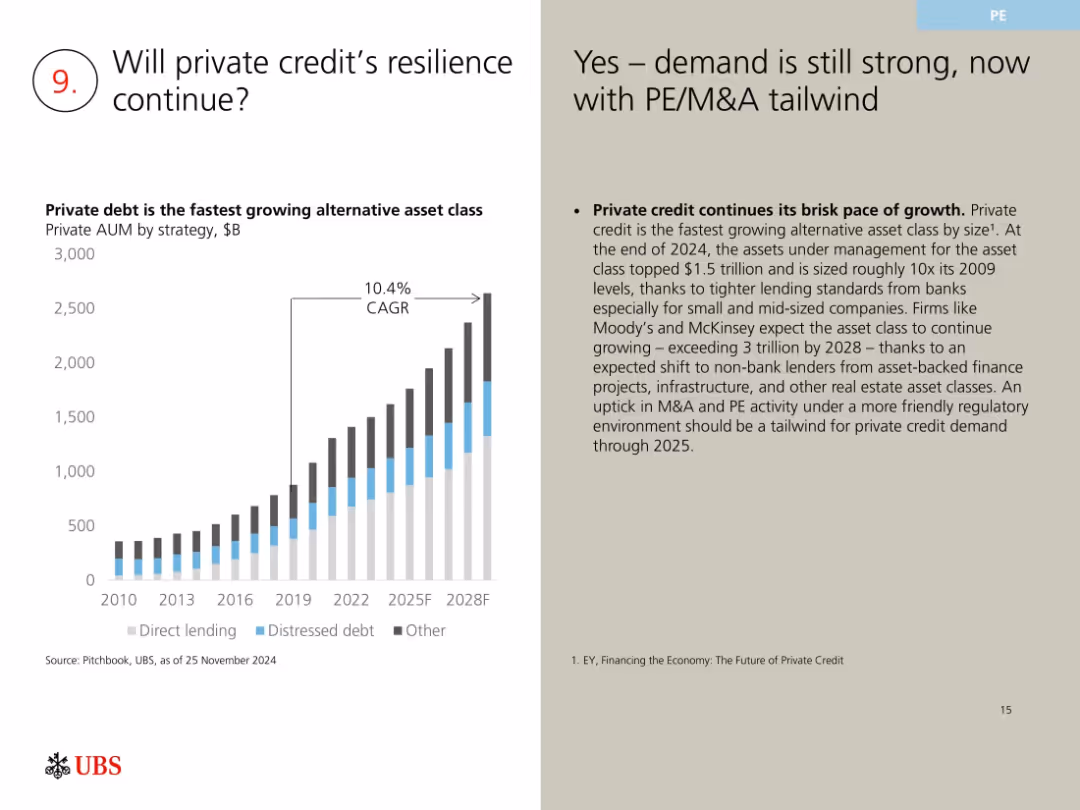
This slide highlights the growth trajectory of private credit, showing a 10.4% CAGR with projections exceeding $3 trillion AUM by 2028. Key drivers include tighter bank lending standards, more PE/M&A activity, and a favorable regulatory environment supporting non-bank lending models.
private credit, AUM growth, alternative assets, CAGR, M&A tailwind
Mixed Chart
UBS
Saved
Vertical bar chart; standard layout consistent with others; transparency-focused perception question
Market Analysis and Trends
Energy & Utilities
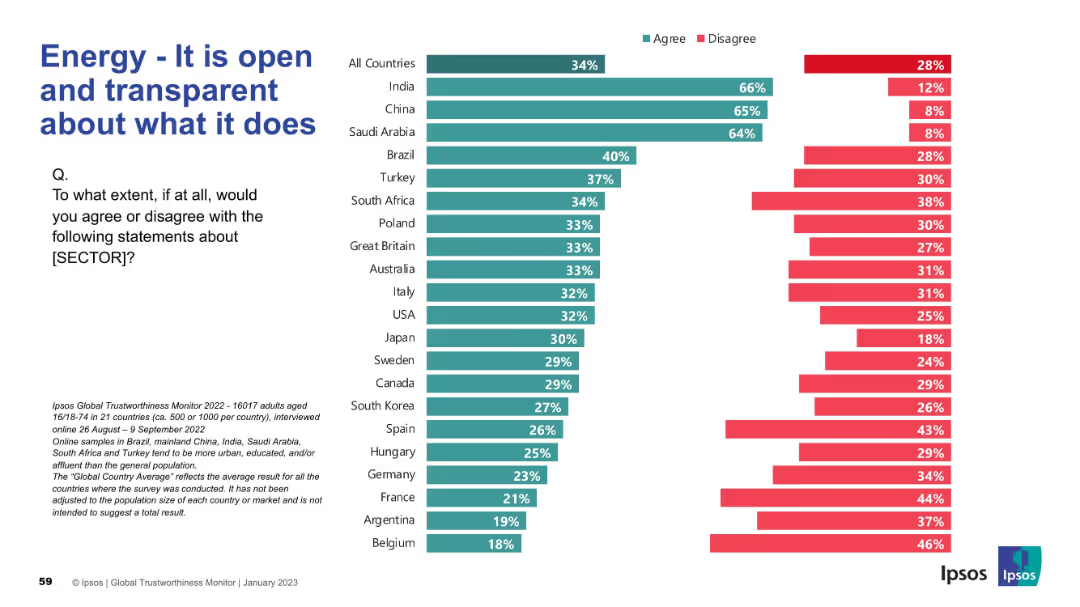
The slide reveals how transparent the energy sector is perceived to be globally. India, China, and Saudi Arabia are seen as the most transparent, while European countries like Belgium and France show significantly lower agreement levels.
transparency, openness, energy sector, perception, trust, Ipsos, survey, global rankings, agreement
Mixed Chart
IPSOS
Saved
The slide includes a left text block and two column charts on the right, contrasting CEO priorities between different countries.
Strategic Planning
Professional Services
Discusses the nuanced global views of CEOs regarding trade conflicts and their impact on market growth, highlighting shifting priorities towards various economies using column charts.
global markets, CEO survey, trade conflict, economy, growth
Multiple Chart
PwC/Strategy&
Saved
Includes matrix charts and text blocks on talent management strategies, emphasizing identification and sourcing of critical skills. Visual elements are clear with green and gray highlights.
Human Resources and Talent Management
Education & Training
Discusses re-skilling and up-skilling strategies in line with business changes, focusing on digital and leadership skills essential for the future, and various sourcing strategies including tech-enabled recruiting.
Skills development, Talent management, Digital transformation, Recruitment
Framework
BCG
Saved
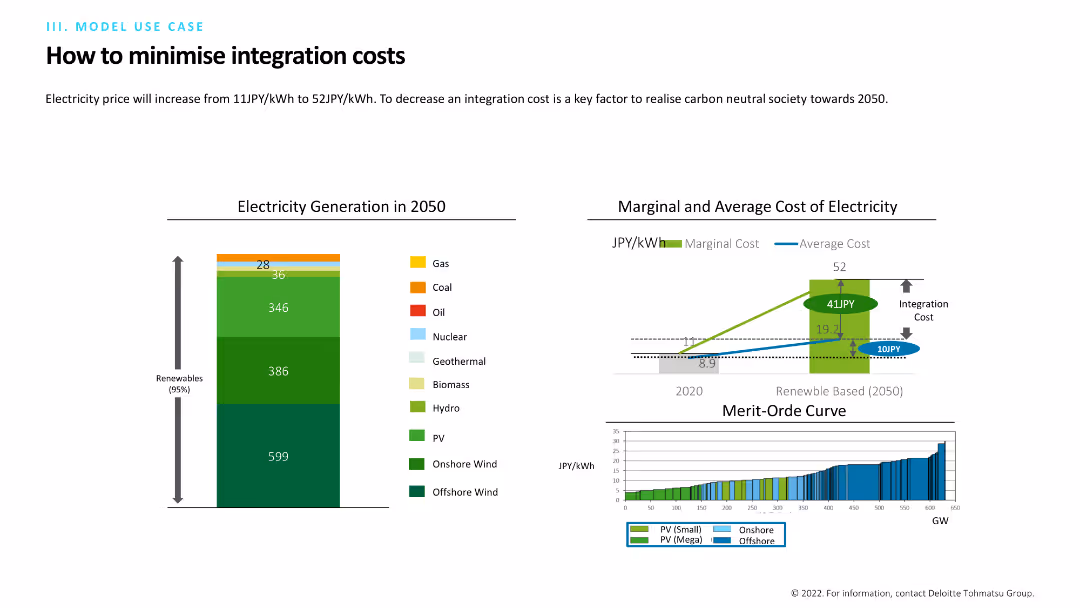
The slide includes a column chart showing electricity generation in 2050 by source (e.g., gas, coal, oil) and a line chart comparing marginal and average costs of electricity. Another chart shows the merit-order curve for renewables.
Operational Efficiency
Energy & Utilities
The slide discusses strategies to minimize integration costs in the energy sector by 2050, focusing on renewable energy and cost efficiency. It includes data on electricity generation and cost projections.
Integration costs, electricity, 2050, renewables, cost efficiency
Multiple Chart
Deloitte
Saved
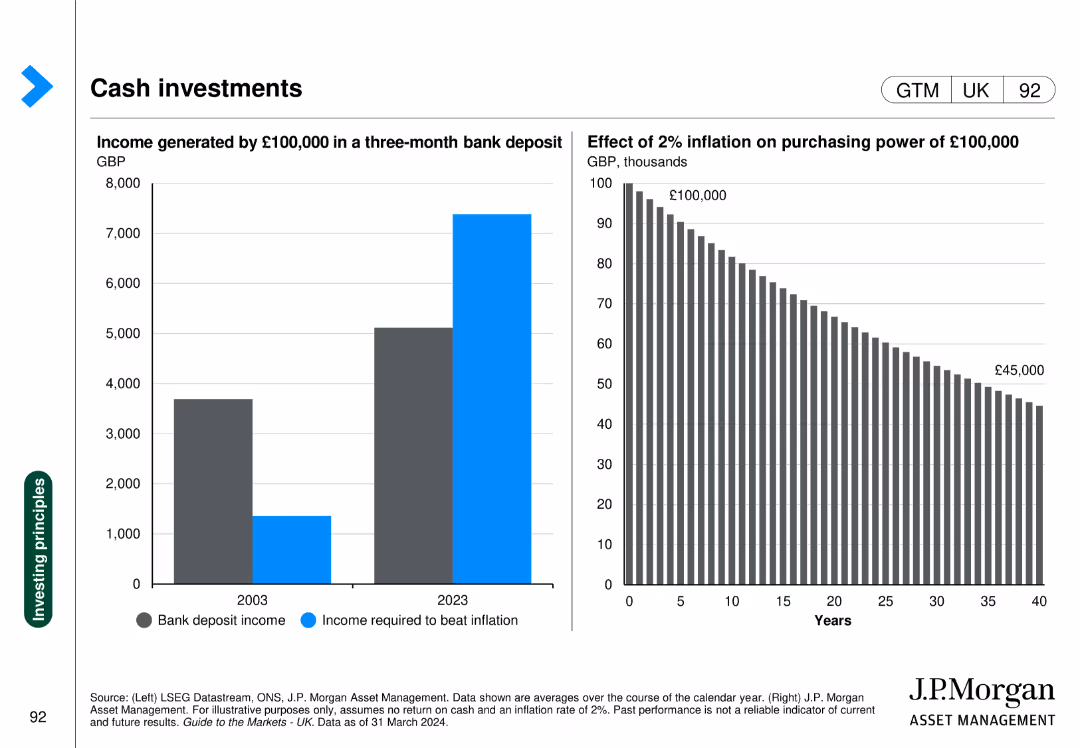
Two charts: one column chart showing income from bank deposits, another showing the impact of inflation on purchasing power.
Financial Performance
Financial Services
Highlights the change in income from bank deposits over time and the effect of inflation on money's value.
Cash investments, bank deposit, inflation, purchasing power, income
Multiple Chart
JP Morgan
Saved
The slide features a vertical column chart showing operating expenses for 3Q23, highlighting a reduction.
Operational Efficiency
Financial Services
This slide details the operating expenses for Q3 2023, emphasizing a decrease compared to previous quarters.
operating expenses, cost reduction, financial performance, Q3 2023, efficiency
Mixed Chart
UBS
Saved
Column charts and stats about income levels and sources of financial support for refugees.
Financial Performance
Government & Public Sector
Reviews financial conditions of refugees and the support they receive.
refugees, income, financial support, Poland
Multiple Chart
Deloitte
Saved
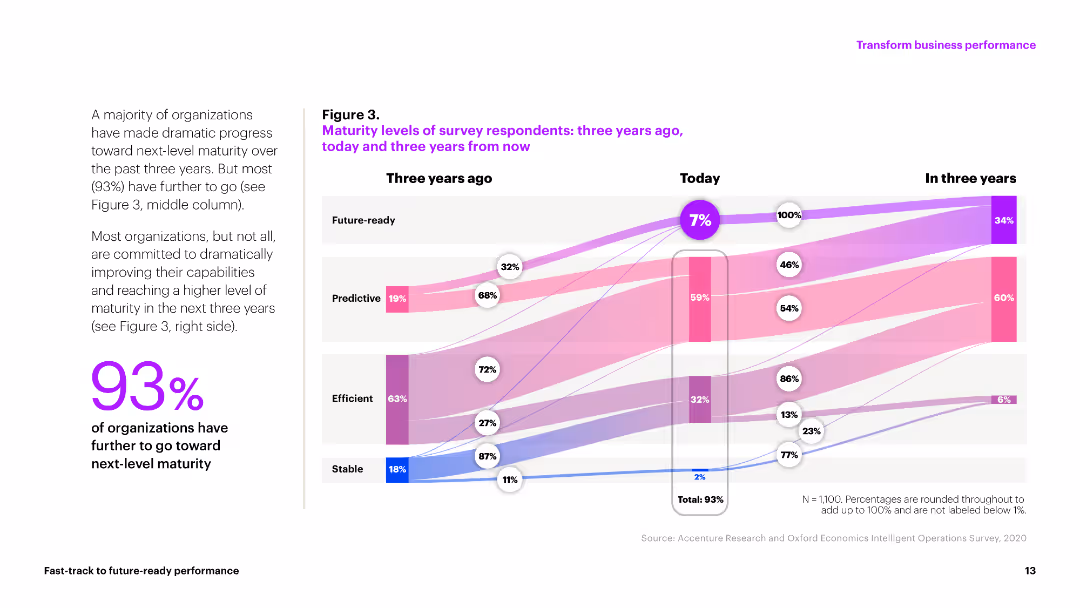
The slide contains a flow diagram comparing maturity levels of organizations over three years. The visual shows progression from stable to future-ready with multiple colored bands representing different stages.
Market Analysis and Trends
Professional Services
The slide depicts the maturity levels of organizations from three years ago, today, and projected for three years into the future. It highlights that only 7% are currently future-ready with 93% aiming to improve.
maturity, progress, organizations, future, stages
Mixed Chart
Accenture
Saved
The slide features a half-doughnut chart and a stepwise strategy block. The chart shows current and target records in terms of millions.
Strategic Planning
Financial Services
The slide presents a strategic plan for increasing record counts accessible for verification services, highlighting current standings, short-term and mid-term goals, and strategies to expand the client base and partnerships.
verification, records, strategy, growth, payroll
Mixed Chart
Barclays
Saved
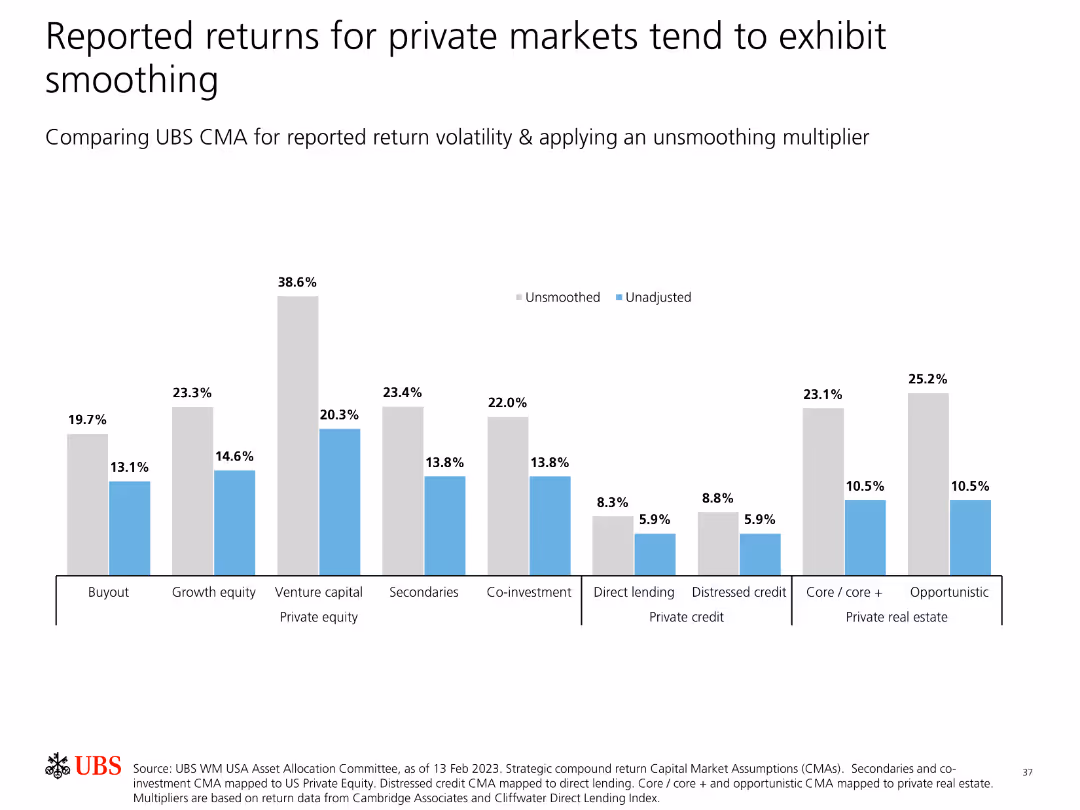
Contains bar charts comparing reported return volatility for private markets, applying an unsmoothing multiplier to show true volatility.
Risk Assessment and Management
Financial Services
Examines the smoothing effect in reported returns for private markets, applying an unsmoothing multiplier to reveal the actual return volatility compared to reported data.
Private Markets, Return Volatility, Smoothing, Unsmoothing, Analysis, Risk, Investment, Data Presentation, Strategy
Single Chart
UBS
Saved
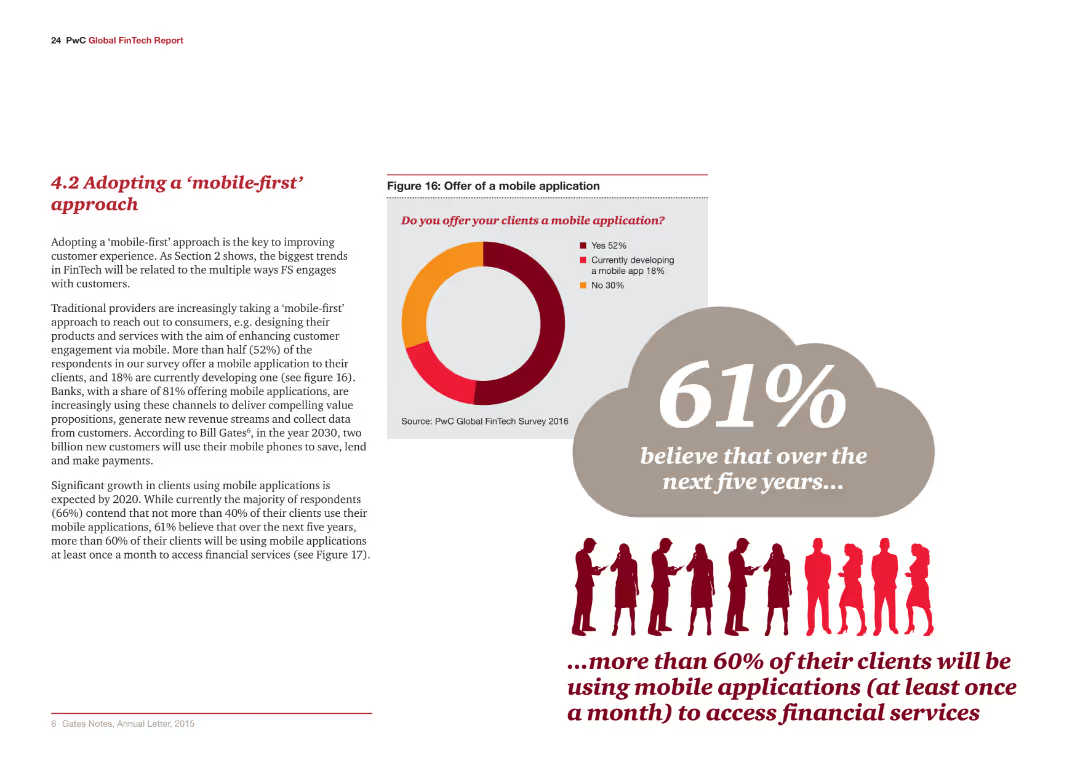
The slide includes a pie chart and text. The chart indicates trends and statistics on mobile application adoption among clients.
Technology and Digital Transformation
Financial Services
The slide discusses the anticipated growth in mobile application usage and its impact on financial services by 2020.
Mobile-first, trends, financial services, mobile applications, technology
Mixed Chart
PwC/Strategy&
Saved
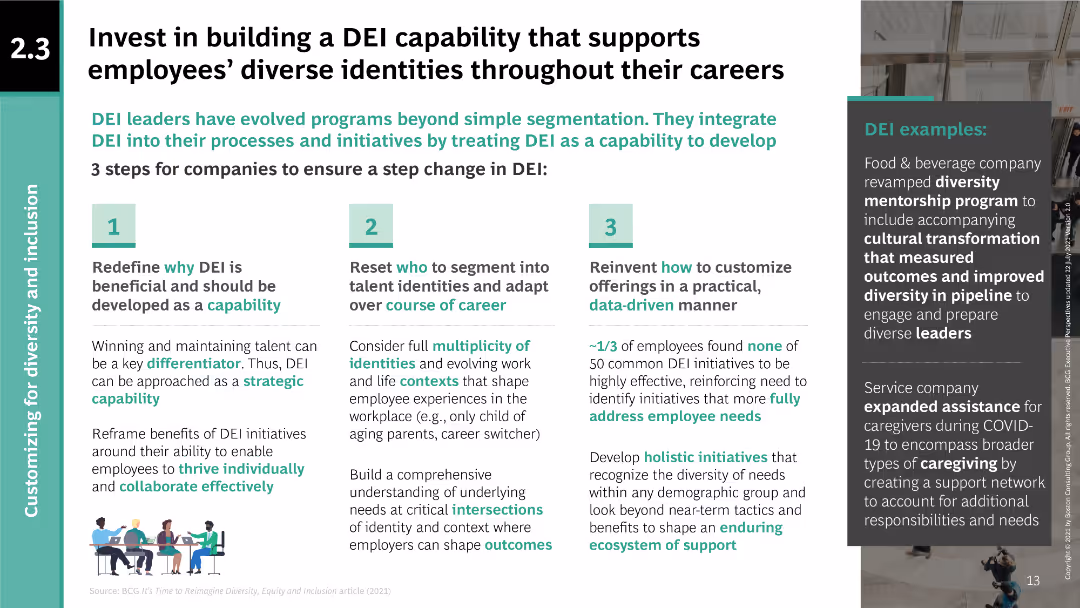
Three-step process diagram for building DEI capability; text explaining steps and examples.
Human Resources and Talent Management
Professional Services
Provides a framework for integrating DEI into company processes, highlighting steps to redefine, reset, and reinvent DEI initiatives to support diverse employee identities.
DEI, diversity, equity, inclusion, employee support, capability building, company processes, strategic initiatives, diversity mentorship
Linear Flow
BCG
Saved
Two pie charts showing the distribution of business banking relationships, accompanied by a column chart showing the growth of talech customers, using blue tones.
Sales and Business Development
Financial Services
Presents the expansion strategy in business banking, indicating the potential for deepening customer relationships and adding new customers through various payment solutions.
Business Banking, talech, Bento, Growth
Multiple Chart
Goldman Sachs
Saved
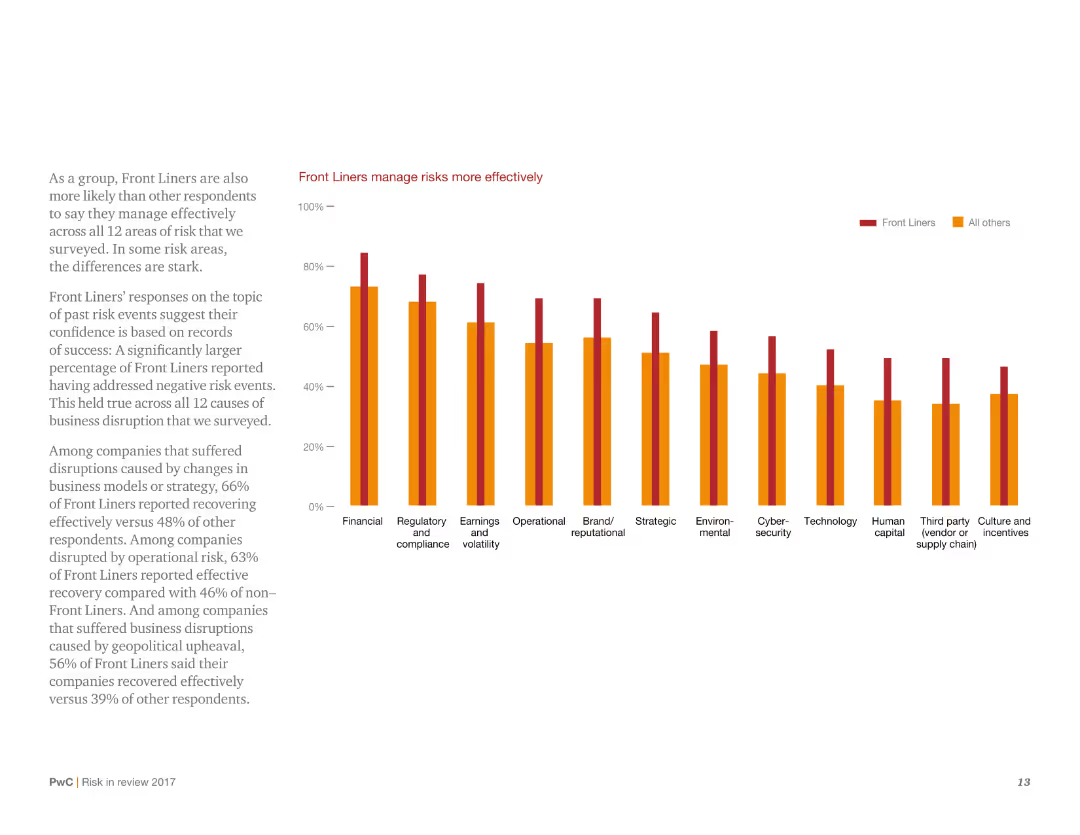
This slide presents a column chart showing the effectiveness of Front Liners in managing risks across multiple categories. It uses a simple design with minimal text, focusing on the comparison of Front Liners versus other respondents.
Risk Assessment and Management
Consumer Goods
It highlights that Front Liners are more effective in managing risks compared to other respondents, with higher percentages across various risk categories. The slide underscores the success rate of Front Liners in addressing negative risk events.
Risk management, effectiveness, Front Liners, survey, comparison
Mixed Chart
PwC/Strategy&
Saved
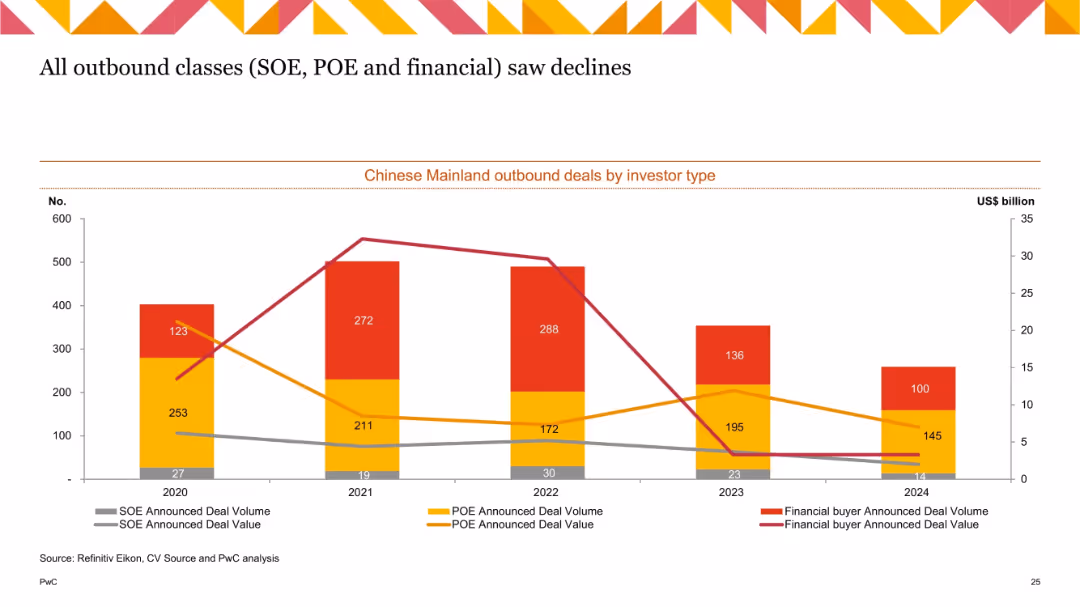
Stacked bar and line chart (2020–2024) showing SOE, POE, and financial buyer activity in terms of volume and value.
Investment Analysis
Government & Public Sector
This chart breaks down outbound Chinese deals by investor type—SOEs, POEs, and financial buyers—over five years. All categories show a downward trend in both value and volume, though POEs remain the most active by volume. The chart underscores broader headwinds for all investor types in outbound activity.
SOE, POE, financial buyers, China outbound, deal type, investment breakdown, volume and value
Single Chart
PwC/Strategy&
Saved
Three-column layout with text boxes detailing topline, source of funds, and usage of funds. Includes color-coded bar charts and callout boxes for financial targets.
Strategic Planning
Financial Services
Outlines financial targets for 2025, including revenue goals, operating margin, and funding sources. Also covers projected cash flow and fund allocation for acquisitions and CAPEX.
financial targets, strategy, revenue, funding, acquisitions
Multiple Chart
IPSOS
Saved
Previous
Next
If nothing, comes up, please save your slides first
Create a FREE account to continue browsing
Receive Instant Access to 1,000+ slides from companies like McKinsey, Google, and Goldman Sachs
First Name
Last Name
Email
Password
I agree to all
Terms & Privacy Policy
Thank you! Your submission has been received!
Oops! Something went wrong while submitting the form.
Have an account?
Sign in
Column Chart
Heatmap
Chevron
Org Chart
Infographic
Callouts
Timeline
List
Graphic
Picture
Process Flow
Diagram
Paragraph
Map
Table
Framework
Subtitle
Takeaway Box
Icon
Other Chart
Radar Chart
Waterfall Chart
Mekko Chart
Pie Chart
Scatter Plot
Line Chart
Bar chart
Bullet points