My Account
My Slides
Search by Category
Templates
Leave Feedback
Login
Logout
Get Started
Browse all Slides
Browse all Slides
Create a FREE Account
Instant access to 1,000+ real slides from top companies like McKinsey, BCG, Goldman Sachs, Google and many more!
First Name
Last Name
Email
Password
I agree to all
Terms & Privacy Policy
Thank you! Your submission has been received!
Oops! Something went wrong while submitting the form.
Have an account?
Sign in
Saved Slides
Includes a pie chart, a column chart and a couple of bar charts detailing digital maturity levels in financial sectors across regions.
Technology and Digital Transformation
Financial Services
Analysis of digital maturity in the financial sector, comparing firms across regions and types.
digital maturity, financial, sector, leadership, transformation
Multiple Chart
Deloitte
Saved
Features a column chart showing global hydrogen production by source and a text box with key considerations related to hydrogen production and CO2 emissions.
Market Analysis and Trends
Energy & Utilities
Explains the annual global hydrogen production and associated CO2 emissions, highlighting the predominance of fossil fuel-based production and its environmental impact.
Hydrogen production, CO2 emissions, fossil fuels, environmental impact, market trends
Multiple Chart
Kearney
Saved
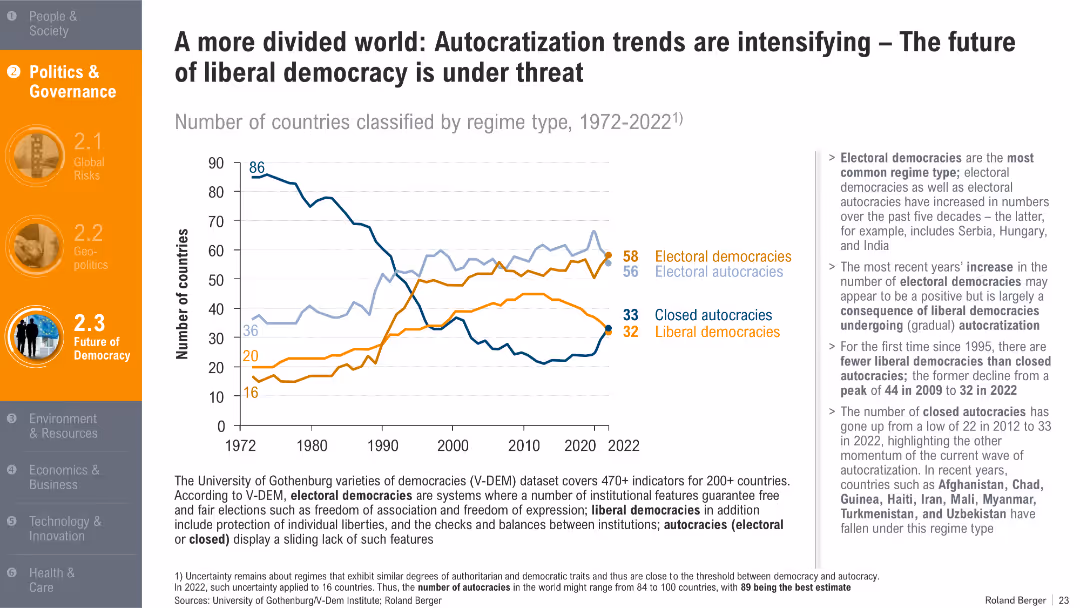
Line graph showing regime classification trends from 1972–2022; categorized by liberal/electoral democracies and autocracies.
Regulatory and Compliance
Government & Public Sector
The slide tracks the increase in electoral autocracies and decline in liberal democracies. It signals concern for the future of democratic governance and institutional freedoms.
autocracy, democracy, regime type, governance, liberal decline, political trends
Mixed Chart
Roland Berger
Saved
Slide includes column chart showing revenue distribution over years and textual information organized in bullet points on the right side.
Financial Performance
Financial Services
This slide presents the evolution of revenue streams from 2020 to 2023, highlighting the financial growth in various banking sectors such as Investment, Corporate, and Private Banking. It emphasizes strategic investments and innovations that have propelled client engagement and financial growth.
Revenue, Banking, Strategic Growth, Client Engagement, Financial Trends
Mixed Chart
Deutsche Bank
Saved
Features a mix of text and stacked bar chart, showing the sourcing requirements for EV batteries and the global production shares of battery materials.
Strategic Planning
Transportation & Logistics
Discusses sourcing strategies for EV batteries under new regulations, highlighting dependency on specific countries. Essential for supply chain strategists in the automotive sector.
EV batteries, sourcing, supply chain, regulations, automotive, global production, trade
Mixed Chart
BCG
Saved
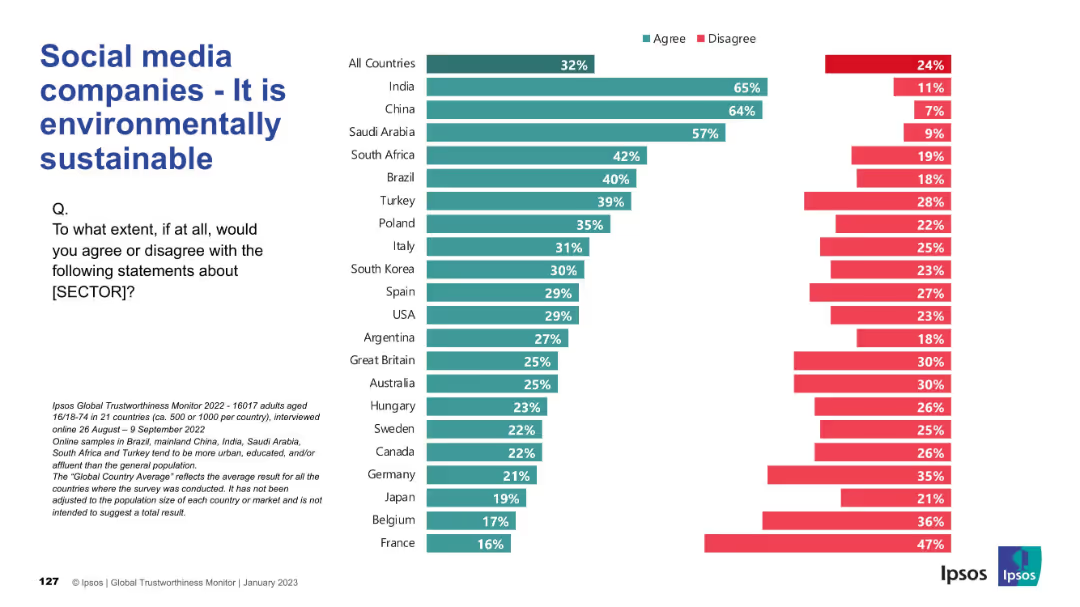
Horizontal bar chart with agreement and disagreement data on social media sustainability by country; consistent Ipsos format.
Market Analysis and Trends
Technology & Software
This slide measures beliefs about the environmental sustainability of social media companies. India and China again lead in trust, but Western nations generally show lower agreement, indicating a gap in environmental perception.
sustainability, environment, green trust, corporate responsibility, Ipsos, perception
Mixed Chart
IPSOS
Saved
The slide includes a column chart showing the percentage of people not in need of any help, with a detailed breakdown of specific types of help needed or not needed, comparing May and December data.
Client Case Studies
Healthcare & Pharmaceuticals
This slide presents data on the percentage of people not in need of any help, with a detailed breakdown of specific types of help needed or not needed, comparing May and December survey results.
help, not needed, survey, comparison, specific types, column chart, public opinion, healthcare, time periods
Single Chart
IPSOS
Saved
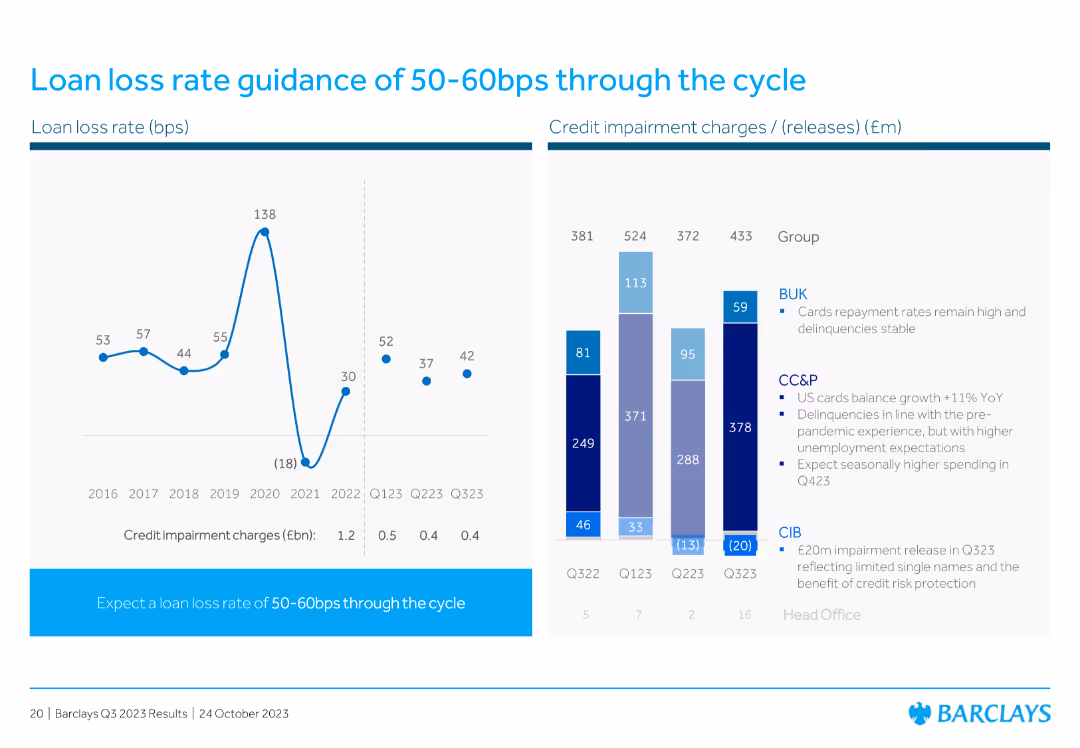
Contains a line chart showing loan loss rates over time and a column chart detailing credit impairment charges across different quarters. The slide is visually balanced and data-focused.
Risk Assessment and Management
Financial Services
The slide gives guidance on the expected loan loss rate and shows historical data on loan loss rates and credit impairment charges. The content emphasizes stability and projections.
loan loss, guidance, credit impairment, rates, historical data, projections, financial services
Multiple Chart
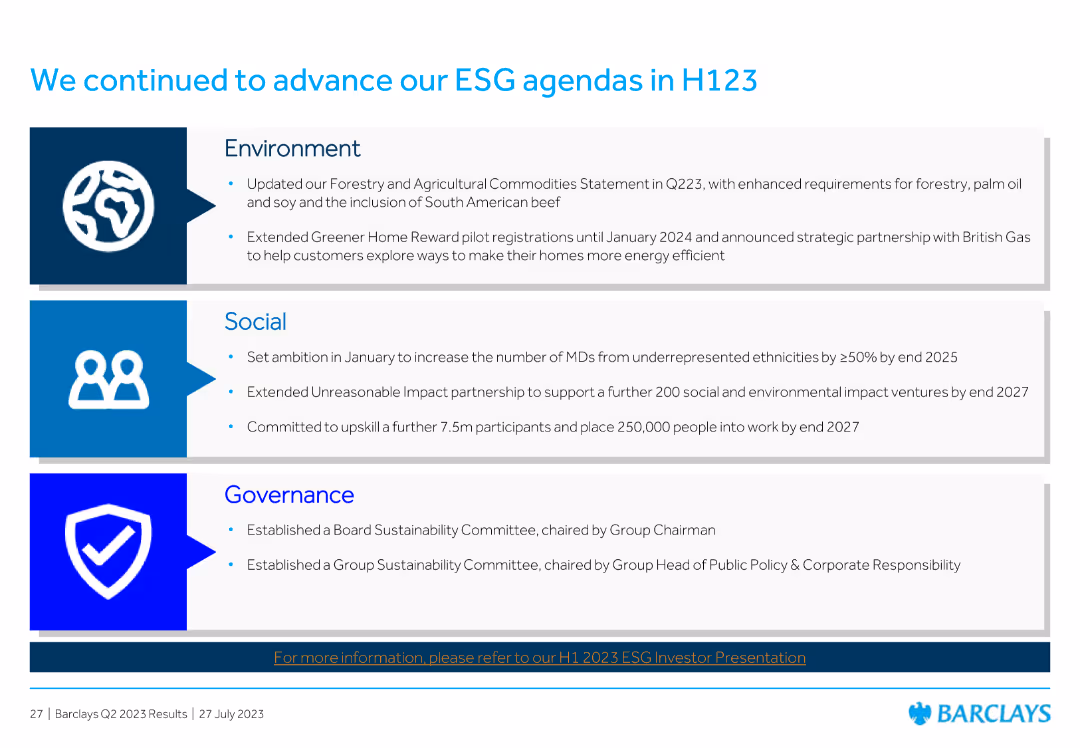
Barclays
Saved
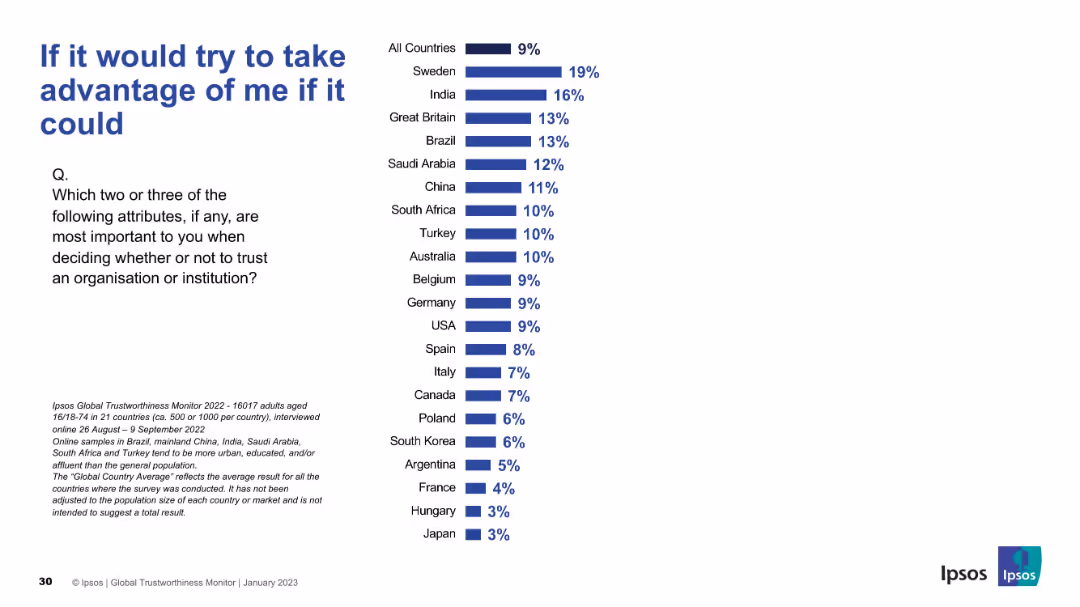
Reversed logic compared to other slides—lower percentages indicate higher tolerance. Sweden and India top the list.
Market Analysis and Trends
Professional Services
Explores the negative attribute of opportunism as a factor in distrust. Sweden and India show higher sensitivity, while Japan and Hungary are less reactive to this trait.
opportunism, distrust, red flags, Ipsos survey, consumer perception, manipulation
Mixed Chart
IPSOS
Saved
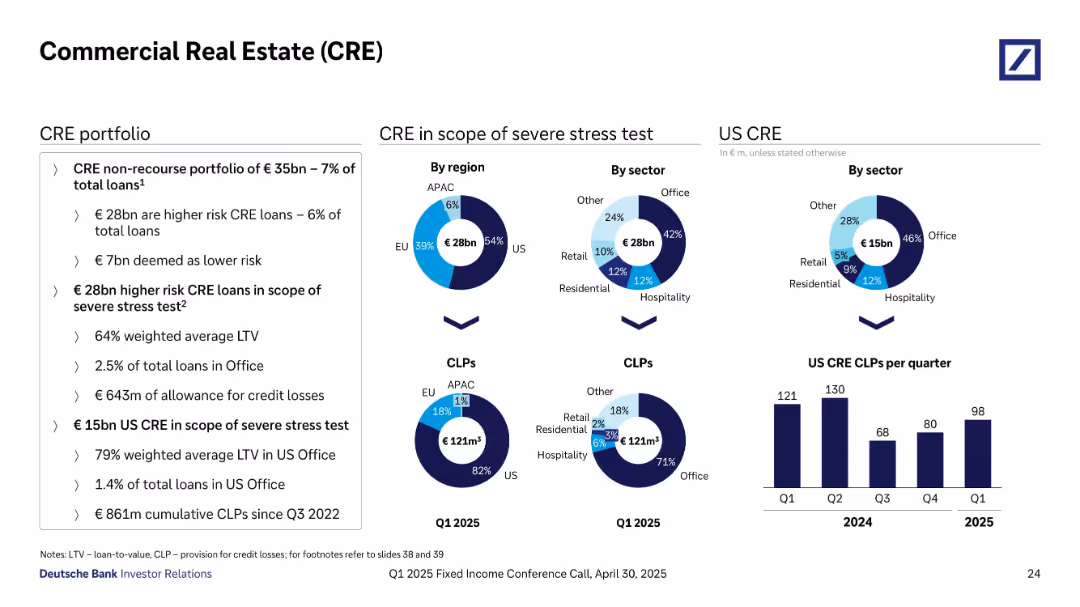
Multi-chart layout: pie charts, bar chart, and detailed text box on left.
Risk Assessment and Management
Financial Services
Provides an in-depth view of Deutsche Bank’s €35bn CRE loan portfolio, detailing risk categorization, geographic and sectoral exposure, and stress testing. Key stats include €28bn in higher risk loans, 64% LTV average, and €861m in cumulative CLPs. US CRE exposure and quarterly CLPs are visualized, emphasizing loan stress testing and sector distribution.
commercial real estate, CRE, loan stress test, US office, CLP, loan risk, loan-to-value, Deutsche Bank, Q1 2025, sector exposure
Multiple Chart
Deutsche Bank
Saved
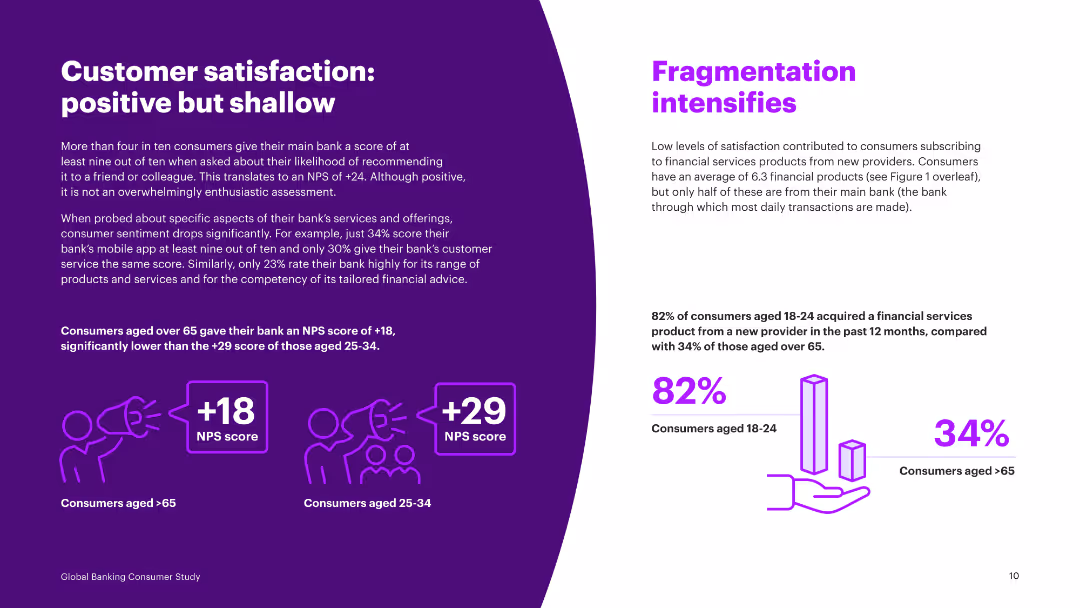
Comparative analysis using NPS scores for different age groups, with textual insights on customer satisfaction levels and service aspects.
Performance Metrics and KPIs
Financial Services
Provides a detailed look at customer satisfaction scores (NPS) by age group and the disparity in satisfaction with different banking services and features.
NPS, customer satisfaction, age groups, banking services, features, comparative, scores, insights, survey
Mixed Chart
Accenture
Saved
This slide features pie charts showing the distribution of research participants globally across different industries and job levels. The layout is straightforward, focusing on the data.
Market Analysis and Trends
Professional Services
This slide details the demographic and market analysis of global research participants, categorizing them by industry, job level, and organizational size. It provides a comprehensive view of the participant pool, aiding in understanding the global scope of the research and its relevance across different sectors and professional standings.
Research, Global, Demographics, Industry, Job Levels
Multiple Chart
Deloitte
Saved
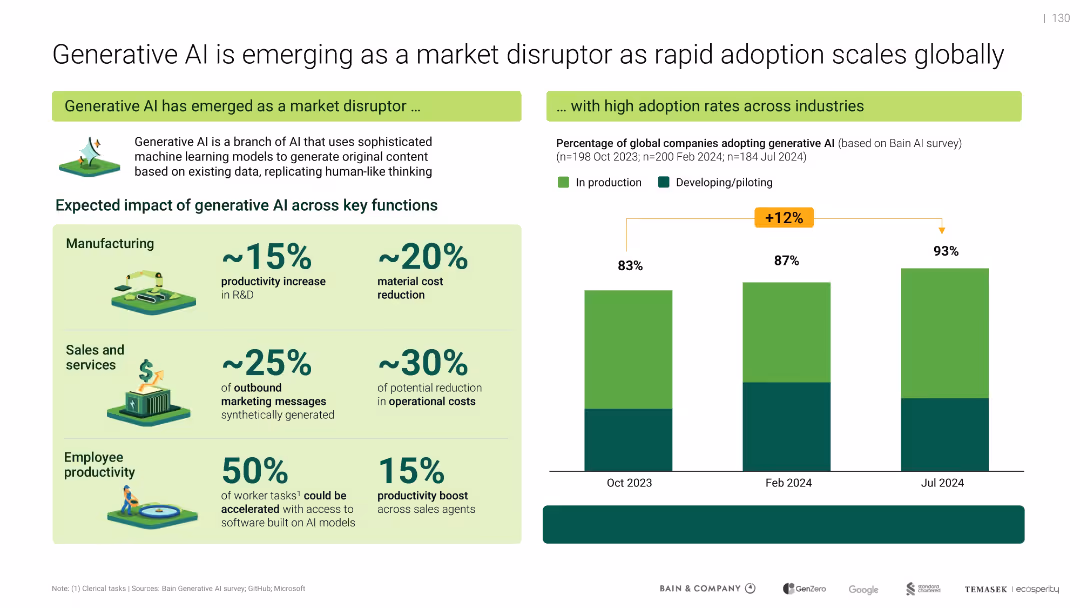
Left: table showing AI’s impact by function; Right: bar chart tracking AI adoption across companies; bright icons and color-coded bars.
Market Analysis and Trends
Artificial Intelligence
Describes generative AI’s growing influence, with 93% of global companies using or piloting it by mid-2024. Shows productivity benefits in manufacturing, sales, and employee tasks. Predicts disruption across key operational areas.
generative AI, productivity, adoption, disruption, enterprise, impact
Mixed Chart
Bain
Saved
Horizontal bar chart ranked by country; “Likely” vs “Unlikely” opinions; placeholder [COUNTRY] in title
Regulatory and Compliance
Government & Public Sector
This slide surveys global expectations for bans on under-14 social media use. India and Malaysia show highest belief in such regulation; global average is 28%.
social media, regulation, youth, child safety, digital access, parental control, policy, internet usage, Ipsos
Mixed Chart
IPSOS
Saved
Two donut charts side by side comparing the share of FDI in Central America from the USA between 2021 and 2022. Each segment is color-coded.
Investment Analysis
Financial Services
The slide compares the share of Foreign Direct Investment in Central America from the USA for the years 2021 and 2022, highlighting the changes in investment distribution by country.
FDI, Central America, USA, donut chart, comparison
Multiple Chart
Deloitte
Saved
Features column charts showing CET1 ratio movements and key messages related to financial metrics.
Financial Performance
Financial Services
Highlights CET1 ratio movements and the significant headroom to the MDA, including regulatory updates and key financial data.
CET1, ratio, MDA, financial, regulatory
Header Vertical
Barclays
Saved
The slide lists key themes in three sections: revenue initiatives, cost discipline and operating leverage, and prudent risk management, with a central diagram for risk.
Strategic Planning
Financial Services
This slide outlines the strategic themes for 2020, focusing on revenue initiatives, cost discipline, operating leverage, and risk management within the Swiss Universal Bank.
Key themes, 2020, strategic planning, revenue initiatives, risk management
Diagram
Credit Suisse
Saved
This slide includes a content layout with an organized table, icons for different aspects (People, Process, Technology), and a timeline outline. The slide is dense with text and data.
Regulatory and Compliance
Government & Public Sector
Slide includes implementation requirements, timeline outline, and risks. Features text blocks and icons for each section.
Discusses the development of in-state ITS residential options for individuals with complex care needs, outlining necessary steps and potential risks.
Table
Alvarez & Marsal
Saved
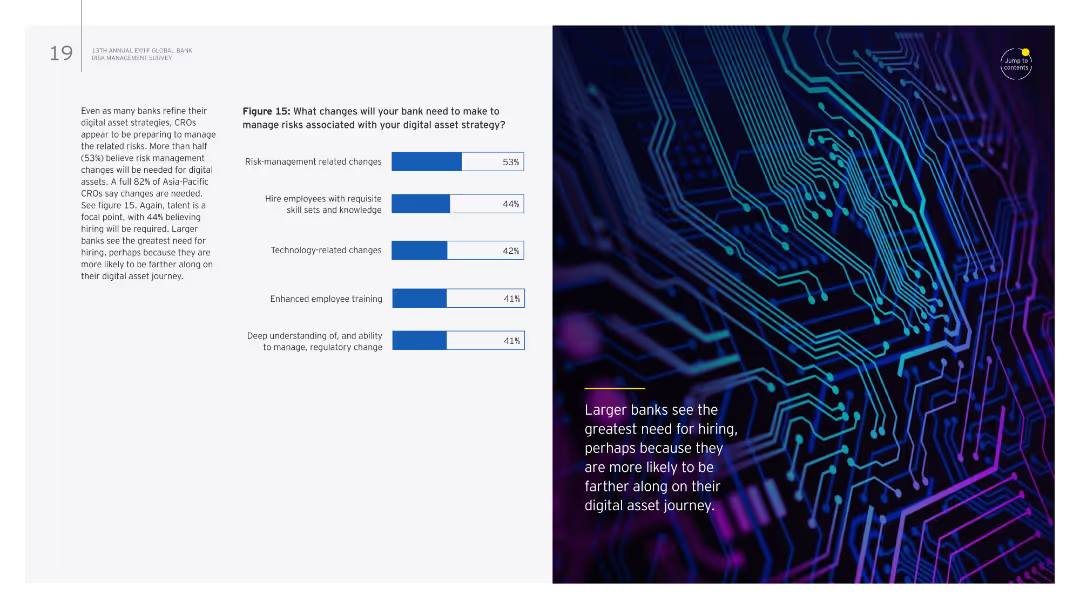
The slide combines text with a column chart on the right. The chart lists changes needed in banks to manage risks associated with digital asset strategies.
Risk Assessment and Management
Financial Services
It details necessary changes for banks to manage digital asset strategy risks, focusing on risk management, hiring, technology, training, and regulatory understanding.
Digital assets, risk management, hiring, technology, training
Mixed Chart
EY
Saved
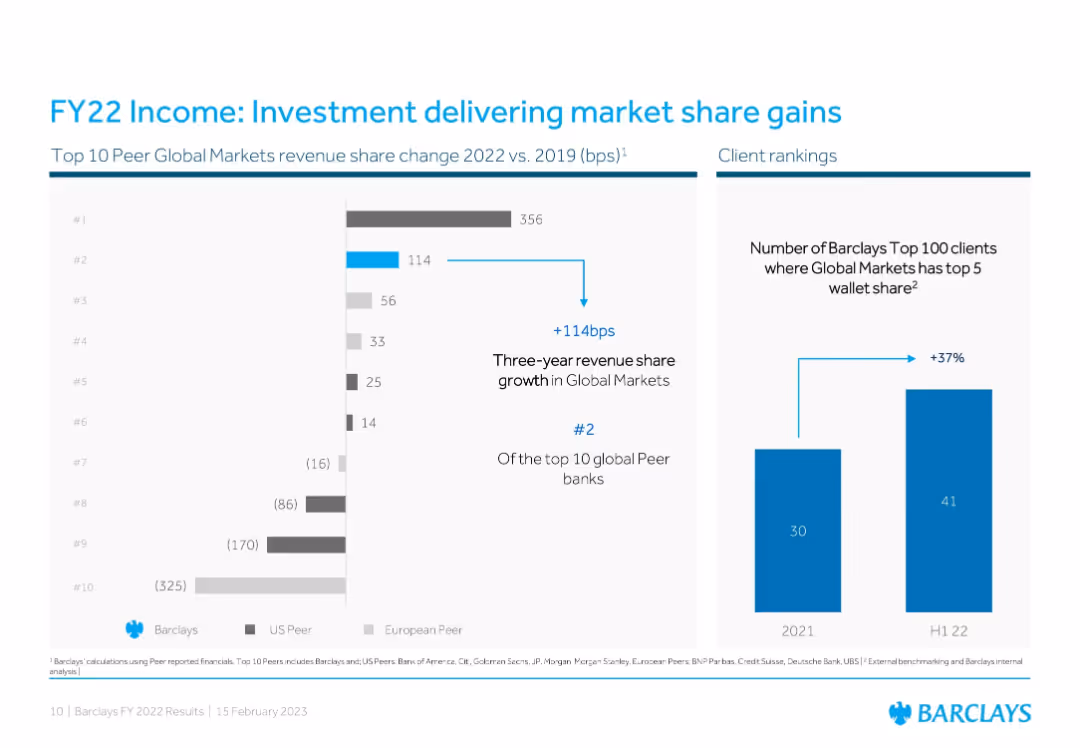
Two-panel layout: bar chart on peer comparison + vertical bar on client rankings
Competitive Landscape
Financial Services
Demonstrates Barclays’ improvement in Global Markets revenue share and client penetration. A bar chart shows Barclays gaining 114 bps since 2019, ranking #2 among peers, while a second graph shows a 37% rise in top-client share penetration.
Market Share, Barclays, Client Ranking, Global Markets, Peer Comparison, Revenue, FY22
Multiple Chart
Barclays
Saved
Includes a column chart displaying changes in visibility for investment decisions.
Investment Analysis
Financial Services
Discusses how C-suite executives' visibility into making investment decisions has improved from 2023 to 2024, driven by various factors including capital availability and regulatory changes.
investment decisions, C-suite, visibility, factors
Multiple Chart
BCG
Saved
The slide features multiple column charts on a dark background, focusing on technology-enhanced healthcare preferences, with white and yellow text.
Technology and Digital Transformation
Healthcare & Pharmaceuticals
It highlights consumer readiness for personalized medicine, genetic testing, and wearable technology in healthcare.
technology, personalized care, genetic testing, survey, Germany
Mixed Chart
EY
Saved
The slide presents stacked column charts representing capital movement with labels for dates and financial segments. It uses a color gradient to differentiate segments within the bars.
Financial Performance
Financial Services
This slide shows capital movement within Macquarie Capital over two time points, highlighting changes across different financial sectors like debt and various types of energy investments.
Capital, Investments, Realizations, FX, Debt
Single Chart
Morgan Stanley
Saved
Contains a map of the U.S. with color-coded regions, table comparing the company to its peers, and a clear textual overview of assets, deposits, and loans.
Industry Overview
Financial Services
Overview of the company's financial standing, market position, and operational scope, suitable for introducing the company to stakeholders or for orientation purposes.
financial overview, market position, company scope, operational reach
Graphic
Goldman Sachs
Saved
Featuring a straightforward layout with a bar chart, this slide examines the financial impact of delayed technology adoption on business agility and growth. It shows the percentage of revenue change against the backdrop of technology investment in different years, providing a stark comparison of business performance with and without adequate tech support.
Technology and Digital Transformation
Technology & Software
This slide illustrates the detrimental financial effects of postponing technological advancements within organizations. It compares revenue growth and tech debt levels, providing a clear argument for why timely technological updates are essential for maintaining competitiveness and fostering growth in today's digital economy.
technology transformation, delayed investment, financial impact, tech debt, competitiveness, column chart
Mixed Chart
Accenture
Saved
Previous
Next
If nothing, comes up, please save your slides first
Create a FREE account to continue browsing
Receive Instant Access to 1,000+ slides from companies like McKinsey, Google, and Goldman Sachs
First Name
Last Name
Email
Password
I agree to all
Terms & Privacy Policy
Thank you! Your submission has been received!
Oops! Something went wrong while submitting the form.
Have an account?
Sign in
Column Chart
Heatmap
Chevron
Org Chart
Infographic
Callouts
Timeline
List
Graphic
Picture
Process Flow
Diagram
Paragraph
Map
Table
Framework
Subtitle
Takeaway Box
Icon
Other Chart
Radar Chart
Waterfall Chart
Mekko Chart
Pie Chart
Scatter Plot
Line Chart
Bar chart
Bullet points


![Children under 14 in [COUNTRY] will be banned from using social media](https://cdn.prod.website-files.com/654e70fb59937215cac87b19/6899b95ee44404f6f3c16dbd_qROGhk2ldmPp3HP2t1lKIRGByOAa2DXOUUaKEJG1Brc.avif)