My Account
My Slides
Search by Category
Templates
Leave Feedback
Login
Logout
Get Started
Browse all Slides
Browse all Slides
Create a FREE Account
Instant access to 1,000+ real slides from top companies like McKinsey, BCG, Goldman Sachs, Google and many more!
First Name
Last Name
Email
Password
I agree to all
Terms & Privacy Policy
Thank you! Your submission has been received!
Oops! Something went wrong while submitting the form.
Have an account?
Sign in
Saved Slides
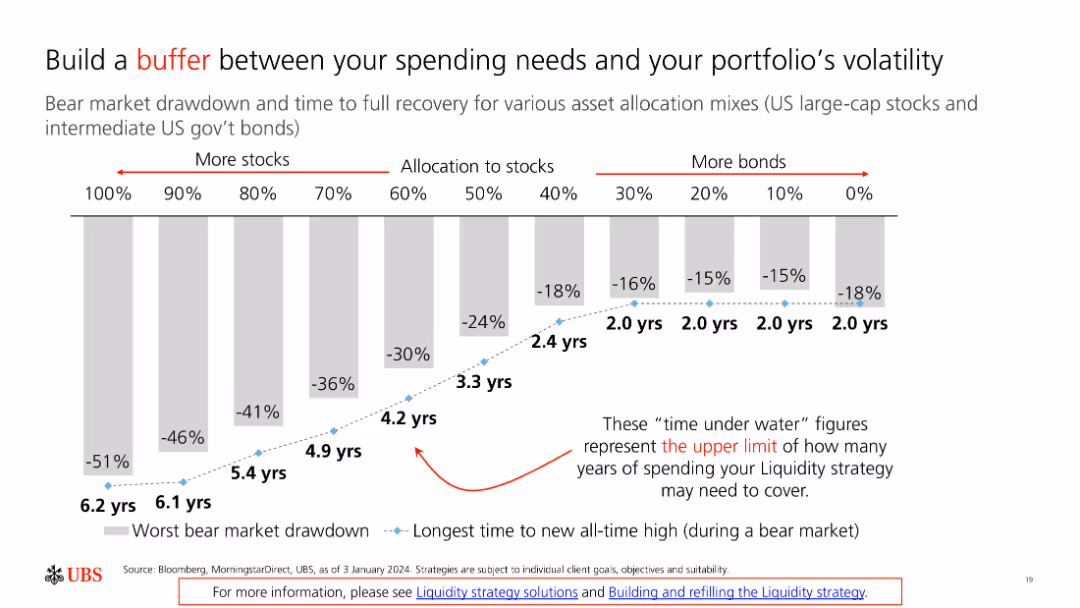
The slide includes a bar chart showing bear market drawdowns and recovery times for different asset allocation mixes, from 100% stocks to 100% bonds.
Risk Assessment and Management
Financial Services
The slide discusses strategies to mitigate portfolio volatility by adjusting asset allocation, highlighting the importance of having a financial buffer.
Portfolio, Volatility, Buffer, Asset Allocation, Risk
Single Chart
UBS
Saved
This slide features a pyramid diagram with text boxes, highlighting strategies and actions. There is also a bullet point text section on the right side.
Strategic Planning
Transportation & Logistics
The slide outlines the National Freight and Supply Chain Strategy, detailing actions and priority actions for improving freight performance and efficiency.
Strategy, Freight, Supply Chain, Logistics, Data
Diagram
LEK
Saved
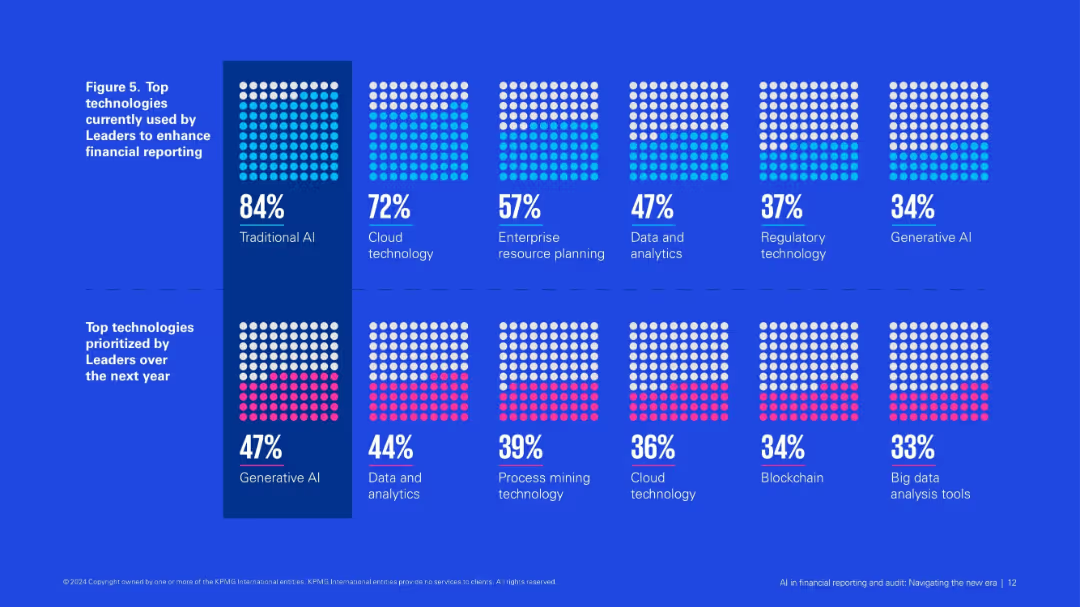
Grid of dotted square visuals showing adoption percentages of various technologies, split by current use and future priorities.
Product and Service Analysis
Financial Services
Visualizes technologies currently used and prioritized by AI Leaders in financial reporting. Traditional AI and cloud dominate current use, while generative AI and data analytics top future priorities.
traditional AI, generative AI, cloud tech, financial reporting, future priorities, ERP, blockchain
Single Chart
KPMG
Saved
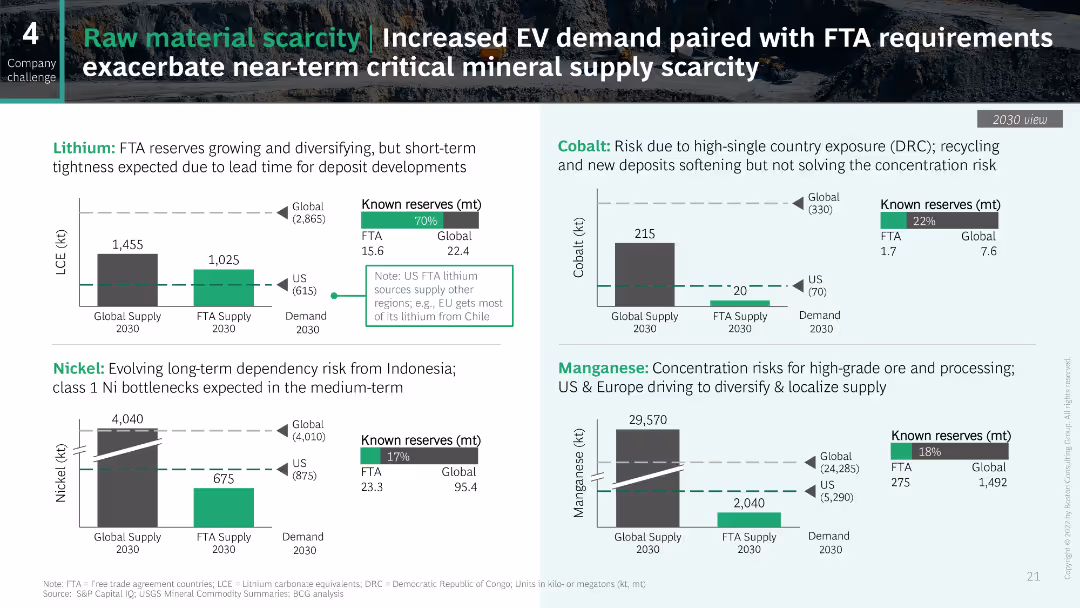
The slide contains multiple column charts and text boxes showing data on lithium, nickel, cobalt, and manganese reserves and supply for 2030. Each section is color-coded for clarity.
Risk Assessment and Management
Industrial & Manufacturing
This slide highlights the scarcity of critical raw materials for EVs, showing known reserves and global supply versus demand projections for 2030 for lithium, nickel, cobalt, and manganese.
Raw materials, EV demand, Supply scarcity, Lithium, Nickel, Cobalt, Manganese
Multiple Chart
BCG
Saved
Consists of multiple bar charts comparing factors influencing employee turnover.
Human Resources and Talent Management
Professional Services
Offers insights into the drivers of employee turnover, valuable for developing effective retention strategies.
Employee Turnover, Retention Strategies, Job Satisfaction, HR Management, Workforce Analysis
Single Chart
PwC/Strategy&
Saved
Comparative charts detailing monthly sales changes for passenger vehicles in multiple countries, using color-coded bars.
Market Analysis and Trends
Transportation & Logistics
Reviews the recovery in passenger vehicle sales post-pandemic, useful for market analysis and predicting future consumer behavior in the auto industry.
auto sales, market recovery, pandemic impact, consumer behavior, sales analysis
Multiple Chart
BCG
Saved
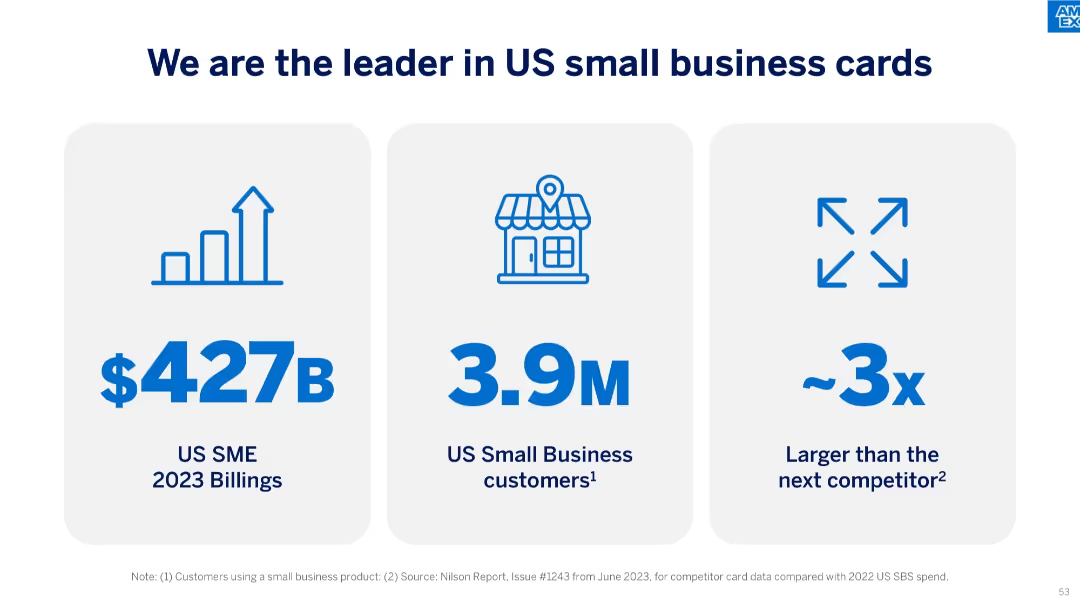
A 3-column layout using icons and large text, showing 2023 US SME billings, customer count, and scale vs. competition.
Strategic Planning
Financial Services
This slide emphasizes American Express’ leadership in the small business card sector, highlighting $427B in 2023 billings, 3.9M customers, and being roughly three times larger than the next competitor.
leadership, SME, billings, customer base, scale advantage, US market, credit cards, strategic positioning
Pillar
McKinsey
Saved
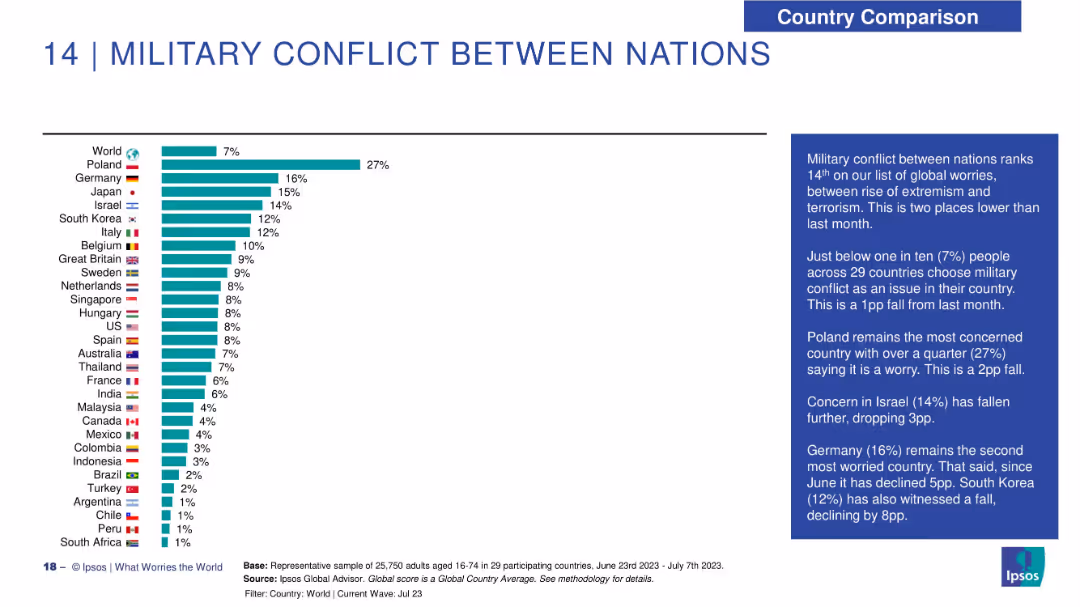
Horizontal bar chart with 29-country comparison on concern over international conflict; text box to the right.
Risk Assessment and Management
Government & Public Sector
Military conflict is a lesser global concern (7% globally), but significant in Poland (27%). The text notes declining concerns in Israel, South Korea, and Germany, with comparative analysis from the previous month.
net trust, profession ranking, Ipsos survey, societal trust, ethics, role credibility, distrust
Mixed Chart
IPSOS
Saved
This slide is textual with bullet points under three categories highlighting ongoing technology investments, with additional boxes emphasizing productivity and efficiency through software engineering, platform simplification, and portfolio governance.
Technology and Digital Transformation
Financial Services
Designed for IT strategists and financial executives, it underscores the firm’s commitment to technological advancements, emphasizing specific areas of investment aimed at driving innovation, productivity, and enhanced client experiences in the financial industry.
technology investment, productivity, efficiency, digital transformation, software engineering, IT strategy
Header Vertical
JP Morgan
Saved
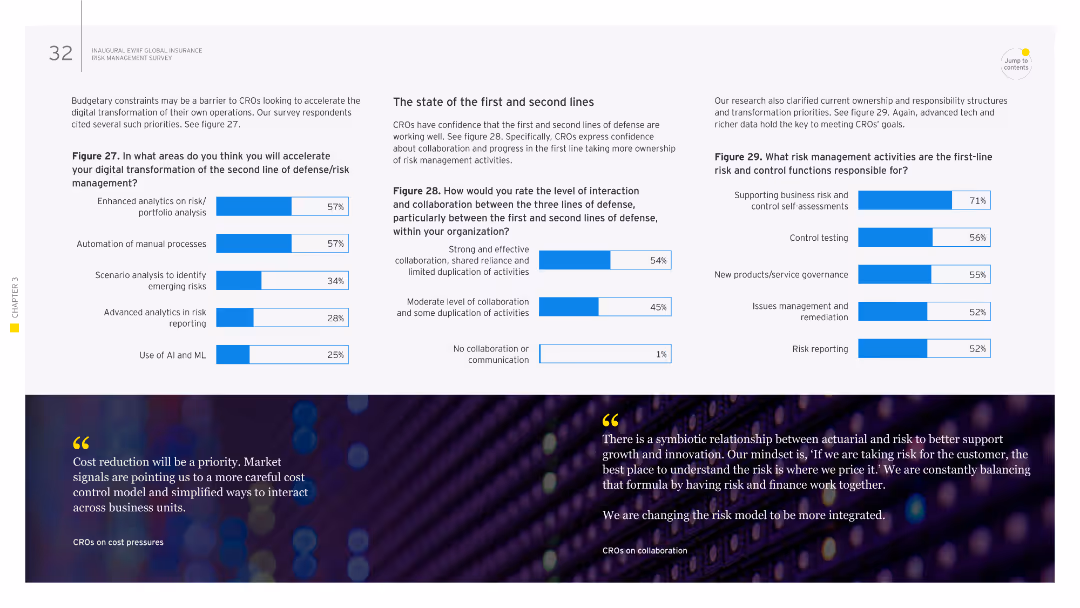
This slide includes several column charts depicting areas of improvement for risk management functions, focusing on analytics, automation, and collaboration between lines of defense.
Operational Efficiency
Financial Services
It discusses how CROs evaluate the interaction between the first and second lines of defense, with emphasis on analytics, automation, and collaboration in risk management activities. The slide helps in understanding the operational efficiency of risk management practices.
risk management, first line, second line, collaboration, automation, analytics
Multiple Chart
EY
Saved
The slide features pie charts showing improvements in self-confidence, presentation skills, and business networking skills for participants in the program.
Regulatory and Compliance
Environmental Services & Sustainability
The slide highlights the Sustainable Futures program, which supports young people in achieving DEI goals and understanding business sustainability practices.
Sustainable Futures, DEI, business sustainability, skills development
Multiple Chart
EY
Saved
This slide presents line graphs tracking the mobility trends related to workplaces, public transit, and retail & recreation areas across multiple countries (US, Sweden, Italy, Germany, South Korea, Japan). Each country's trends are plotted on a distinct graph with lines representing different mobility aspects, using a consistent color code. The graphs are annotated with key events such as lockdowns, making it easier to correlate changes in mobility with pandemic-related restrictions. The layout facilitates cross-country comparisons.
Operational Efficiency
Retail & E-commerce
Analyzing changes in mobility patterns can help understand the economic and operational impact of COVID-19 on different sectors. This slide offers insights into how mobility levels correlate with lockdown measures and the gradual reopening of economies. It is particularly useful for retail and e-commerce industries to gauge consumer behavior changes and plan logistics or marketing strategies accordingly. The data can guide decisions on store reopenings, staff allocations, and inventory management based on regional consumer mobility trends.
mobility, COVID-19, retail, public transit, workplaces, lockdown, reopening, consumer behavior
Multiple Chart
BCG
Saved
Contains a descriptive block on the left about Palsgaard's focus, a complex table in the center with checkboxes marking the strategic direction in relation to specific SDGs, and the SDG logos for 'Responsible Consumption' and 'Climate Action'.
Strategic Planning
Environmental Services & Sustainability
This slide details Palsgaard’s strategic focus on SDG 12 and 13, highlighting initiatives like responsible resource use and CO2 emissions reduction. The central table checks align Palsgaard’s operations with these SDGs, pointing out their commitment to innovation in sustainability and the impact on operational costs and global CO2 management.
SDG 12, SDG 13, Sustainability, CO2 Reduction, Resource Management
Table
McKinsey
Saved
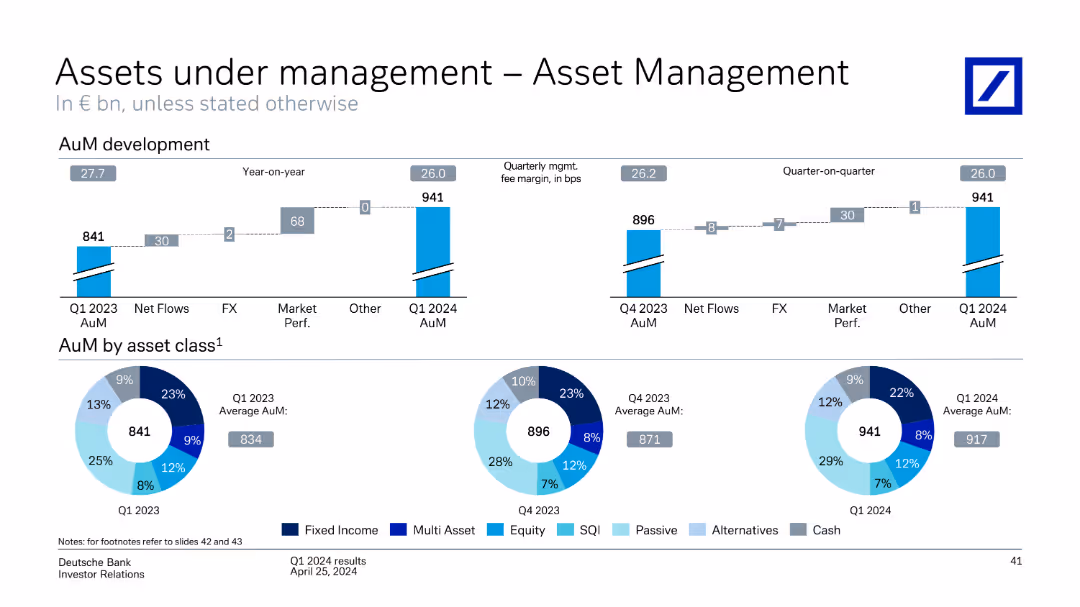
The slide contains column charts and pie charts showing assets under management development, including net flows, market performance, and asset class distribution.
Financial Performance
Financial Services
Discusses the development of assets under management in asset management, highlighting quarterly changes, asset class distribution, and market performance.
assets under management, asset management, net flows, market performance, asset class, financial performance
Multiple Chart
Deutsche Bank
Saved
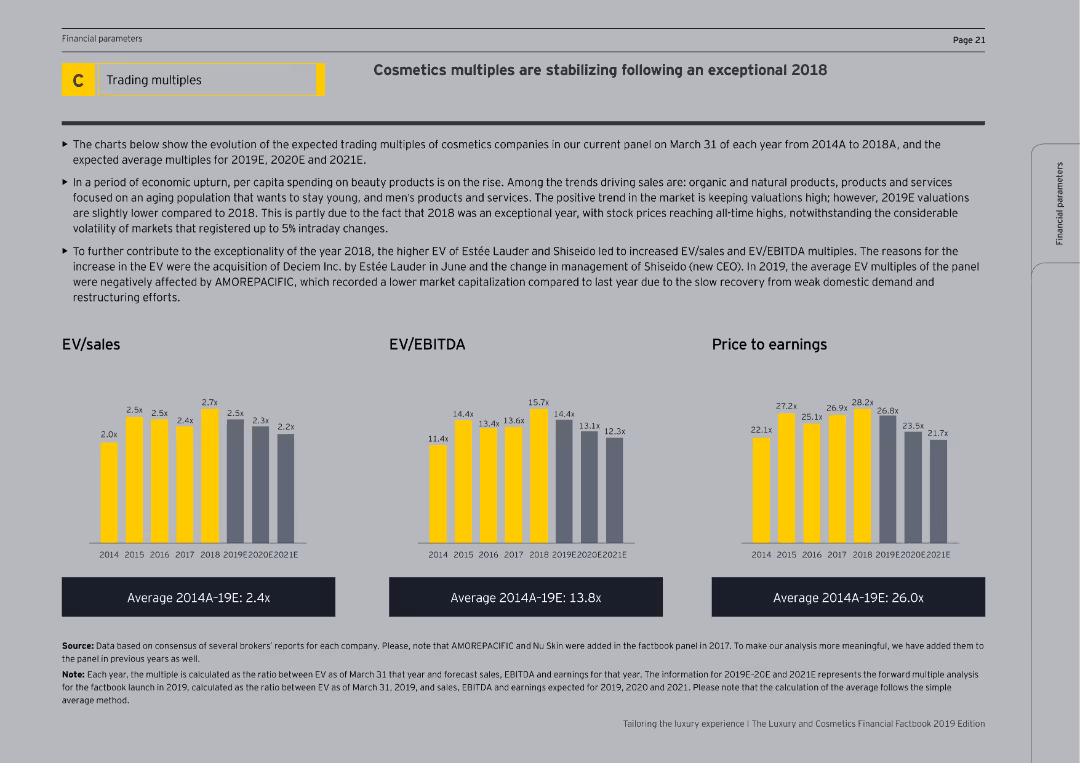
The slide includes column charts showing EV/sales, EV/EBITDA, and price to earnings ratios from 2014 to 2021E. The slide is moderately complex with a thorough analysis of the cosmetics market and factors affecting these financial multiples.
Market Analysis and Trends
Consumer Goods
The slide discusses the stabilization of cosmetics multiples following an exceptional 2018, presenting EV/sales, EV/EBITDA, and price to earnings ratios. It explains market trends, including increased spending on beauty products and the impact of organic and natural products on valuations.
Cosmetics, EV/Sales, EV/EBITDA, Price to Earnings
Multiple Chart
EY
Saved
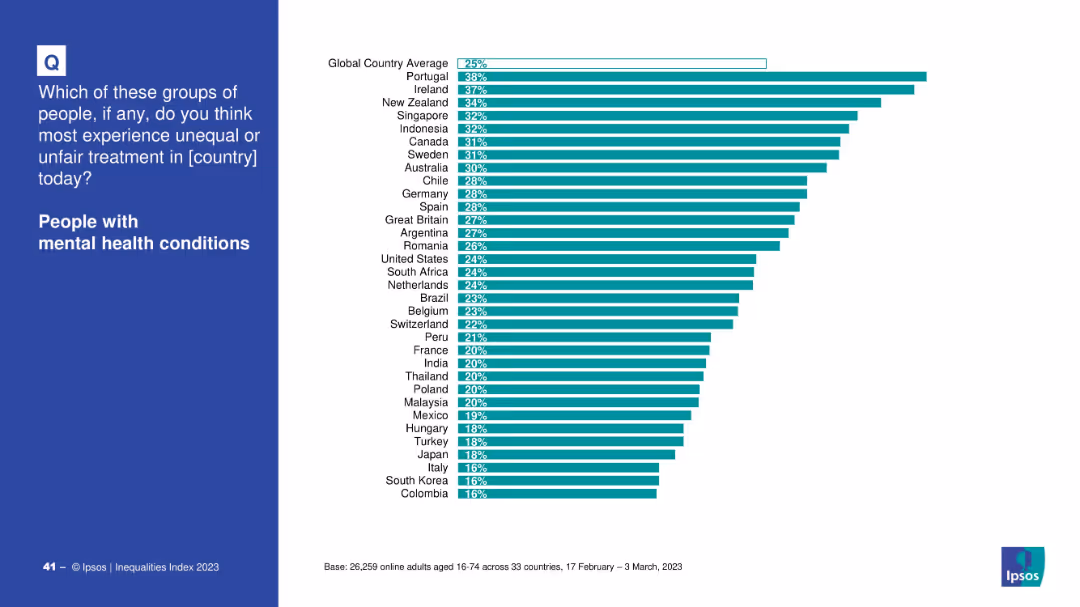
Blue question panel with right-hand bar chart ranking countries by perceived unfair treatment.
Market Analysis and Trends
Healthcare & Pharmaceuticals
Ranks countries based on the percentage of people who believe those with mental health conditions face unfair treatment. Portugal and Ireland are highest.
mental health, discrimination, country comparison, inequality, treatment, global perception
Mixed Chart
IPSOS
Saved
The slide features a multi-column table comparing performance metrics across Europe, North America, and South America, with each region highlighted in a different color. There are metrics like RoTE and efficiency ratios with 2019 data and mid-term goals. Icons representing each region add a visual element. The slide uses a combination of red, pink, and light blue, with the Santander logo in the corner and a watermark of the company logo in the background.
Operational Efficiency
Financial Services
This slide compares the bank's operational performance metrics by region and outlines goals for improvement. It's suited for internal strategic discussions or investor presentations to demonstrate operational efficiency and targets in different markets.
Regional Performance, RoTE, Efficiency, Santander, Banking Metrics, Performance Goals, Operational Analysis, Financial Targets
Table
Morgan Stanley
Saved
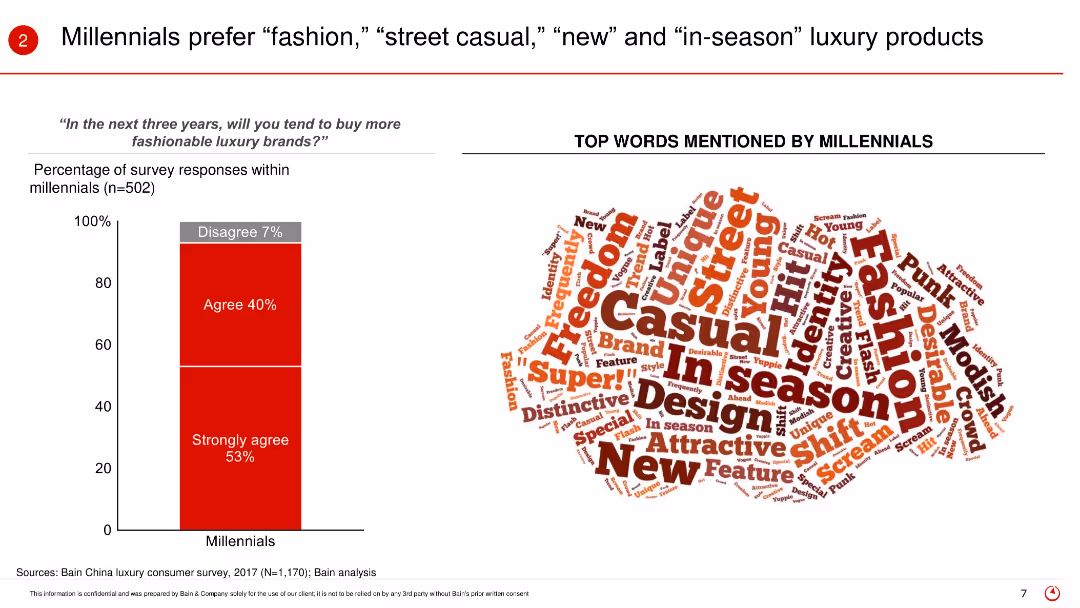
The slide uses a bar (column) chart to present the percentage of Millennials agreeing or strongly agreeing to buy more fashionable luxury brands in the next three years. It also features a word cloud illustrating the top words mentioned by Millennials when describing their luxury preferences.
Market Analysis and Trends
Retail & E-commerce
The slide focuses on the preferences of Millennials for luxury products, indicating a strong inclination towards fashion, street casual, new, and in-season items. It shows the survey results where a significant percentage of Millennials agree or strongly agree to buy more fashionable luxury brands in the coming years.
Millennials, luxury preferences, fashion, street casual, in-season, word cloud, consumer survey, future trends, buying behavior
Mixed Chart
Bain
Saved
Displays a line chart showing the Japan Specific Health Adjustment Factor (SMR) over time, with text detailing the proposed factor for 2023.
Market Analysis and Trends
Financial Services
This slide proposes a Japan Specific Health Adjustment Factor for 2023, using a rolling 3-year weighted average, showing the historical data trend.
Japan, health adjustment, SMR, financial services, market trends
Mixed Chart
Oliver Wyman
Saved
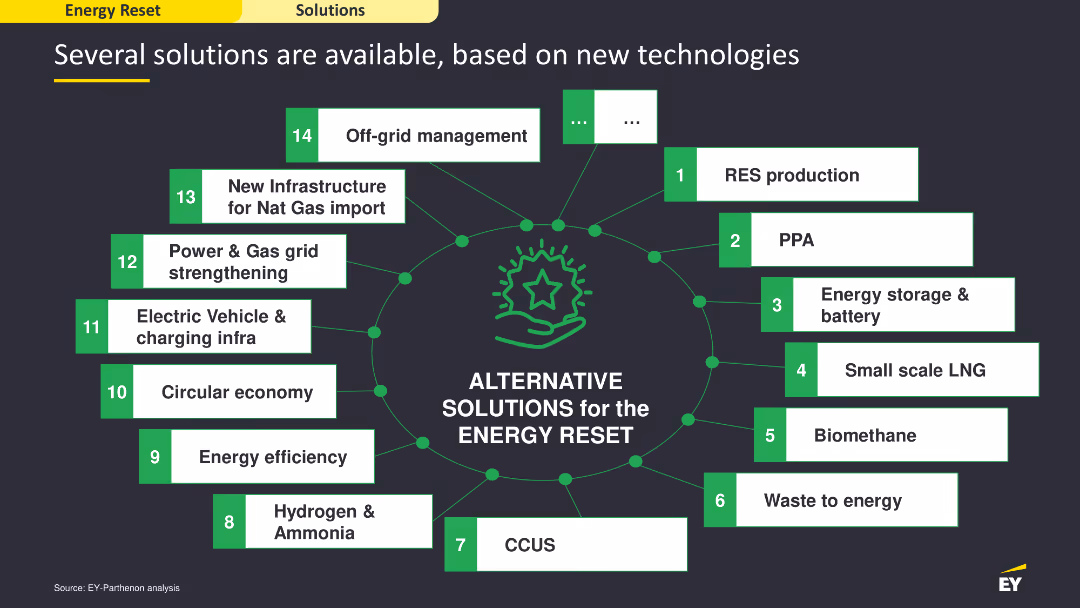
This slide features a central diagram with multiple connected nodes, each representing a different solution for energy reset. It uses green and white colors, with icons and text to illustrate each solution. The layout is moderately complex, focusing on the various technological solutions available.
Technology and Digital Transformation
Energy & Utilities
The slide showcases various technological solutions for the energy reset, highlighting options like RES production, PPA, energy storage, and more. It emphasizes the availability of multiple solutions to address energy challenges, providing a comprehensive overview of the technological landscape for energy transformation.
energy solutions, technology, digital transformation
Diagram
EY
Saved
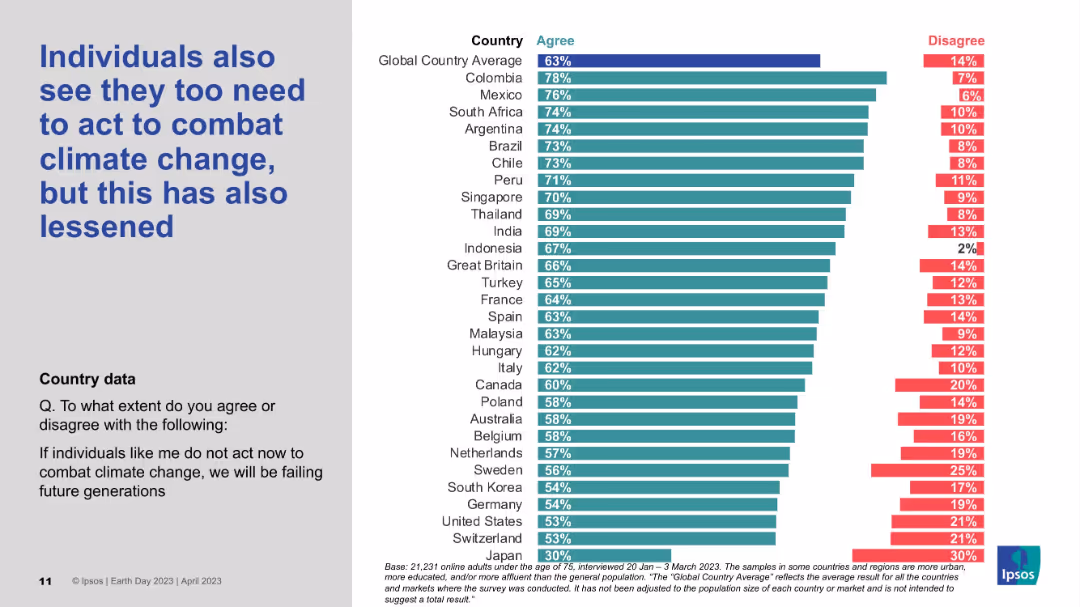
Vertical bar chart by country, measuring agreement/disagreement on individual responsibility; styled like previous slides.
Strategic Planning
Environmental Services & Sustainability
The data reflects decreasing belief that individuals must take personal action to address climate change. Despite the decline, countries like Colombia, Mexico, and South Africa still report strong agreement, while Japan shows the lowest individual sense of duty.
Personal responsibility, Climate perception, Ipsos survey, Individual action, Global data
Mixed Chart
IPSOS
Saved
Slide with map and pie charts showing family and care responsibilities of refugees.
Client Case Studies
Government & Public Sector
Discusses familial responsibilities of refugees traveling to Poland.
refugees, family, care responsibilities, Poland
Multiple Chart
Deloitte
Saved
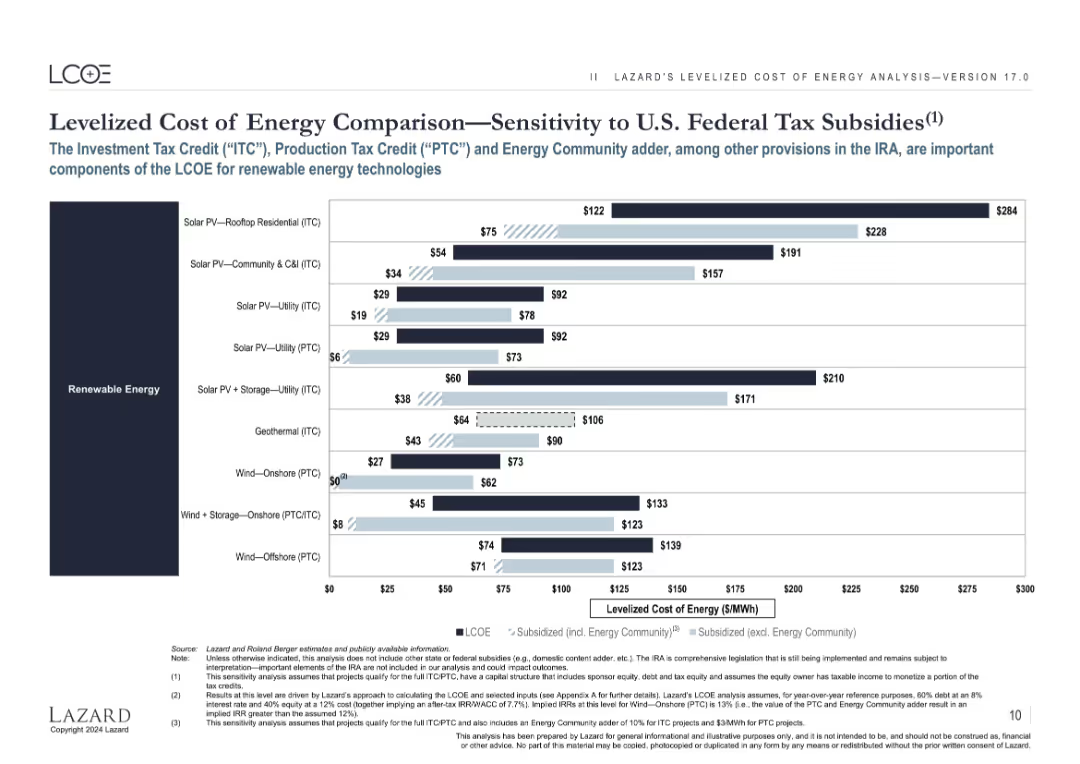
Same chart structure as 16633; includes lighter bars showing impact of ITC/PTC federal subsidies on renewable energy LCOE.
Regulatory and Compliance
Energy & Utilities
Demonstrates how U.S. tax subsidies (ITC/PTC) significantly reduce the LCOE of renewable technologies like solar and wind, improving their economic competitiveness.
subsidies, LCOE, tax credit, ITC, PTC, renewable, energy policy, incentives, U.S. IRA
Single Chart
Roland Berger
Saved
Bar chart showing expected changes in digital transformation funding, highlighting sectors like Consumer Goods and Tech. A quote from a CIO emphasizes investment scrutiny.
Financial Performance
Technology & Software
Discusses anticipated changes in funding for digital transformation across different sectors post-COVID-19, emphasizing the need for careful investment and clear business cases.
funding, digital transformation, post-COVID, investment scrutiny, sectors
Mixed Chart
BCG
Saved
The slide includes a pie chart and a list of areas of expertise in market and opinion research.
Strategic Planning
Professional Services
The slide highlights Ipsos' comprehensive offerings in market and opinion research across different sectors.
expertise, market research, opinion research, Ipsos, sectors, services
Single Chart
IPSOS
Saved
Previous
Next
If nothing, comes up, please save your slides first
Create a FREE account to continue browsing
Receive Instant Access to 1,000+ slides from companies like McKinsey, Google, and Goldman Sachs
First Name
Last Name
Email
Password
I agree to all
Terms & Privacy Policy
Thank you! Your submission has been received!
Oops! Something went wrong while submitting the form.
Have an account?
Sign in
Column Chart
Heatmap
Chevron
Org Chart
Infographic
Callouts
Timeline
List
Graphic
Picture
Process Flow
Diagram
Paragraph
Map
Table
Framework
Subtitle
Takeaway Box
Icon
Other Chart
Radar Chart
Waterfall Chart
Mekko Chart
Pie Chart
Scatter Plot
Line Chart
Bar chart
Bullet points