My Account
My Slides
Search by Category
Templates
Leave Feedback
Login
Logout
Get Started
Browse all Slides
Browse all Slides
Create a FREE Account
Instant access to 1,000+ real slides from top companies like McKinsey, BCG, Goldman Sachs, Google and many more!
First Name
Last Name
Email
Password
I agree to all
Terms & Privacy Policy
Thank you! Your submission has been received!
Oops! Something went wrong while submitting the form.
Have an account?
Sign in
Saved Slides
Horizontal bar charts showing varying degrees of economic activity impairment during the Fight phase of the pandemic across different countries.
Strategic Planning
Financial Services
This slide details the economic risks during the Fight phase of COVID-19, estimating potential temporary impacts on economic activity by country.
Fight phase, economic risks, COVID-19, economic activity, temporary impacts, country analysis, economic challenges
Single Chart
BCG
Saved
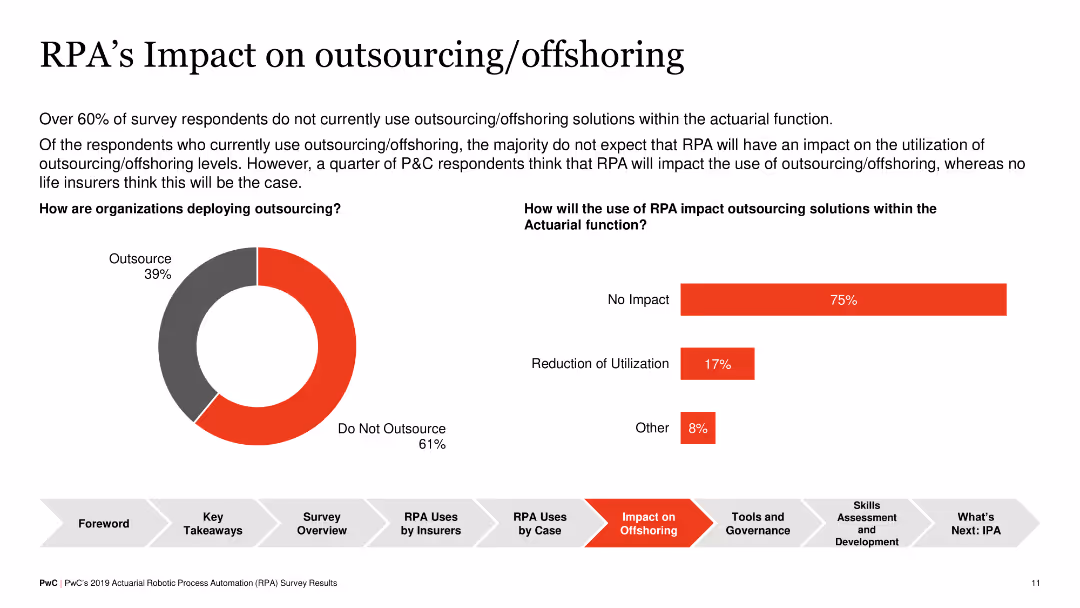
Combination of a pie chart showing the percentage of organizations outsourcing versus not outsourcing, and a horizontal bar chart indicating RPA's impact on outsourcing within actuarial functions (No Impact, Reduction, Other).
Operational Efficiency
Financial Services
The slide examines how RPA affects outsourcing and offshoring in actuarial functions, showing a significant percentage of organizations do not outsource, and those who do don't expect RPA to change their outsourcing levels significantly.
RPA, Outsourcing, Offshoring, Actuarial, Impact
Multiple Chart
PwC/Strategy&
Saved
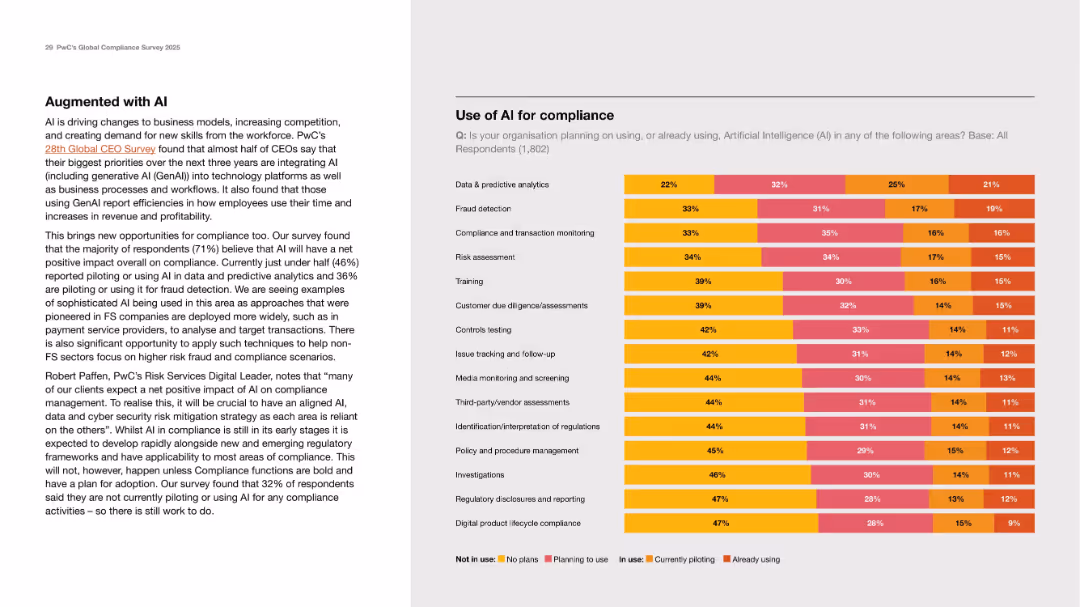
Two-column layout with descriptive text on left and multicolored horizontal stacked bar chart on right.
Technology and Digital Transformation
Artificial Intelligence
This slide explores how organizations are using or planning to use AI for compliance activities. It presents a chart showing the level of AI adoption across 15 areas such as fraud detection, training, and transaction monitoring. The text discusses how AI is expected to positively impact compliance, with 71% expecting a net benefit.
AI, compliance, predictive analytics, fraud detection, digital strategy
Mixed Chart
PwC/Strategy&
Saved
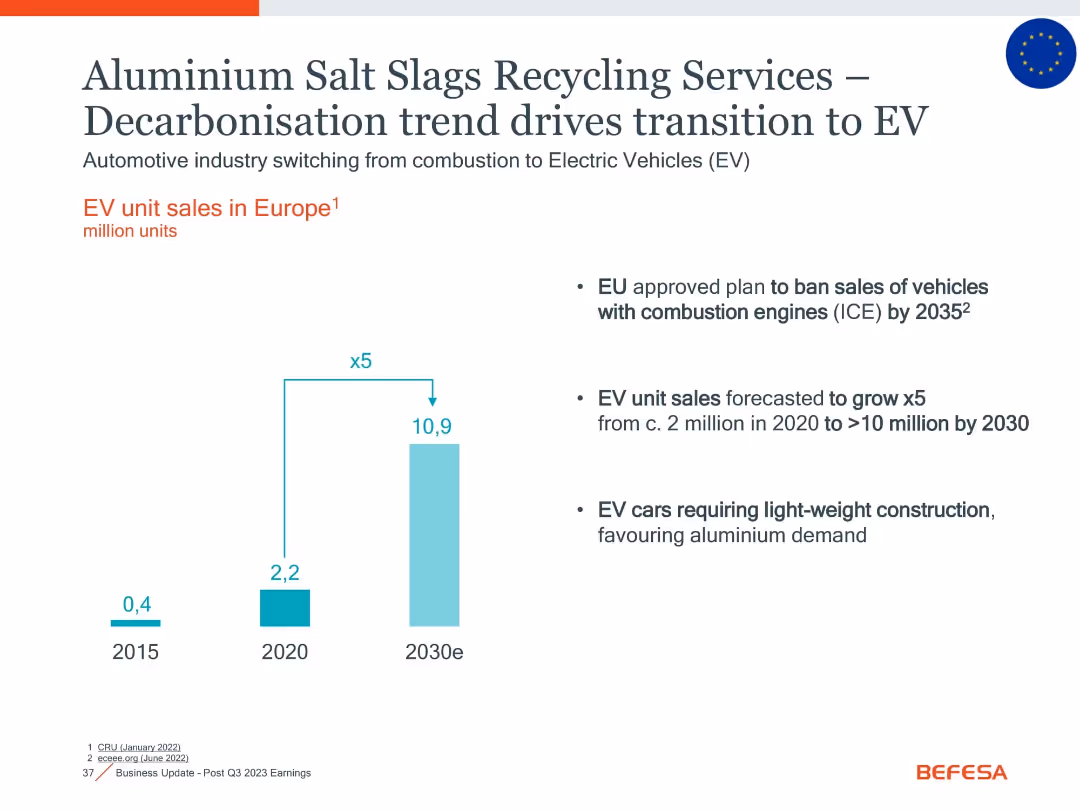
Clean, minimal layout with vertical EV unit sales bar chart; includes text highlights and EU policy info
Market Analysis and Trends
Government & Public Sector
Illustrates Europe’s rapid EV growth and policy bans on ICEs by 2035. Emphasizes increased demand for aluminium recycling driven by lightweight EV construction, positioning Befesa within this market transition.
EV, aluminium, recycling, EU, combustion ban, electrification, lightweight, vehicle sales
Mixed Chart
Goldman Sachs
Saved
A unique spherical image of a cityscape with the title 'Future of Work' atop a stark white background. The slide's visual draws attention with its intricate design and spacing, intended to intrigue and introduce.
Industry Overview
Professional Services
This creative title slide introduces a section or presentation focused on the Future of Work, setting the stage for a discourse on evolving work patterns influenced by technology and globalization. Its eye-catching visual metaphor suggests a world reoriented by new work paradigms, appropriate for thought leadership conferences or strategy sessions.
Future of Work, Introduction, Technology, Globalization, Work Patterns, Strategy, Thought Leadership
Title
Deloitte
Saved
The slide features two column charts displaying oil & gas and leveraged finance exposure over different quarters.
Risk Assessment and Management
Financial Services
This slide provides an overview of Credit Suisse's exposure to oil & gas and leveraged finance, showing trends in non-investment and investment grade loans.
oil & gas exposure, leveraged finance, non-investment grade, investment grade, financial trends
Multiple Chart
Credit Suisse
Saved
Describes DEI initiatives, including tying executive compensation to DEI goals and fostering an inclusive culture.
Strategic Planning
Professional Services
Highlights DEI as a key element of the firm's growth plans and client mission needs.
DEI, diversity, equity, inclusion, leadership, innovation
Text Only
Booz Allen Hamilton
Saved
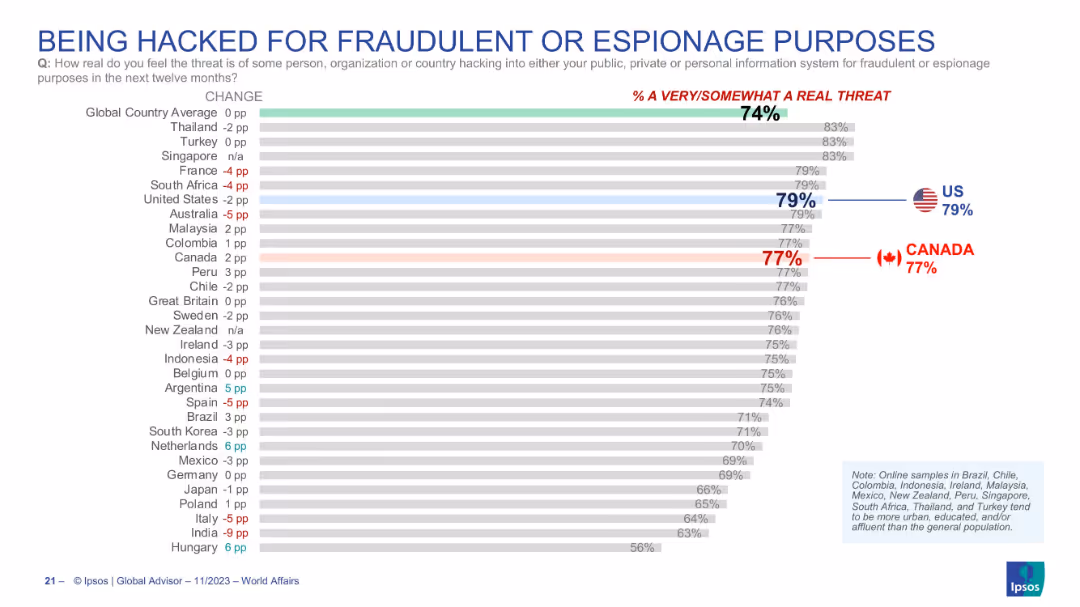
Bar graph showing perceived threat of hacking incidents; horizontal layout; Canada and US emphasized with bold numbers and flags.
Risk Assessment and Management
Technology & Software
The slide conveys the perceived risk of being hacked for fraudulent or espionage purposes over the next twelve months. A high percentage of respondents—79% in the US and 77% in Canada—consider it a real threat. The global average stands at 74%, indicating a widespread concern over cybersecurity.
cybersecurity, hacking, fraud, espionage, threat perception, survey, Canada, USA, digital risk, Ipsos
Single Chart
IPSOS
Saved
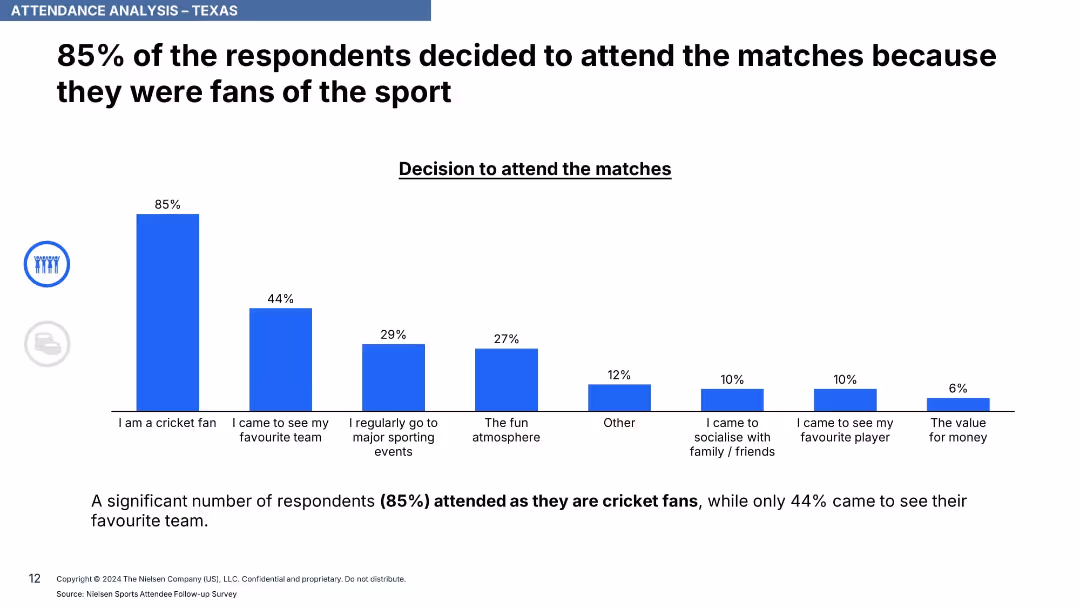
Bar chart showing reasons for attending, ordered from highest to lowest in blue bars.
Customer and Market Segmentation
Media & Entertainment
The slide shows that a large majority (85%) of attendees were cricket fans, with others motivated by team support, event atmosphere, and social reasons. It highlights primary and secondary drivers for event attendance.
fanbase, cricket, motivations, sports attendance, market segmentation, audience behavior, event drivers
Single Chart
Nielsen
Saved
Slide includes line graphs comparing the total cost of ownership of BEVs against other vehicle types, showing the trend towards cost-effectiveness of BEVs.
Investment Analysis
Transportation & Logistics
Provides a financial analysis on the cost-competitiveness of battery electric vehicles over time, useful for investors and companies planning transitions in vehicle fleets.
BEVs, cost analysis, electric vehicles, TCO, automotive economics, investment
Single Chart
BCG
Saved
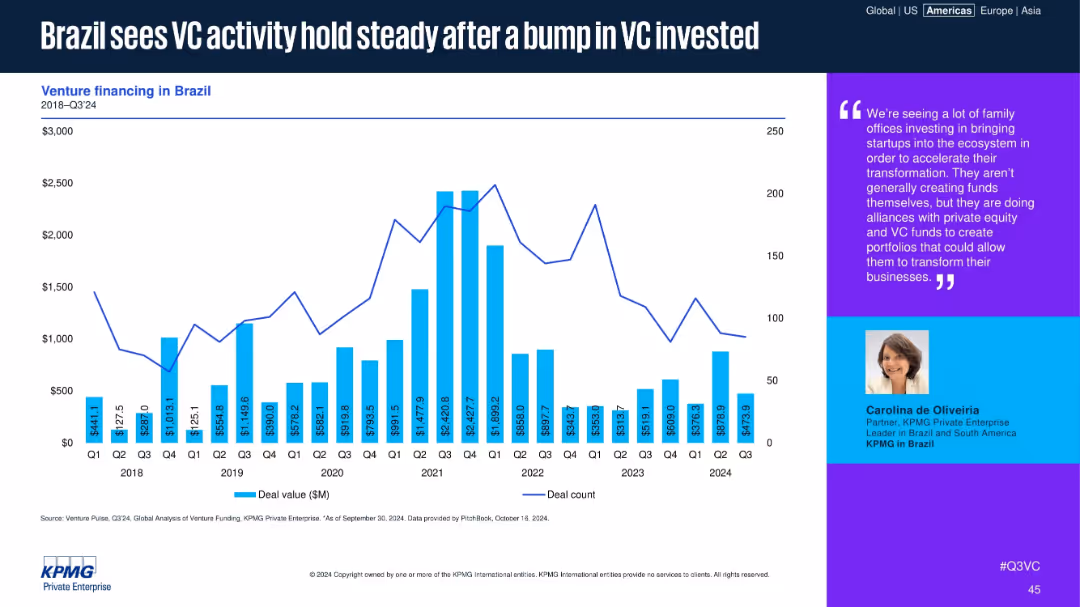
Bar and line chart for Brazil’s VC deal values and counts, with commentary from a regional KPMG partner.
Market Analysis and Trends
Financial Services
Brazil’s VC market has stabilized after a notable funding increase in 2021. While deal counts have dipped, moderate funding levels continue. Commentary highlights family office involvement and alliances with VC and PE funds to support digital transformation.
Brazil, VC activity, LATAM, family offices, KPMG, digital transformation, deal count, venture funding, steady
Mixed Chart
KPMG
Saved
Features bar graphs showing the percentage of metaverse-related tech usage in Southeast Asia by country and a side text explanation.
Market Analysis and Trends
Technology & Software
Analyzes the distribution of metaverse-related technologies across Southeast Asian countries, indicating regional market preferences.
Metaverse, AR, VR, Cryptocurrencies, NFTs, Market Distribution, Southeast Asia, Technology Usage
Multiple Chart
Bain
Saved
This slide presents multiple data visualizations, including bar charts and line graphs, tracking COVID-19's impact on various factors like mobility, economic forecasts, and consumer activity from August to November. Each section uses a different color to denote the type of data being represented, like green for mobility and red for GDP.
Strategic Planning
Financial Services
Summarizes key metrics affected by COVID-19, such as global epidemic progression, mobility trends, GDP forecasts, and stock market performance. It provides a comprehensive overview of how different sectors and regions are recovering from the pandemic impacts.
COVID-19, economic impact, healthcare, GDP, mobility, stock markets
Mixed Chart
BCG
Saved
Line chart showing trends from 2013 to 2022 with annotations and an insight box. Muted purple theme with graphical data points at intervals.
Market Analysis and Trends
Professional Services
Discusses trends in companies having the right talent to leverage marketing analytics, highlighting industry-specific gaps and overall satisfaction levels.
talent, marketing analytics, B2B, B2C, industry trends
Mixed Chart
Deloitte
Saved
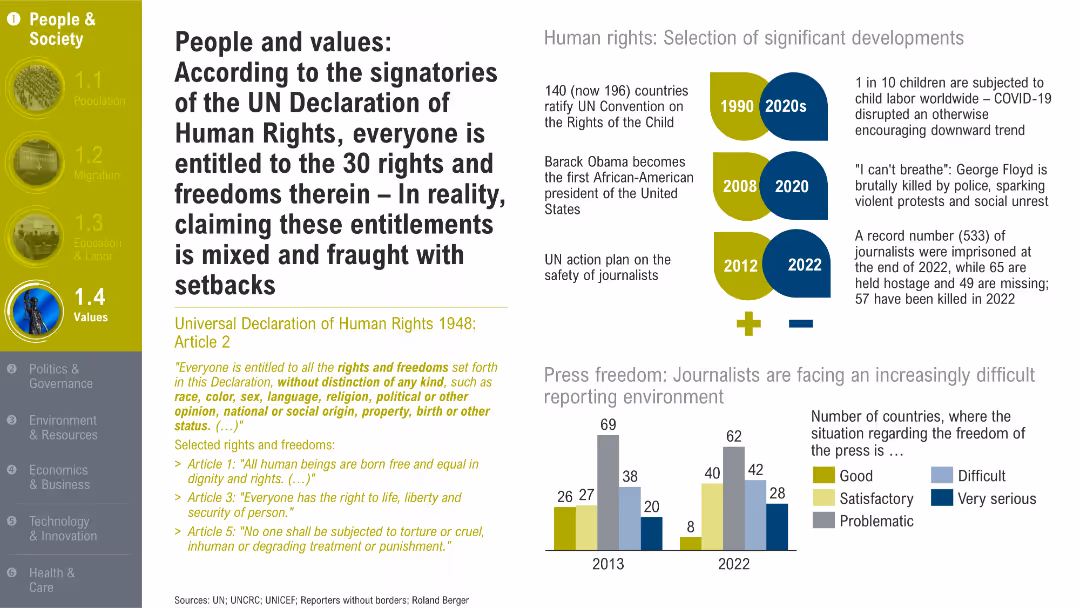
Timeline and rights excerpts on the left, press freedom bar chart on the right, major developments annotated. Uses green and yellow highlight blocks.
Regulatory and Compliance
Government & Public Sector
The slide presents human rights fundamentals and notable milestones while highlighting setbacks in press freedom and journalist safety, despite global commitments to human rights.
human rights, UN Declaration, journalist safety, press freedom, social justice, equality, legal frameworks
Mixed Chart
Roland Berger
Saved
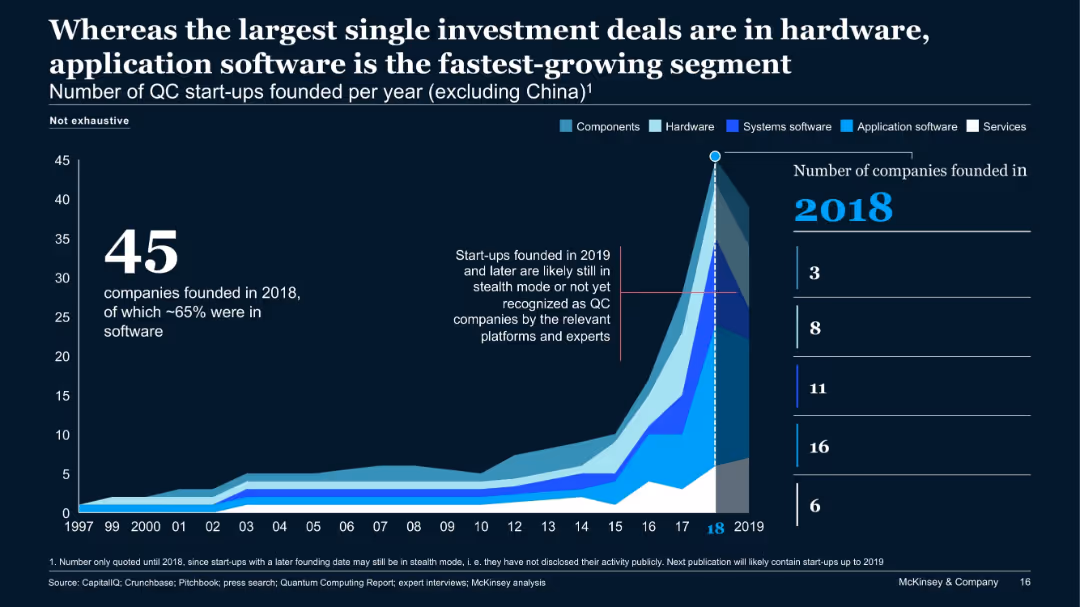
Area chart showing number of QC start-ups founded annually by segment type, excluding China. Emphasizes 2018 as peak year.
Investment Analysis
Technology & Software
The chart illustrates trends in QC start-up formations, peaking in 2018 with 45 companies—65% focused on software. It indicates investment spikes in hardware, while application software shows rapid growth. Start-ups after 2019 may still be in stealth.
QC start-ups, funding, hardware, application software, 2018, stealth, investment trends
Single Chart
McKinsey
Saved
Features a column charts displaying the change in fitness activities before, during, and after COVID-19 lockdowns.
Market Analysis and Trends
Healthcare & Pharmaceuticals
Analyzes trends in fitness behavior changes over the course of the pandemic, illustrating consumer adoption of hybrid routines involving digital and traditional fitness methods.
Fitness, Hybrid, COVID-19, Trends, Bar Charts, Consumer Behavior, Health, Digital
Multiple Chart
McKinsey
Saved
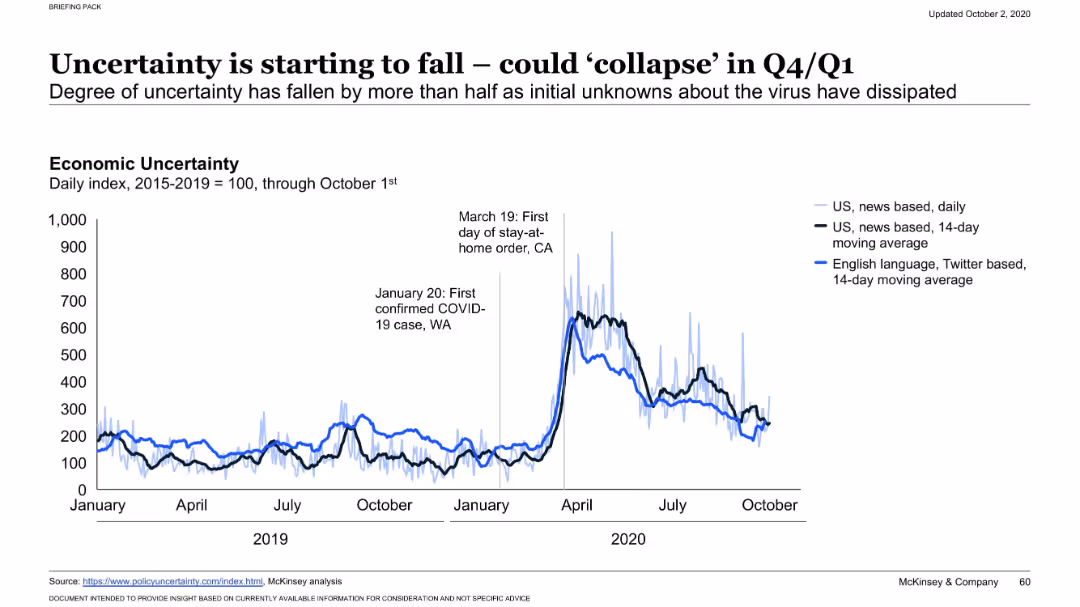
Time series line chart displaying economic uncertainty indices (news-based and Twitter-based) from 2019 to October 2020. Includes key event markers (first COVID case, stay-at-home order).
Risk Assessment and Management
Financial Services
Shows how economic uncertainty, driven by COVID-19 developments, peaked in early 2020 but has since decreased. Multiple data sources (news, social media) illustrate public sentiment, with annotations of major events for context.
economic uncertainty, COVID-19, sentiment index, market volatility, risk perception, trend analysis, news impact, public reaction, confidence indicators, timeline
Single Chart
McKinsey
Saved
Includes two column charts and a map visualizing internet user growth in SEA compared to other regions and countries, with descriptive text boxes.
Market Analysis and Trends
Technology & Software
Analysis of the Southeast Asian internet market, highlighting its rapid growth with a focus on Indonesia. The use of column charts and regional maps illustrates the comparative analysis with other countries.
SEA, internet, growth, Indonesia, column chart, comparative
Multiple Chart
Bain
Saved
The slide features flowcharts with different stages of a customer journey in car buying. It integrates text blocks with directional arrows.
Industry Overview
Technology & Software
This slide visualizes the customer journey in car buying, highlighting market understanding, customer acquisition, risk management, and relationship enhancement as key stages, aimed at optimizing customer experience.
customer journey, car buying, market understanding, risk management, relationship building
Linear Flow
Barclays
Saved
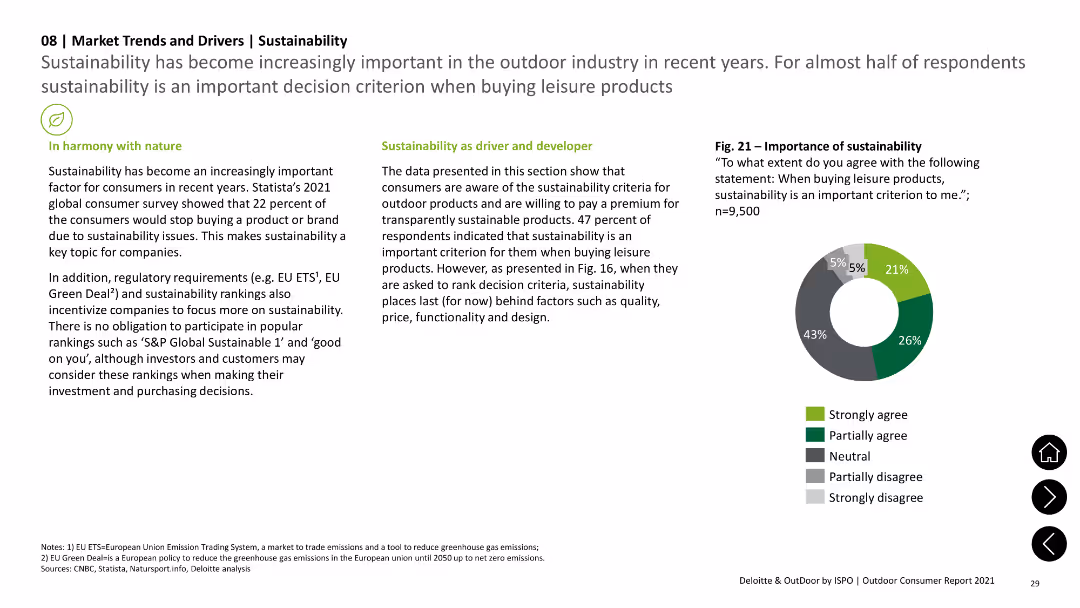
Includes pie chart showing agreement levels on the importance of sustainability in buying decisions, with supporting text on trends and regulations.
Technology and Digital Transformation
Environmental Services & Sustainability
Highlights the importance of sustainability in consumer decision-making and the impact of regulatory requirements on corporate focus on sustainability.
Sustainability, Consumer, Trends, Regulations, Importance
Mixed Chart
Deloitte
Saved
Features three pie charts detailing the growing familiarity with the metaverse, accompanied by a photograph of a woman using VR gear.
Market Analysis and Trends
Telecommunications
Discusses increasing public knowledge and interest in the metaverse, reflecting broader trends in technology engagement.
metaverse, technology adoption, VR, public knowledge, market trends
Multiple Chart
Deloitte
Saved
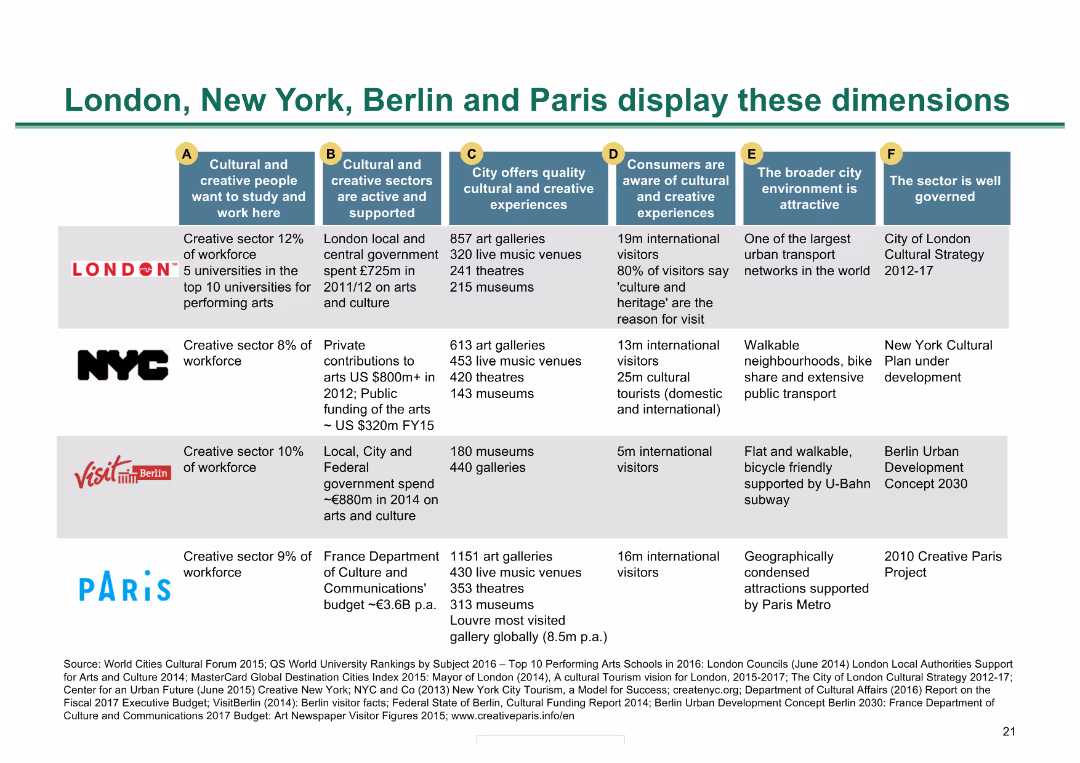
Table comparing cultural metrics across four major cities; color-coded for clarity
Market Analysis and Trends
Hospitality & Tourism
Compares cultural and creative metrics of London, New York, Berlin, and Paris, showing strengths and metrics
City comparison, cultural metrics, global cities, creative sectors, cultural experiences
Diagram
BCG
Saved
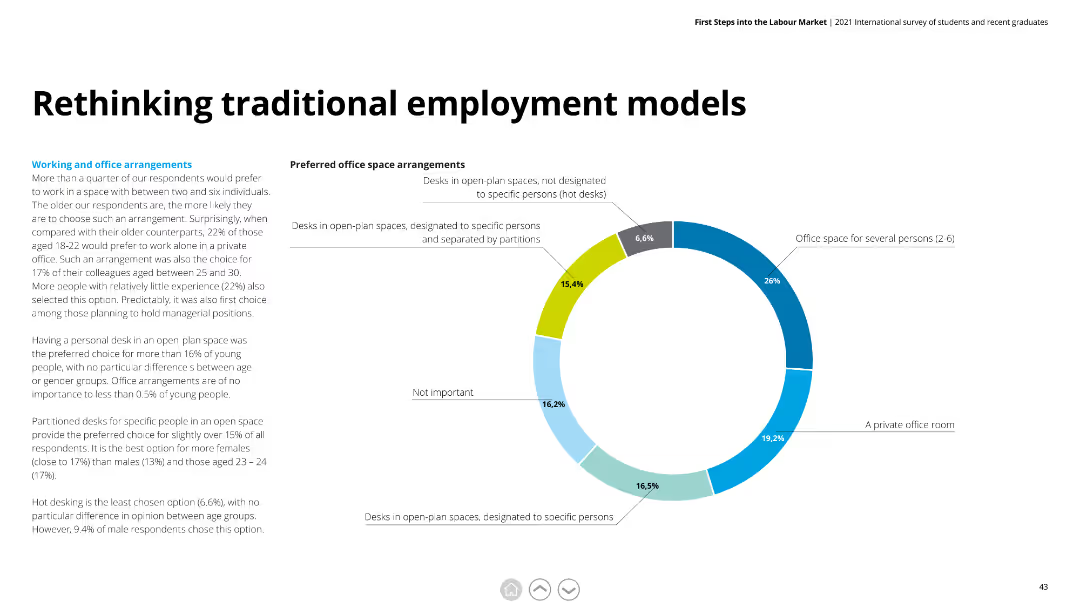
Features a pie chart with multiple segments in various shades of blue and green. Text is organized into two columns, providing detailed explanations of survey findings and their implications.
Human Resources and Talent Management
Professional Services
Explores preferred office space arrangements among respondents. Highlights preferences for open-plan spaces, private offices, and designated desks.
employment models, office space, preferences, open-plan, private offices, designated desks
Mixed Chart
Deloitte
Saved
Diagram with strategic business units around a central circle named 'Goldman Sachs' with dashed lines pointing to partner logos.
Investment Analysis
Technology & Software
Explores Goldman Sachs' business segments and strategic partnerships with tech companies like GitLab and Pensando.
innovation, Goldman Sachs, partnerships, business segments, tech companies, GitLab, Pensando
Framework
Goldman Sachs
Saved
Previous
Next
If nothing, comes up, please save your slides first
Create a FREE account to continue browsing
Receive Instant Access to 1,000+ slides from companies like McKinsey, Google, and Goldman Sachs
First Name
Last Name
Email
Password
I agree to all
Terms & Privacy Policy
Thank you! Your submission has been received!
Oops! Something went wrong while submitting the form.
Have an account?
Sign in
Column Chart
Heatmap
Chevron
Org Chart
Infographic
Callouts
Timeline
List
Graphic
Picture
Process Flow
Diagram
Paragraph
Map
Table
Framework
Subtitle
Takeaway Box
Icon
Other Chart
Radar Chart
Waterfall Chart
Mekko Chart
Pie Chart
Scatter Plot
Line Chart
Bar chart
Bullet points