My Account
My Slides
Search by Category
Templates
Leave Feedback
Login
Logout
Get Started
Browse all Slides
Browse all Slides
Create a FREE Account
Instant access to 1,000+ real slides from top companies like McKinsey, BCG, Goldman Sachs, Google and many more!
First Name
Last Name
Email
Password
I agree to all
Terms & Privacy Policy
Thank you! Your submission has been received!
Oops! Something went wrong while submitting the form.
Have an account?
Sign in
Saved Slides
Features text with a bar chart showing the acceleration of net zero commitments from different organizations and countries between 2020 and 2021.
Strategic Planning
Environmental Services & Sustainability
Discusses the acceleration of decarbonization commitments by governments and businesses, highlighting the significant increase in net zero targets within a year.
Net zero, commitment, government, business, decarbonization, target, emissions, sustainability
Multiple Chart
EY
Saved
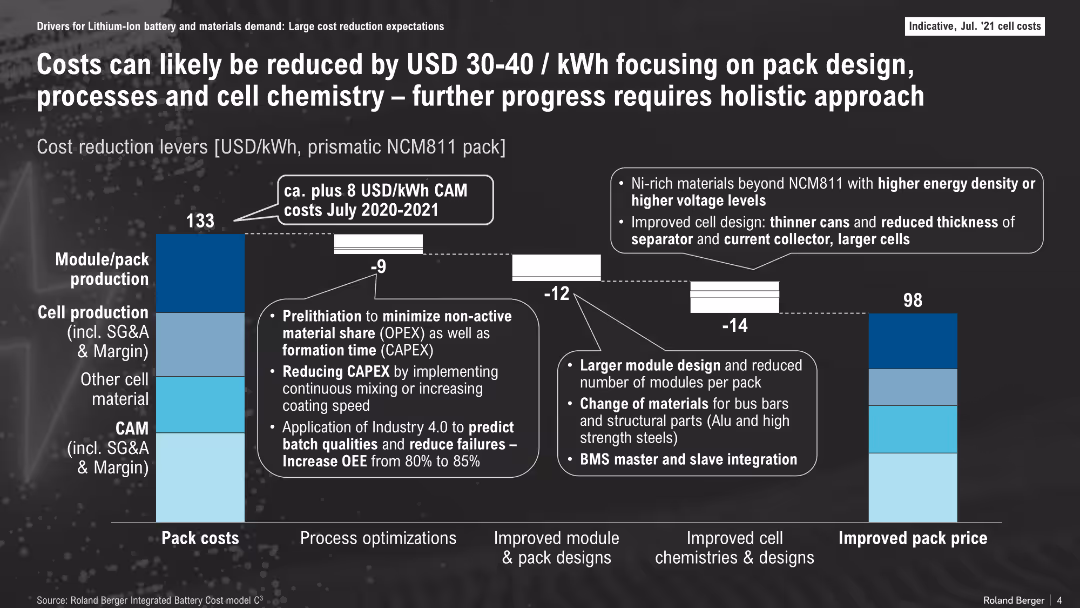
Bar chart comparing 2020-2021 and future cost breakdowns with annotations; segmented by cost areas
Operational Efficiency
Energy & Utilities
This slide breaks down battery pack cost components and shows how design, process, and material improvements can lower costs from $133/kWh to $98/kWh. Key levers include pack/module redesign, cell production optimization, and chemistry upgrades.
cost reduction, pack design, NCM811, cell production, BMS, energy storage, CAPEX
Mixed Chart
Roland Berger
Saved
A table with key financial metrics on the left, a list of goals as a 5-year consumer opportunity in the center, and a column chart displaying forward pre-tax margin on the right.
Financial Performance
Financial Services
A financial overview showcasing past earnings and future goals for consumer and wealth management margins, indicating a strategic focus on increasing profitability.
Margins, consumer, wealth, profitability, financial
Mixed Chart
Goldman Sachs
Saved
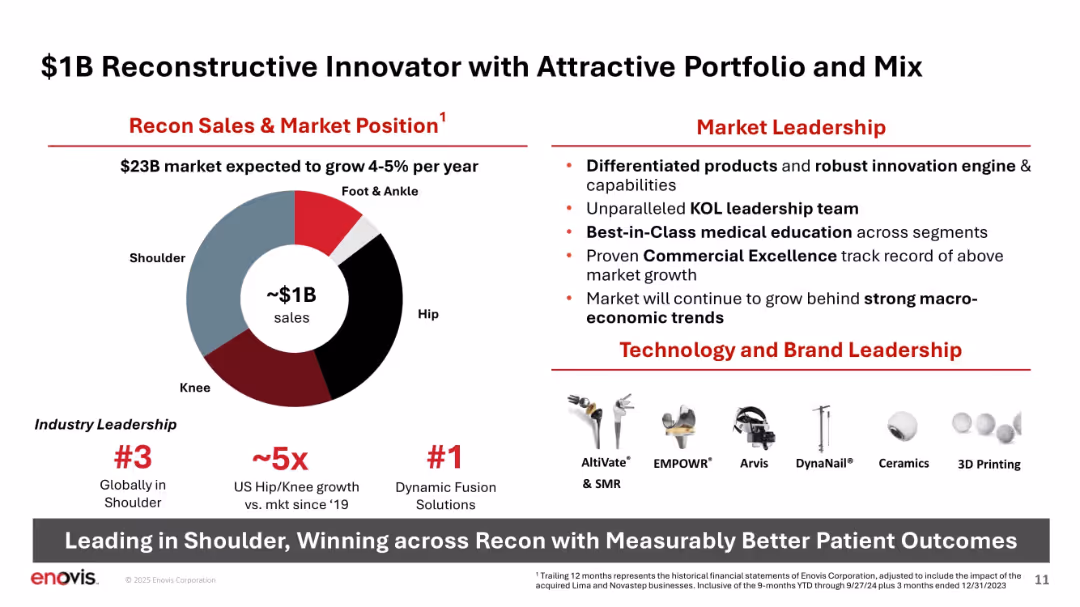
Donut chart for sales distribution; bulleted leadership traits and product visuals; bold typography.
Product and Service Analysis
Healthcare & Pharmaceuticals
Breaks down Recon’s ~$1B sales across anatomical segments (e.g., shoulder, hip), highlights market leadership, differentiated technology, and portfolio strength. Emphasizes innovation and strong competitive position in orthopedic reconstructive.
Recon, portfolio, innovation, sales mix, leadership, shoulder, hip, knee, products
Mixed Chart
JP Morgan
Saved
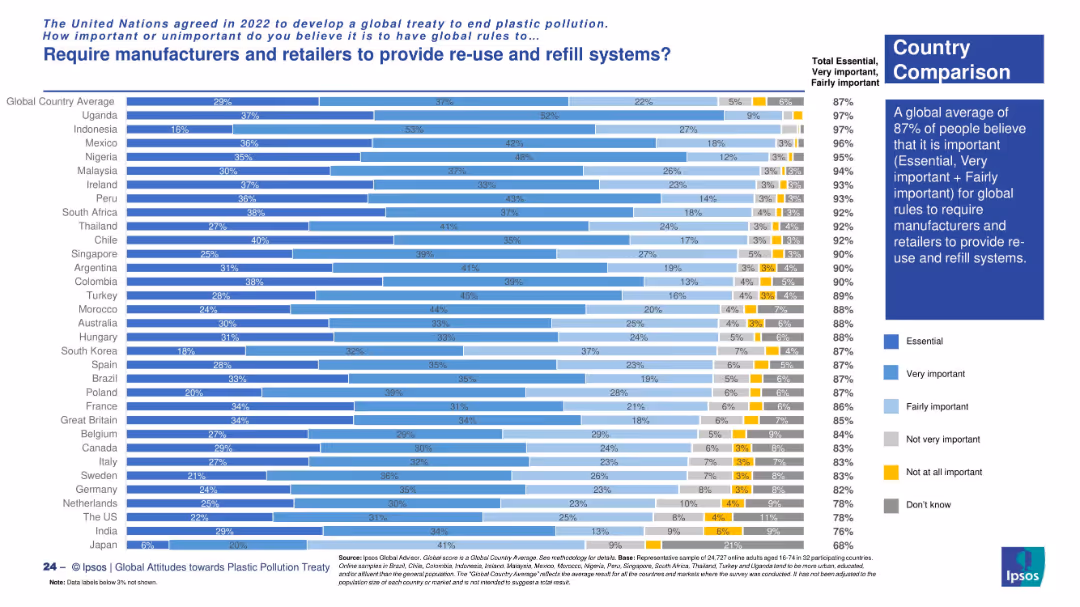
Vertical bar chart showing country-wise opinion. Colored segments represent importance levels. Insight box provides overall summary.
Product and Service Analysis
Environmental Services & Sustainability
This chart indicates 87% global support for rules requiring manufacturers and retailers to offer reuse and refill systems. High support is especially notable in Uganda, Indonesia, and Mexico.
reuse systems, refill policy, consumer goods, sustainability, environmental responsibility, global rules
Mixed Chart
IPSOS
Saved
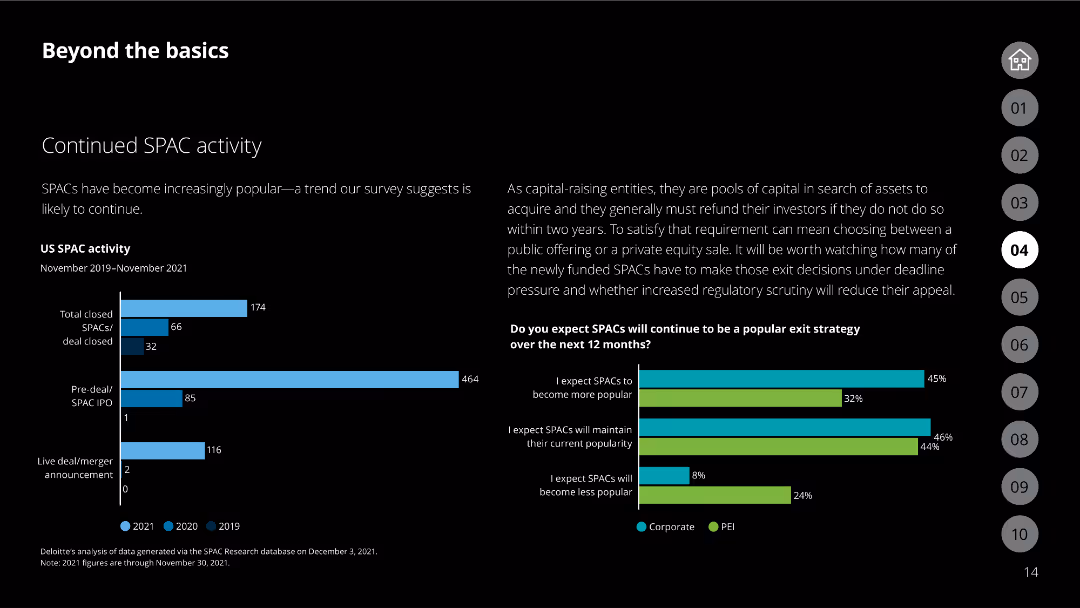
The slide includes a bar chart showing US SPAC activity from 2019 to 2021 and a bar chart on SPAC exit strategy expectations.
Market Analysis and Trends
Financial Services
Analyzes the continued popularity of SPACs and expectations for their future exit strategies.
SPAC, exit strategy, market trends, corporate, PEI
Multiple Chart
Deloitte
Saved
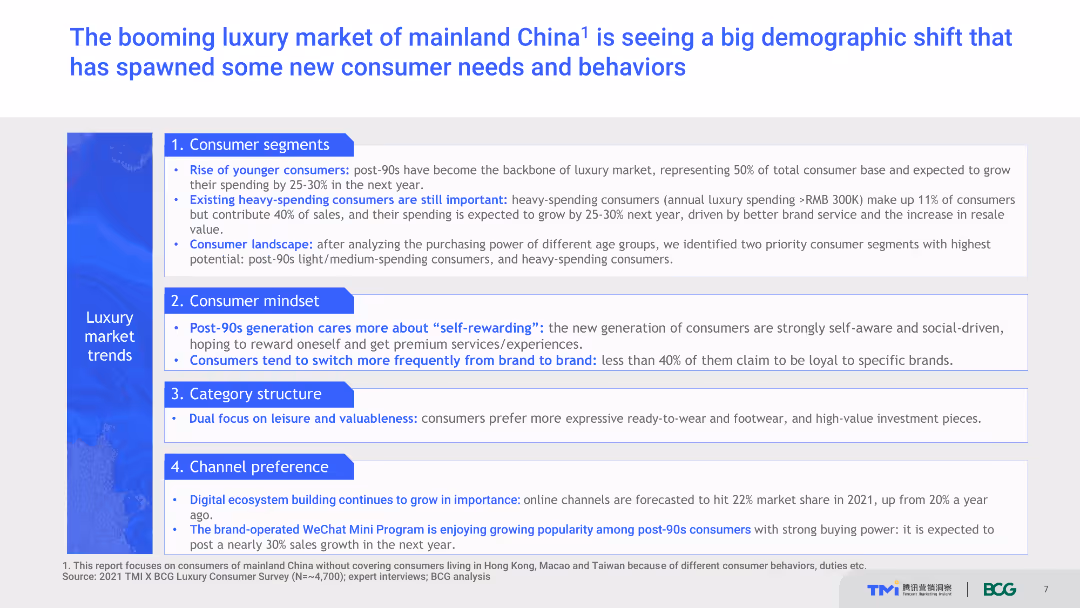
The slide lists consumer segments, mindset, category structure, and channel preference trends in the luxury market of mainland China.
Market Analysis and Trends
Retail & E-commerce
This slide discusses the demographic shifts and emerging trends in the luxury market of mainland China, highlighting new consumer needs and behaviors, particularly among post-90s generation and heavy-spending consumers.
Luxury market, China, consumer trends, demographic shift, spending behavior
Header Vertical
BCG
Saved
The slide features column charts and a pie chart to show sector revenue diversification across various sectors including Pharma, Public Sector, GAFA, and CPG.
Market Analysis and Trends
Financial Services
The slide presents a revenue growth analysis of different sectors, highlighting CAGR from 2019-2022 and the share of revenue by sector in 2022.
Revenue diversification, sector analysis, column chart, pie chart, CAGR
Multiple Chart
IPSOS
Saved
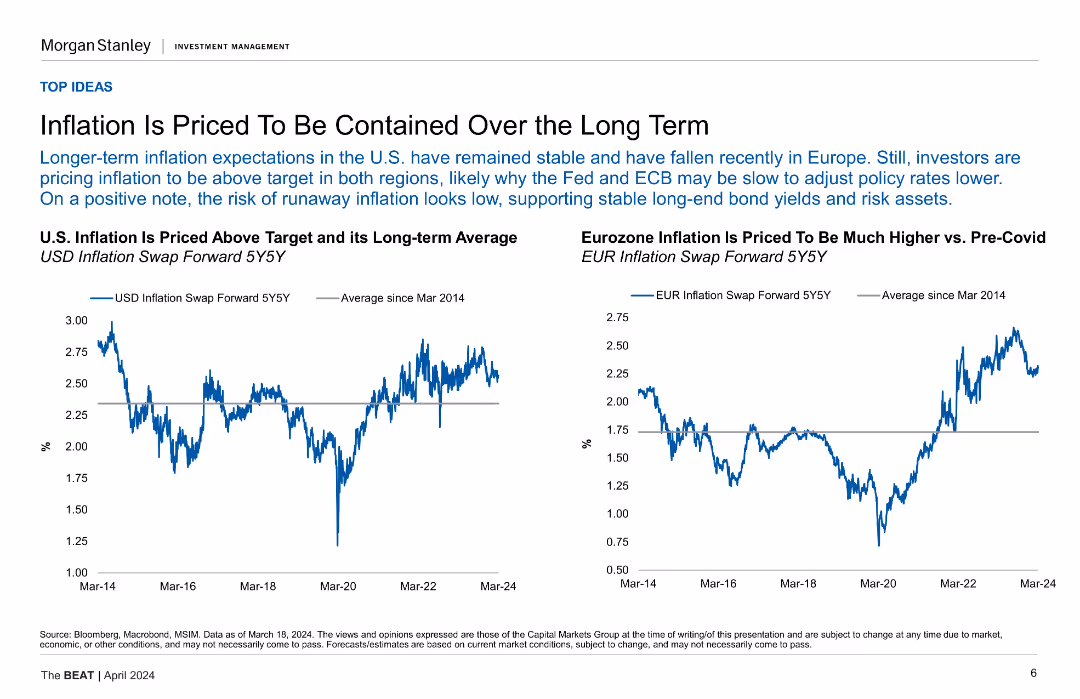
Two line charts comparing U.S. and Eurozone inflation against their long-term averages.
Market Analysis and Trends
Financial Services
This slide analyzes the long-term expectations for inflation in the U.S. and Eurozone, suggesting that inflation will remain stable and above target in both regions.
Inflation, U.S., Eurozone, Long-Term, Comparison, Containment
Multiple Chart
Morgan Stanley
Saved
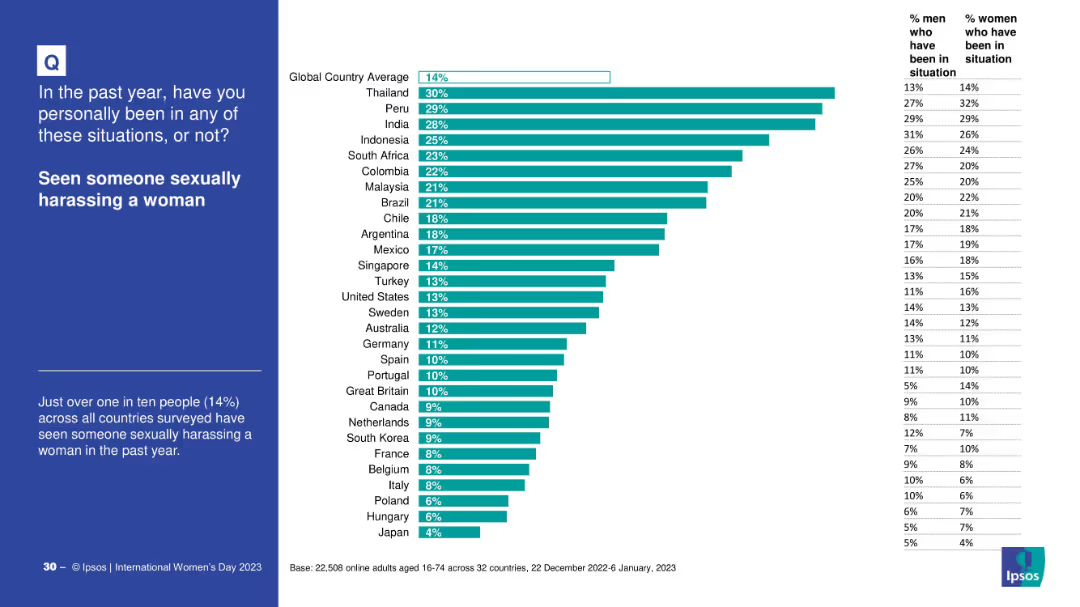
Country-wise bar chart on witnessing sexual harassment, with gender breakdown. Global average line included.
Risk Assessment and Management
Government & Public Sector
This slide presents global data on the percentage of people who witnessed sexual harassment of women in the past year. Thailand and Peru report the highest percentages, while Japan is lowest.
harassment, gender issues, observation statistics, global variance, witness data
Mixed Chart
IPSOS
Saved
Slide with a casual image on the left and a focused, bulleted list on the right, detailing factors that can convert detractors into promoters in the food delivery industry, providing a balance of visual appeal and informative content.
Customer and Market Segmentation
Retail & E-commerce
Offers strategic insights into consumer preferences in food delivery, highlighting key factors that affect customer satisfaction and loyalty, and suggesting ways to improve service quality to increase promoter numbers.
food delivery, customer satisfaction, service improvement, detractors, promoters, Net Promoter Score, loyalty strategies
Agenda
Bain
Saved
Combines multiple elements: bar charts on population and purchasing power, column charts detailing coffee consumption and e-commerce sales, and a pie chart comparing premium vs. affordable market sales.
Strategic Planning
Consumer Goods
Discusses multiple drivers for future growth in emerging markets, including demographic trends, consumer behavior, and digital transformation. This slide supports strategic planning by highlighting key areas for investment and development.
growth drivers, emerging markets, strategic planning, digital transformation, consumer trends
Multiple Chart
Deutsche Bank
Saved
A column chart comparing the approximate values lost by users during incidents such as hacking, fraud, or scams in 2023 and 2022.
Risk Assessment and Management
Financial Services
This slide displays the reported financial losses during incidents involving hacking or fraud on crypto trading platforms, comparing 2023 and 2022.
Value, loss, incident, hacking, fraud, 2023, 2022
Mixed Chart
IPSOS
Saved
This slide uses a table format to present examples of industry players in Web3, with a column for industry, example, and description. The design is straightforward with a white background and colored icons for visual differentiation.
Industry Overview
Technology & Software
Provides examples of influential companies and initiatives within various industries that are leveraging Web3 technologies, such as the USDF consortium in financial services and Nike's acquisition in gaming.
Industry Players, Web3, Innovation, Case Studies
Header Vertical
McKinsey
Saved
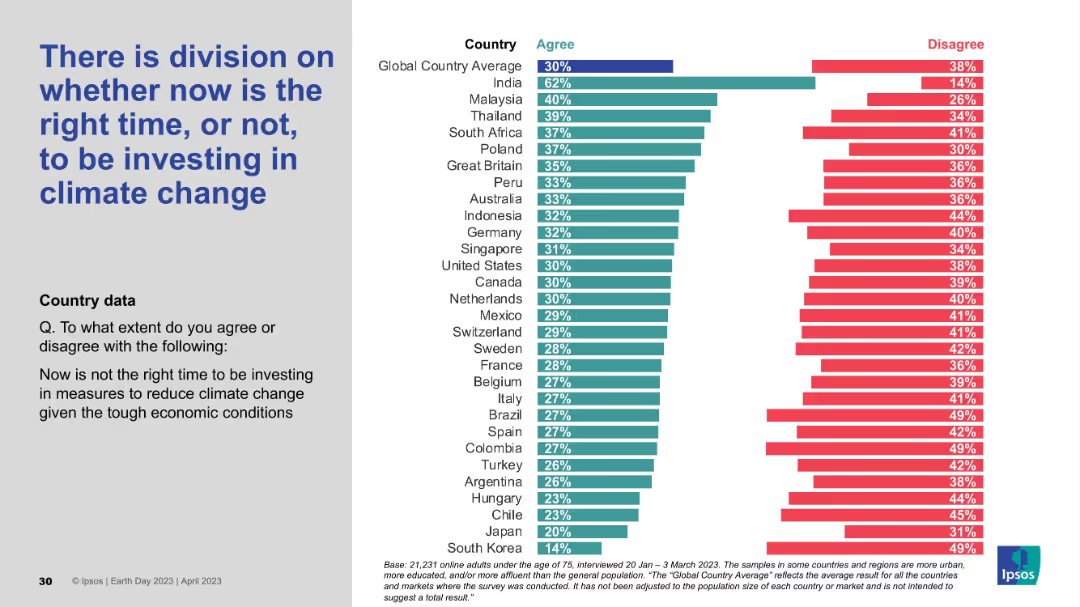
Layout includes left-aligned text and a country-based agreement/disagreement bar chart. Shows mixed levels of agreement across regions.
Investment Analysis
Environmental Services & Sustainability
This slide addresses timing concerns over investing in climate action during economic uncertainty. Opinions are divided, indicating that while some countries like India support immediate investment, others remain hesitant, revealing a tension between urgency and economic pressure.
climate investment, economic conditions, timing debate, public opinion, Ipsos, climate strategy
Mixed Chart
IPSOS
Saved
Three columns comparing investment offering, structured lending capability, and cross-divisional collaboration.
Competitive Landscape
Financial Services
Describes Credit Suisse's unique capabilities that set it apart in the market, focusing on investments and lending solutions.
investment, lending, collaboration, competitive advantage, client value
Pillar
Credit Suisse
Saved
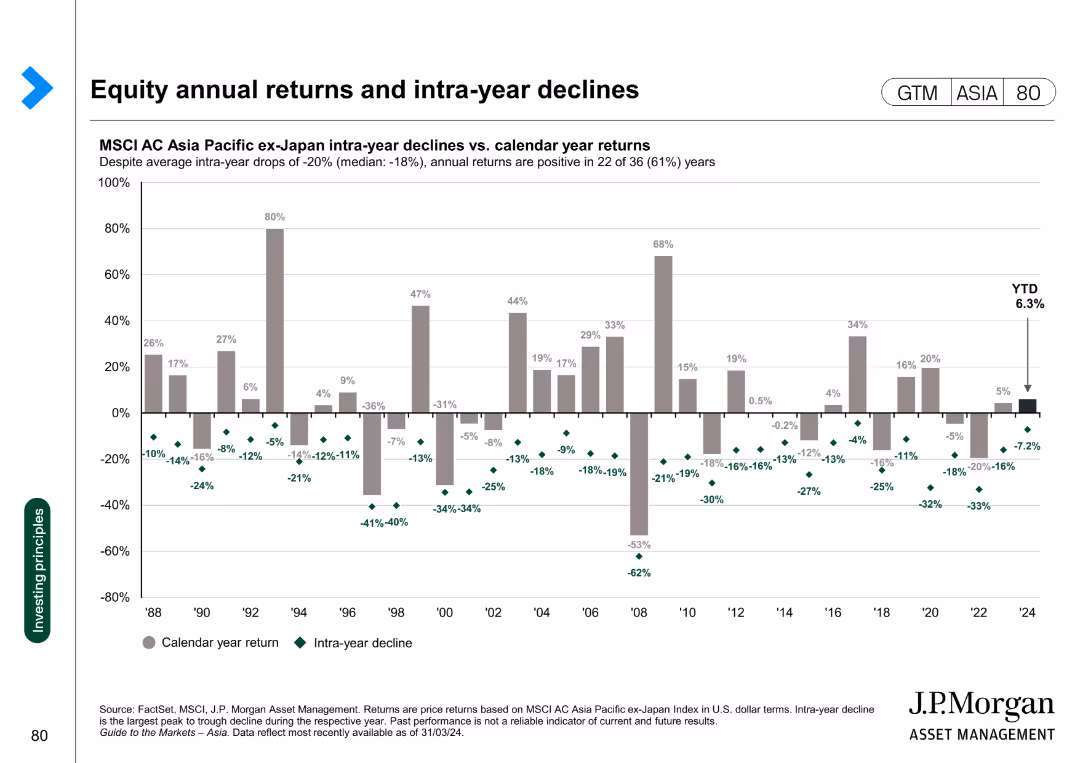
Column chart showing the intra-year declines versus calendar year returns for the MSCI AC Asia Pacific ex-Japan Index from 1988 to 2024.
Financial Performance
Financial Services
This slide analyzes the annual returns and intra-year declines of the MSCI AC Asia Pacific ex-Japan Index, highlighting the volatility and overall performance over the years.
equity, returns, declines, MSCI, volatility
Single Chart
JP Morgan
Saved
Includes predictive analytics displayed through line graphs and future market projections for the FoodTech sector, with annotations for projected growth trends and investment hotspots.
Financial Performance
Agriculture & Food Production
Forecasts future trends in FoodTech investments, highlighting areas expected to see significant growth and investment opportunities. Useful for investors and analysts focusing on future market potentials and growth forecasting in FoodTech.
FoodTech, Investment Forecast, Growth Trends, Market Projections, Future Opportunities
Mixed Chart
Accenture
Saved
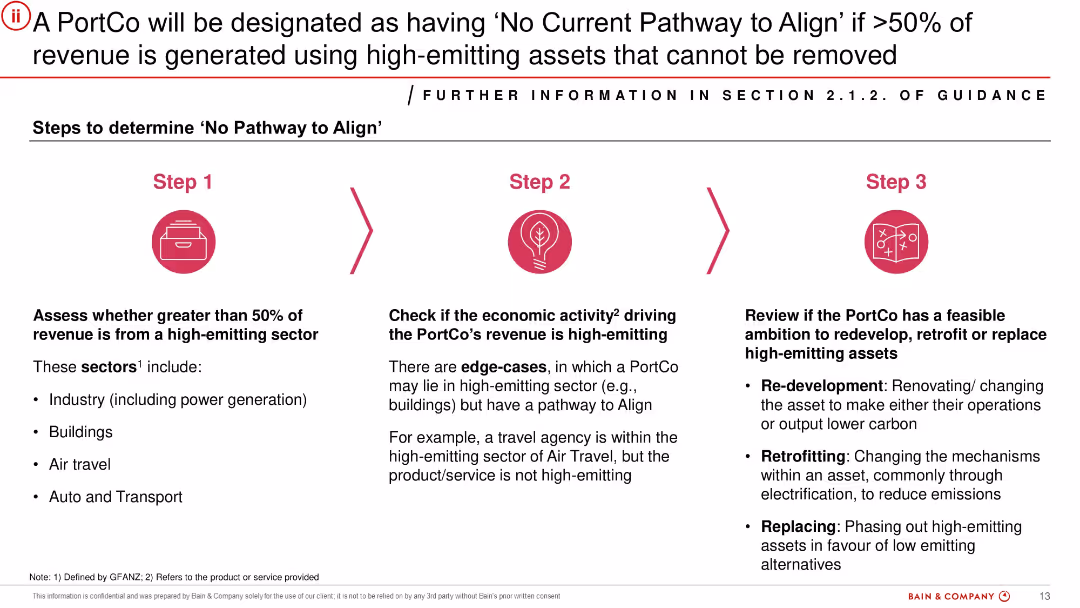
Step-by-step infographic with three sequential steps illustrated using icons. Each step has a title, brief description, and examples. Red icons and arrows highlight progression.
Risk Assessment and Management
Financial Services
Details a framework for determining when a PortCo has no viable path to align with decarbonisation goals. Criteria include revenue from high-emitting sectors, nature of economic activities, and feasibility of asset transition. Intended to classify assets realistically based on emissions challenges.
high-emitting sectors, alignment, risk, emissions, PortCo, feasibility, transition plan
Linear Flow
Bain
Saved
Column chart showing the demand projection for various API-related roles over the next 12 months, including Software Developer, DevOps Engineer, and API Engineer, with a breakdown of current roles and future plans.
Human Resources and Talent Management
Technology & Software
The slide analyzes the demand for different API-related roles in software development, indicating which roles are likely to see increased hiring and which ones will remain stable or decrease.
API roles, demand, software development, projections
Single Chart
Gartner
Saved
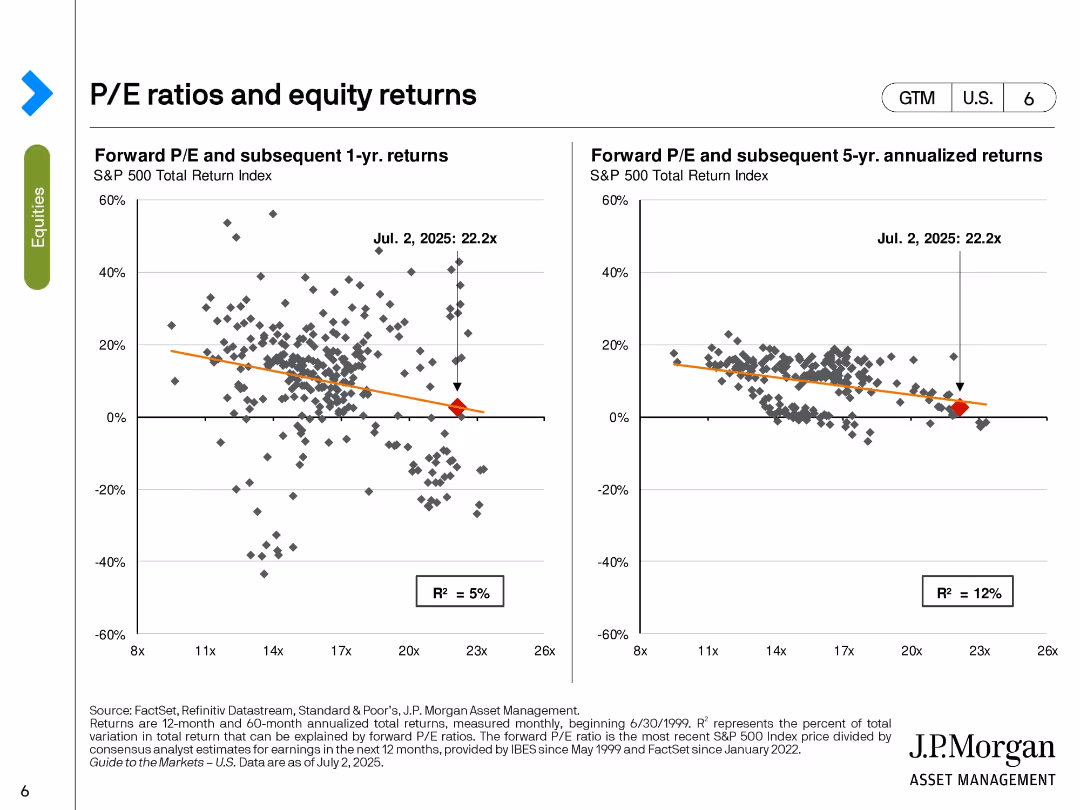
Two scatter plots with trendlines; left shows 1-year returns, right shows 5-year annualized returns, based on forward P/E ratio.
Investment Analysis
Financial Services
This slide analyzes the relationship between forward P/E ratios and subsequent equity returns. It demonstrates weak correlations, with R² values of 5% (1-year) and 12% (5-year), suggesting limited predictive power of P/E for short- and mid-term returns. Current P/E is marked at 22.2x.
P/E ratio, returns, scatter plot, S&P 500, equity analysis, forward valuation, performance forecasting, R-squared, investment strategy
Multiple Chart
JP Morgan
Saved
Features bar charts comparing the responses of China and US CEOs regarding adjustments due to trade conflicts. The data is neatly organized, with each response category color-coded for quick reference and comparison.
Risk Assessment and Management
Financial Services
This slide compares the strategic responses of CEOs in China and the US to trade conflicts, highlighting shifts in production and supply chain strategies. It is useful for assessing the impact of geopolitical risks on business strategies.
Trade conflicts, CEO strategies, Production shift, Supply chain adjustments, Geopolitical impact, Market strategy
Multiple Chart
PwC/Strategy&
Saved
Includes column charts comparing opinions between those aware of and those who have used Generative AI, focusing on perceptions of accuracy and bias.
Market Analysis and Trends
Technology & Software
Analyzes consumer perceptions of Generative AI's accuracy and bias, revealing a significant divide in understanding its flaws.
Generative AI, consumer perceptions, accuracy, bias, technology understanding
Multiple Chart
Deloitte
Saved
A two-section slide with a medium level of detail. The top half categorizes industries using Web3 with icons and brief descriptions, while the bottom half lists details for each industry with icons, all against a blue background.
Market Analysis and Trends
Technology & Software
Highlights industries like media, retail, and financial services that are beginning to adopt Web3 technologies. It outlines how each sector is leveraging these innovations for gaming, digital art, retail experiences, and decentralized finance.
Gaming, Retail, DeFi, Digital Art, Innovation
Header Horizontal
McKinsey
Saved
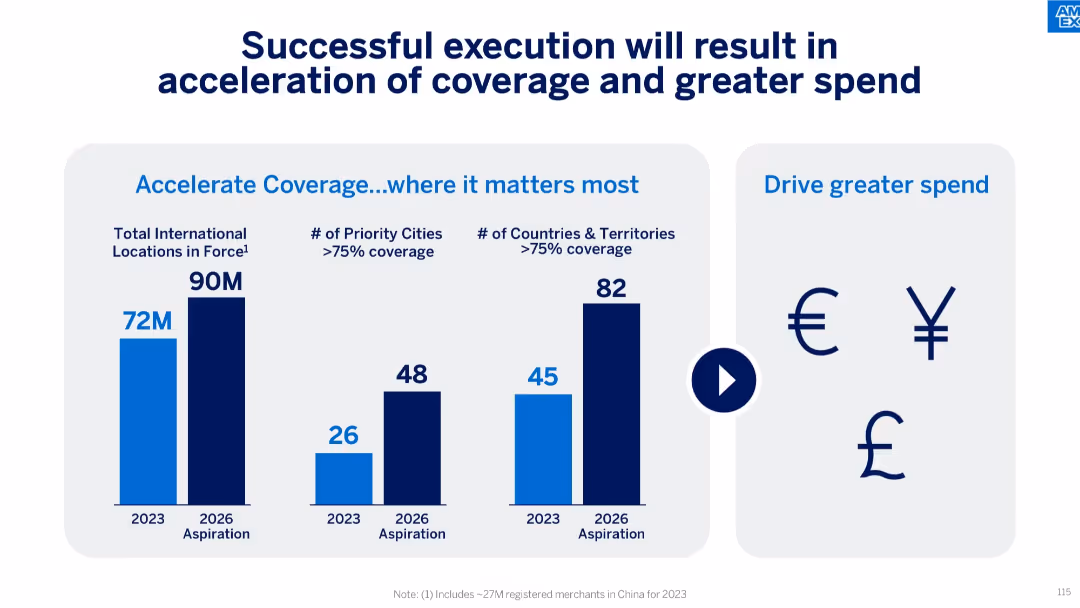
Triple bar chart on the left (locations, cities, countries) with currency icons on the right; blue gradient theme.
Strategic Planning
Financial Services
The slide communicates the company’s aspiration to increase international LIF coverage and drive spending. It forecasts growth in total locations, number of priority cities with >75% coverage, and countries meeting the same metric by 2026.
international growth, priority cities, spending increase, LIF expansion, future goals, merchant locations, Amex strategy
Mixed Chart
McKinsey
Saved
Previous
Next
If nothing, comes up, please save your slides first
Create a FREE account to continue browsing
Receive Instant Access to 1,000+ slides from companies like McKinsey, Google, and Goldman Sachs
First Name
Last Name
Email
Password
I agree to all
Terms & Privacy Policy
Thank you! Your submission has been received!
Oops! Something went wrong while submitting the form.
Have an account?
Sign in
Column Chart
Heatmap
Chevron
Org Chart
Infographic
Callouts
Timeline
List
Graphic
Picture
Process Flow
Diagram
Paragraph
Map
Table
Framework
Subtitle
Takeaway Box
Icon
Other Chart
Radar Chart
Waterfall Chart
Mekko Chart
Pie Chart
Scatter Plot
Line Chart
Bar chart
Bullet points